. 2023 Jun:92:104625.
doi: 10.1016/j.ebiom.2023.104625. Epub 2023 May 22.

Gene expression signature predicts rate of type 1 diabetes progression

Collaborators, Affiliations

Gene expression signature predicts rate of type 1 diabetes progression

Tomi Suomi et al. EBioMedicine. 2023 Jun.

Abstract

Background: Type 1 diabetes is a complex heterogenous autoimmune disease without therapeutic interventions available to prevent or reverse the disease. This study aimed to identify transcriptional changes associated with the disease progression in patients with recent-onset type 1 diabetes.

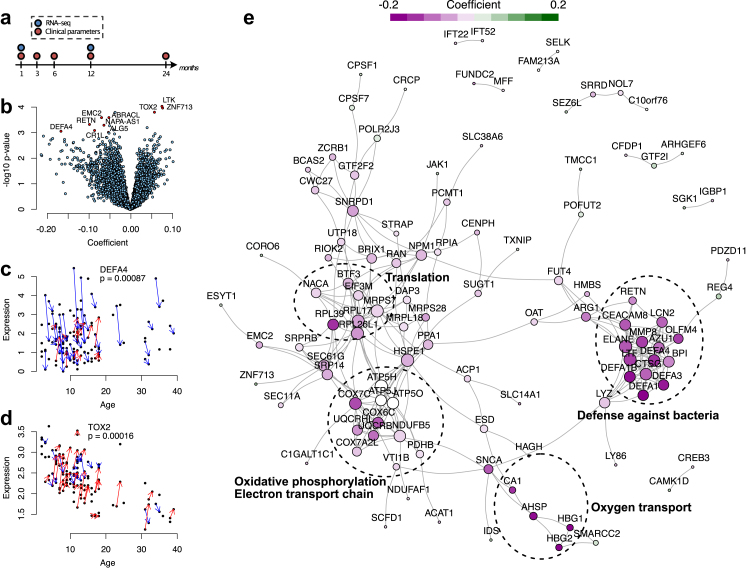
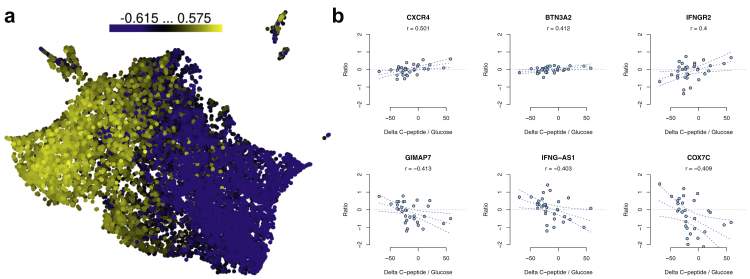
Methods: Whole-blood samples were collected as part of the INNODIA study at baseline and 12 months after diagnosis of type 1 diabetes. We used linear mixed-effects modelling on RNA-seq data to identify genes associated with age, sex, or disease progression. Cell-type proportions were estimated from the RNA-seq data using computational deconvolution. Associations to clinical variables were estimated using Pearson's or point-biserial correlation for continuous and dichotomous variables, respectively, using only complete pairs of observations.

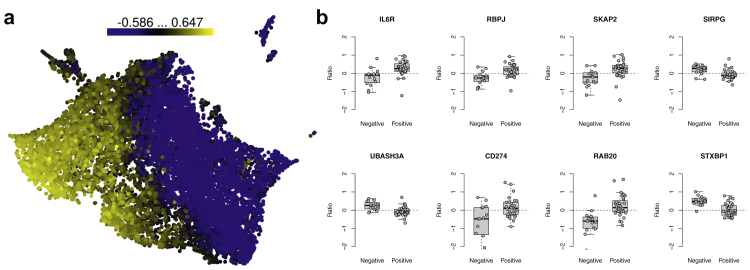
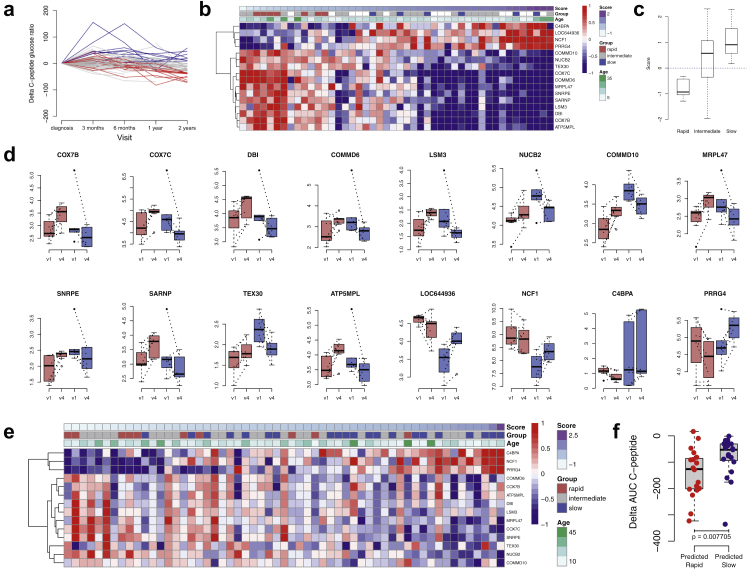
Findings: We found that genes and pathways related to innate immunity were downregulated during the first year after diagnosis. Significant associations of the gene expression changes were found with ZnT8A autoantibody positivity. Rate of change in the expression of 16 genes between baseline and 12 months was found to predict the decline in C-peptide at 24 months. Interestingly and consistent with earlier reports, increased B cell levels and decreased neutrophil levels were associated with the rapid progression.

Interpretation: There is considerable individual variation in the rate of progression from appearance of type 1 diabetes-specific autoantibodies to clinical disease. Patient stratification and prediction of disease progression can help in developing more personalised therapeutic strategies for different disease endotypes.

Funding: A full list of funding bodies can be found under Acknowledgments.

Keywords: Autoantibodies; Gene expression signature; Predictive model; RNA-seq; Type 1 diabetes.


Conflict of interest statement

Declaration of interests CM serves or has served on the advisory panel for ActoBio Therapeutics, AstraZeneca, Avotres, Boehringer Ingelheim, Eli Lilly and Company, Imcyse, Insulet, Mannkind, Medtronic, Merck Sharp and Dohme Ltd., Novartis, Novo Nordisk, Pfizer, Roche, Sandoz, Sanofi, Vertex, and Zealand Pharma. CM serves or has served on the speakers bureau for AstraZeneca, Boehringer Ingelheim, Eli Lilly and Company, Novartis, Novo Nordisk, and Sanofi. “T.G. was supported by Academy of Finland, Tampere University and University of Turku”.

Figures

Fig. 1
Fig. 1
Linear mixed effects modelling of the type 1 diabetes follow-up data. (a) A schematic diagram of the study. Whole-blood PAXgene samples were available from the baseline and 1-year follow-up visits. (b) Volcano plot of the model coefficients (x-axis) and the corresponding p-values (y-axis) (n = 94; 46 with both visits). (c, d) Expression levels of DEFA4 and TOX2 in the cohort over time (n = 94; 46 with both visits). The baseline and 1-year follow-up samples of the same individual are connected by blue (downregulation) or red (upregulation) arrows. (e) STRING network with the colours representing the mixed effects model coefficients.
Fig. 2
Fig. 2
Correlations of gene expression ratios between the baseline and 1-year follow-up samples (i.e., expression change) against zinc transporter 8 (ZnT8) autoantibody status at baseline. (a) Uniform manifold approximation and projection dimensional reduction of all gene ratios (n = 46), coloured on the basis of the correlation. (b) Examples of gene ratios between the baseline and 1-year follow-up samples for ZnT8-autoantibody positive (n = 31) and negative (n = 15) individuals.
Fig. 3
Fig. 3
Correlations of gene expression ratios between the baseline and 1-year follow-up samples (i.e., expression change) against changes in C-peptide/glucose ratio between baseline and follow-up. (a) Uniform manifold approximation and projection (UMAP) of all gene ratios (n = 46). (b) Scatterplots of selected gene ratios with C-peptide/glucose ratios (n = 32).
Fig. 4
Fig. 4
Predictive model for C-peptide decline. (a) Delta fasted C-peptide/glucose ratio at each sampling timepoint (as outlined in Fig. 1). Grouping of individuals was based on changes up to the 2-year follow visit. Blue and red lines show the rapid and slow progressors, respectively, and grey lines show the patients of intermediate category. (b) Heatmap of genes with differential gene expression ratios between rapid (n = 7) and slow (n = 6) groups by ROTS across the individuals (n = 46). (c) Signature score for individuals in rapid (n = 7), intermediate (n = 19), and slow (n = 6) groups. (d) Individual gene expression changes in the signature genes between baseline (v1) and 1-year follow-up visits (v4) for rapid (n = 7) and slow (n = 6) progressors. (e) Heatmap of signature gene ratios in validation data (n = 57) annotated with delta AUC C-peptide based rapid (n = 10) and slow (n = 21) progressors. (f) AUC C-peptide changes in the validation data for predicted rapid (n = 19) and slow (n = 19) groups.
Fig. 5
Fig. 5
Investigation of the differentially expressed and predictive genes. (a) Correlations among clinical variables, top differentially expressed genes between baseline and 1-year follow-up, and predictive signature genes. (b) Gene set enrichment analysis on the ranked lists of genes based on their correlation with clinical parameters, cell-type proportions, and prognostic score, using Hallmark gene sets from the molecular signature database (MSigDB). The colour scale is based on normalised enrichment score, and the significance is denoted by asterisks ∗ p = 0.05, ∗∗p = 0.01, ∗∗∗p = 0.001.

References

    1. Krischer J.P., Liu X., Lernmark Å., et al. The influence of type 1 diabetes genetic susceptibility regions, age, sex, and family history on the progression from multiple autoantibodies to type 1 diabetes: a teddy study report. Diabetes. 2017;66:3122–3129. - PMC - PubMed
    1. Ziegler A.-G., Bonifacio E., BABYDIAB-BABYDIET Study Group Age-related islet autoantibody incidence in offspring of patients with type 1 diabetes. Diabetologia. 2012;55:1937–1943. - PubMed
    1. Campbell-Thompson M., Fu A., Kaddis J.S., et al. Insulitis and β-cell mass in the natural history of type 1 diabetes. Diabetes. 2016;65:719–731. - PMC - PubMed
    1. Lam C.J., Jacobson D.R., Rankin M.M., Cox A.R., Kushner J.A. β cells persist in T1D pancreata without evidence of ongoing β-cell turnover or neogenesis. J Clin Endocrinol Metab. 2017;102:2647–2659. - PMC - PubMed
    1. Ferreira R.C., Guo H., Coulson R.M.R., et al. A type I interferon transcriptional signature precedes autoimmunity in children genetically at risk for type 1 diabetes. Diabetes. 2014;63:2538–2550. - PMC - PubMed

LinkOut - more resources