. 2023 Jun:92:104620.
doi: 10.1016/j.ebiom.2023.104620. Epub 2023 May 22.

Cross-tissue omics analysis discovers ten adipose genes encoding secreted proteins in obesity-related non-alcoholic fatty liver disease

Affiliations

Cross-tissue omics analysis discovers ten adipose genes encoding secreted proteins in obesity-related non-alcoholic fatty liver disease

Nicholas Darci-Maher et al. EBioMedicine. 2023 Jun.

Abstract

Background: Non-alcoholic fatty liver disease (NAFLD) is a fast-growing, underdiagnosed, epidemic. We hypothesise that obesity-related inflammation compromises adipose tissue functions, preventing efficient fat storage, and thus driving ectopic fat accumulation into the liver.

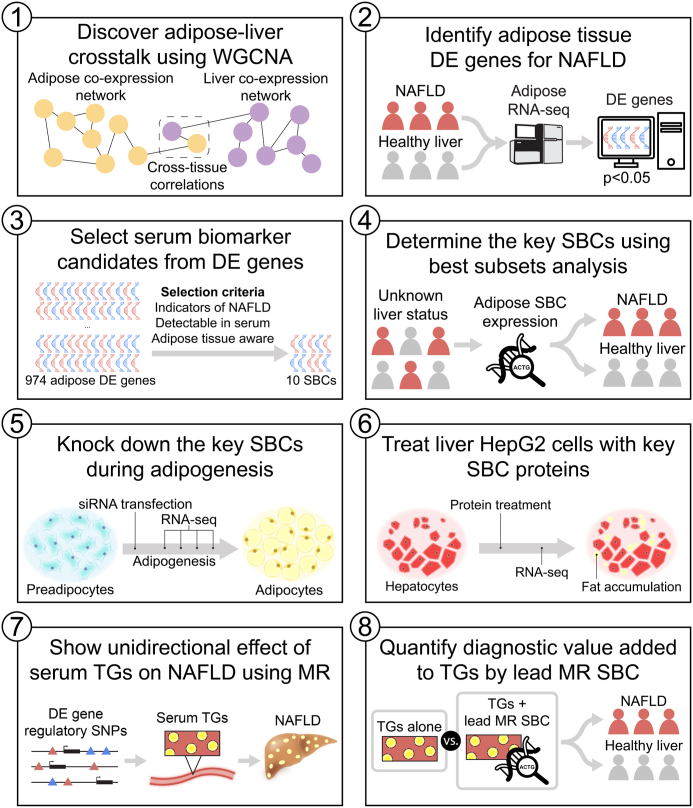
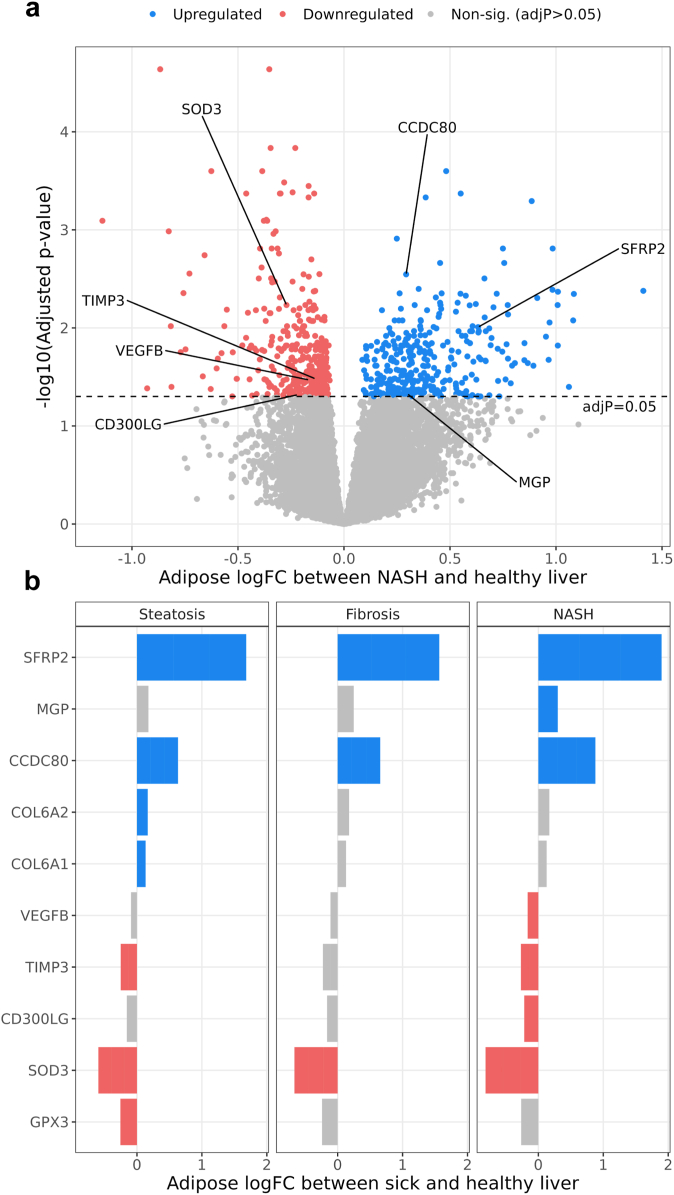
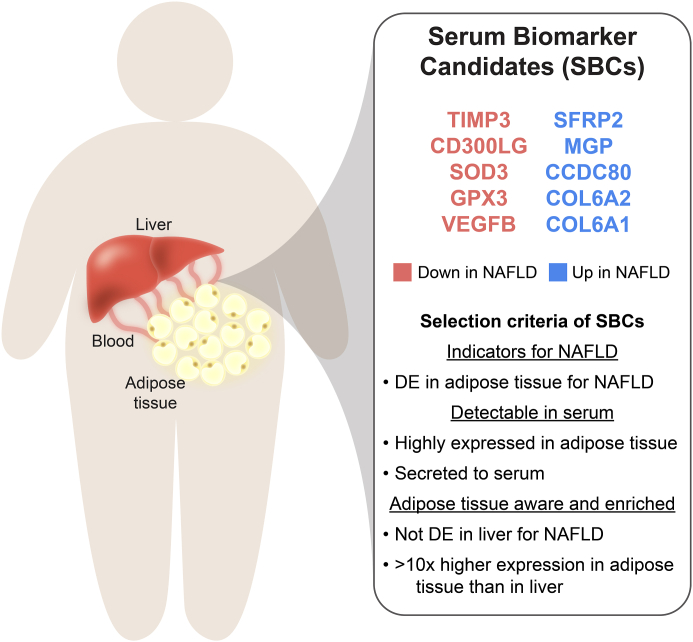
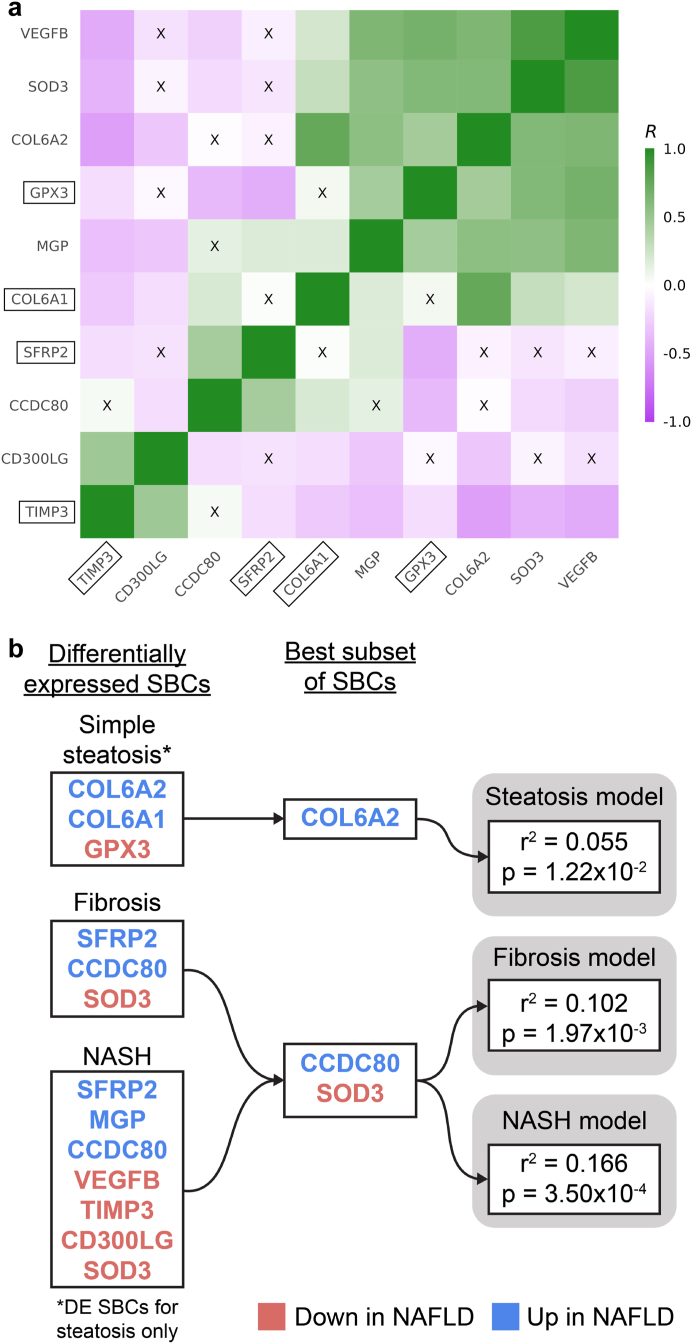
Methods: To identify adipose-based mechanisms and potential serum biomarker candidates (SBCs) for NAFLD, we utilise dual-tissue RNA-sequencing (RNA-seq) data in adipose tissue and liver, paired with histology-based NAFLD diagnosis, from the same individuals in a cohort of obese individuals. We first scan for genes that are differentially expressed (DE) for NAFLD in obese individuals' subcutaneous adipose tissue but not in their liver; encode proteins secreted to serum; and show preferential adipose expression. Then the identified genes are filtered to key adipose-origin NAFLD genes by best subset analysis, knockdown experiments during human preadipocyte differentiation, recombinant protein treatment experiments in human liver HepG2 cells, and genetic analysis.

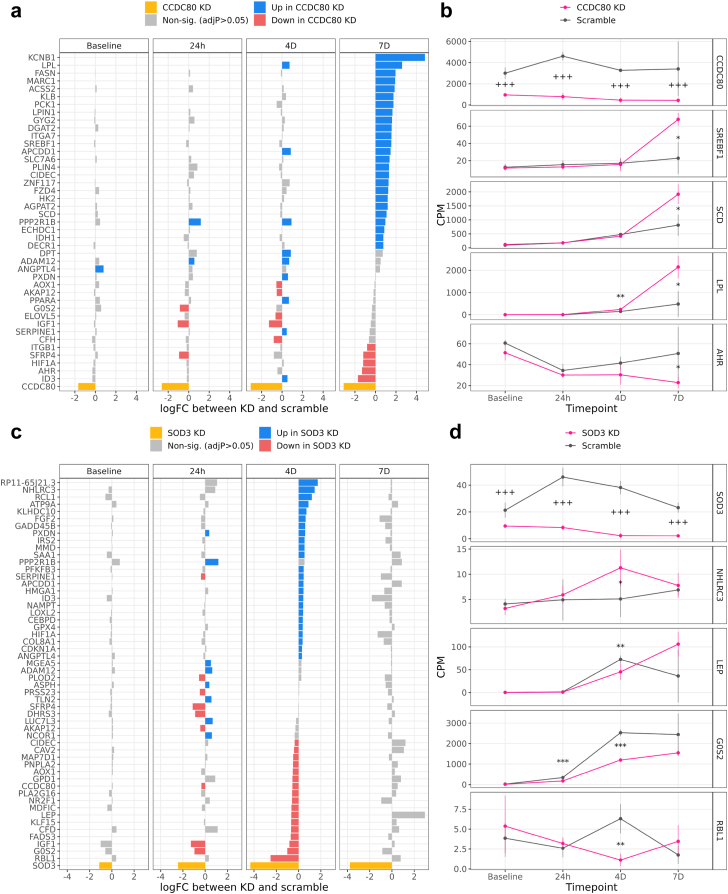
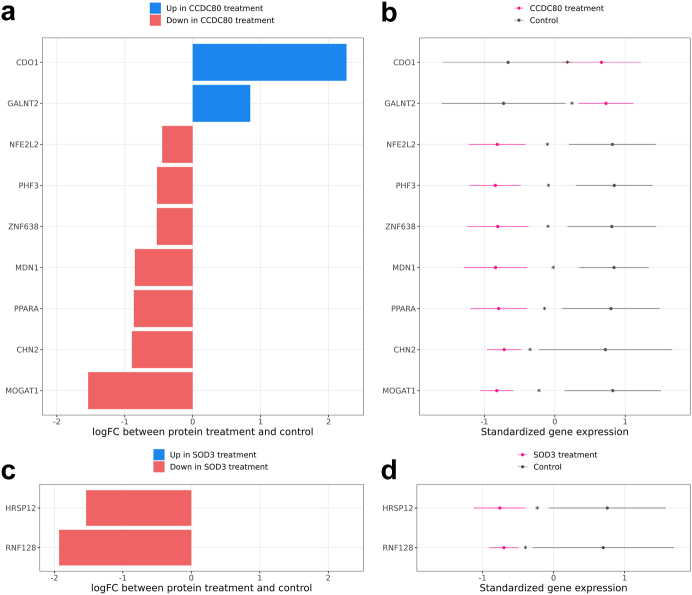
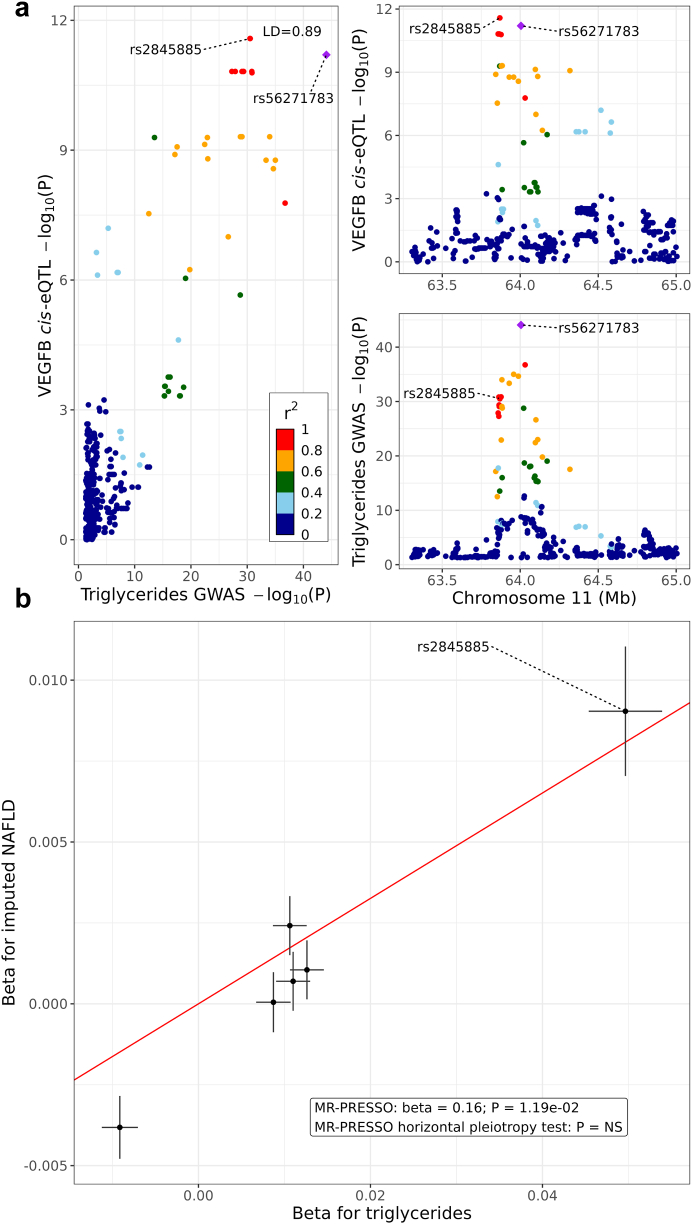
Findings: We discover a set of genes, including 10 SBCs, that may modulate NAFLD pathogenesis by impacting adipose tissue function. Based on best subset analysis, we further follow-up on two SBCs CCDC80 and SOD3 by knockdown in human preadipocytes and subsequent differentiation experiments, which show that they modulate crucial adipogenesis genes, LPL, SREBPF1, and LEP. We also show that treatment of the liver HepG2 cells with the CCDC80 and SOD3 recombinant proteins impacts genes related to steatosis and lipid processing, including PPARA, NFE2L2, and RNF128. Finally, utilizing the adipose NAFLD DE gene cis-regulatory variants associated with serum triglycerides (TGs) in extensive genome-wide association studies (GWASs), we demonstrate a unidirectional effect of serum TGs on NAFLD with Mendelian Randomization (MR) analysis. We also demonstrate that a single SNP regulating one of the SBC genes, rs2845885, produces a significant MR result by itself. This supports the conclusion that genetically regulated adipose expression of the NAFLD DE genes may contribute to NAFLD through changes in serum TG levels.

Interpretation: Our results from the dual-tissue transcriptomics screening improve the understanding of obesity-related NAFLD by providing a targeted set of 10 adipose tissue-active genes as new serum biomarker candidates for the currently grossly underdiagnosed fatty liver disease.

Funding: The work was supported by NIH grants R01HG010505 and R01DK132775. The Genotype-Tissue Expression (GTEx) Project was supported by the Common Fund of the Office of the Director of the National Institutes of Health, and by NCI, NHGRI, NHLBI, NIDA, NIMH, and NINDS. The KOBS study (J. P.) was supported by the Finnish Diabetes Research Foundation, Kuopio University Hospital Project grant (EVO/VTR grants 2005-2019), and the Academy of Finland grant (Contract no. 138006). This study was funded by the European Research Council under the European Union's Horizon 2020 research and innovation program (Grant No. 802825 to M. U. K.). K. H. P. was funded by the Academy of Finland (grant numbers 272376, 266286, 314383, and 335443), the Finnish Medical Foundation, Gyllenberg Foundation, Novo Nordisk Foundation (grant numbers NNF10OC1013354, NNF17OC0027232, and NNF20OC0060547), Finnish Diabetes Research Foundation, Finnish Foundation for Cardiovascular Research, University of Helsinki, and Helsinki University Hospital and Government Research Funds. I. S. was funded by the Instrumentarium Science Foundation. Personal grants to U. T. A. were received from the Matti and Vappu Maukonen Foundation, Ella och Georg Ehrnrooths Stiftelse and the Finnish Foundation for Cardiovascular Research.

Keywords: Adipogenesis; Dual-tissue transcriptomics screening; Liver histology; Non-alcoholic fatty liver disease; Obesity; Serum biomarkers; cis regulatory variants.


Conflict of interest statement

Declaration of interests J. N. B. received consulting fees from GLG, and support for attending meetings and/or travel from the American Gastroenterology Association (AGA), at least once during the last 36 months. The other authors declare that they have no competing interests.

Figures

Fig. 1
Fig. 1
Study design to discover 649 adipose aware differentially expressed (DE) genes, and 10 serum biomarker candidates (SBCs), for obesity-related non-alcoholic fatty liver disease (NAFLD). To discover SBCs for obesity-related NAFLD, we leveraged a unique dual-tissue transcriptomic cohort with histology-based diagnosis of steatosis, fibrosis, and non-alcoholic steatohepatitis (NASH). 1) First, we found evidence for our hypothesis of adipose-origin NAFLD by discovering molecular crosstalk between adipose tissue and liver using WGCNA. 2) Next, we scanned genome-wide for genes DE in adipose tissue for the three NAFLD traits diagnosed by liver histology. 3) We filtered these adipose NAFLD DE genes for secreted proteins, i.e. SBCs, using a set of selection criteria, and 4) determined the key SBCs using best subset analysis. 5) We then followed up the key SBCs functionally by knocking them down in human preadipocytes during adipogenesis, and 6) treating liver HepG2 cells with their recombinant proteins. 7) Next, we demonstrated a unidirectional effect of serum triglycerides (TGs) on NAFLD using Mendelian Randomization (MR) analysis, with a set of instrumental variables (IVs) derived from the adipose aware DE genes. 8) Finally, we followed up the MR analysis by quantifying the added variance explained by the lead MR SBC in the NAFLD models in addition to serum triglycerides alone using a series of regression analyses.
Fig. 2
Fig. 2
A total of 953 genes are differentially expressed (DE) in subcutaneous adipose tissue between the obese individuals with the three main non-alcoholic fatty liver disease (NAFLD) traits, steatosis, fibrosis and/or non-alcoholic steatohepatitis (NASH), and the obese individuals with healthy livers. We performed DE analysis on bulk RNA-seq data from subcutaneous adipose biopsies in the KOBS cohort, comparing individuals with the NAFLD traits diagnosed by liver histology to those with healthy livers. Gene counts represent numbers of genes DE for NAFLD in the subcutaneous adipose tissue before filtering for serum biomarker candidates (SBCs). Of the 953 adipose DE genes, 680, 273, and 663 genes are DE for steatosis, fibrosis, and NASH, respectively. (a) Volcano plot showing the results of the NASH DE analysis in the adipose tissue. The X-axis represents log fold-change (logFC) in adipose bulk RNA-seq data from individuals with NASH and those with healthy livers. The Y-axis represents the negative log of the DE p-value, adjusted for multiple testing with the Benjamini-Hochberg procedure. Significant SBCs identified in our subsequent filtering steps (Fig. 3) are highlighted. Volcano plots of steatosis and fibrosis DE results in the subcutaneous adipose tissue are shown in Supplementary Fig. S3. (b) Bar plot showing the DE direction of the SBCs in the adipose DE analysis for steatosis, fibrosis, and NASH. X-axis represents logFC in adipose bulk RNA-seq data from individuals with each NAFLD trait and those with healthy livers. Y-axis represents the SBC name, sorted by logFC. Blue SBCs have increased adipose expression in individuals with NAFLD when compared to the individuals with healthy livers, while red SBCs have decreased adipose expression.
Fig. 3
Fig. 3
Filtering of subcutaneous adipose non-alcoholic fatty liver disease (NAFLD) differentially expressed (DE) genes to select serum biomarker candidates (SBCs). To identify SBCs among the list of 953 adipose NAFLD DE genes, we selected the genes that were DE for NAFLD in adipose tissue but not in the liver, coded for secreted proteins, had moderate to high expression in adipose tissue, and had >10x higher expression in the subcutaneous adipose tissue than in the liver. These filters reduced the list of 953 total adipose DE genes across steatosis, fibrosis, and non-alcoholic steatohepatitis (NASH) to 10 SBCs. Blue genes are upregulated in steatosis, fibrosis, and/or NASH in adipose tissue, while red genes are downregulated.
Fig. 4
Fig. 4
Selection of the key serum biomarker candidates (SBCs) using the best subset analysis, motivated by our prior gene-gene correlations observed in the adipose expression of the SBCs. We filtered the list of 10 SBCs further by testing the proportion of variance explained in steatosis, fibrosis, and non-alcoholic steatohepatitis (NASH) by the adipose expression of the SBCs. (a) Pairwise gene-gene correlation structure between the subcutaneous adipose expression of the SBC genes. Each coloured box represents the strength of the pairwise Pearson correlation (R) between the adipose expression of the SBC genes. Green boxes correspond to a positive correlation, and purple boxes correspond to a negative correlation. “X” indicates that the correlation is non-significant after Bonferroni correction. Genes are ordered by the first principal component (PC). Boxed gene names represent the SBCs that correlate with the key NAFLD-related liver network module eigengenes. The observed correlations between the adipose expression of the SBCs motivate the idea that a small subset of the SBCs can capture most of the expression of all 10 SBCs, which we then tested in the best subset analysis. (b) Results of the best subset analysis. For steatosis, fibrosis, and NASH, the best subset of significant SBCs was chosen by the leaps algorithm, based on the variance in the non-alcoholic fatty liver disease (NAFLD) trait explained by each combination of genes. P-values were calculated based on a permutation test (B = 100,000) (see Methods). To capture genes involved in the early onset of NAFLD, only the 3 genes that were uniquely differentially expressed (DE) for steatosis in the subcutaneous adipose tissue were considered for the steatosis model.
Fig. 5
Fig. 5
CCDC80 knockdown in human preadipocytes differentiated to adipocytes activates known drivers of adipogenesis, and SOD3 knockdown deactivates known drivers of healthy energy homeostasis. We knocked down CCDC80 and SOD3 using siRNA transfection in independent cultures of human SGBS preadipocyte cells (see Methods), and measured expression via RNA-seq at 4 time points during adipogenesis. We then performed a differential expression (DE) analysis on the RNA-seq data between the CCDC80 or SOD3 gene knockdown and scramble conditions at each time point. (a) Results of the CCDC80 knockdown DE analysis. The X-axis represents the log fold-change (logFC) of all 43 genes which were DE in at least one time point during the differentiation; the Y-axis the gene names; and facets the time points of adipogenesis. Blue genes were expressed significantly more in the CCDC80 knockdown than in the scramble conditions, and red genes were expressed less. Yellow represents CCDC80, the knocked down gene. (b) Mean expression of CCDC80 and selected well known examples of adipogenesis genes in the scramble and knockdown samples during differentiation. The X-axis represents the time point of the adipocyte differentiation; the Y-axis counts per million (CPM); facets the gene name; error bars the mean ± one standard deviation; and colours the experimental condition (knockdown or scrambled control). Each condition-timepoint combination within each facet represents n ≥ 3 samples, and the total experiment included n = 28 samples. Annotations indicate the significance of DE between the knockdown and scramble samples for a given timepoint and gene: “∗∗∗” = adjP < 0.001; “∗∗” = adjP < 0.01; “∗” = adjP < 0.05. In the CCDC80 panel only: “+++” = p < 0.001, “++” = p < 0.01, “+” = p < 0.05. The CCDC80 p-values are not adjusted for multiple testing because we directly manipulated CCDC80 expression in the knockdown experiment. (c) Results of the SOD3 DE analysis, with 54 DE genes. Plot elements are analogous to those in (a). (d) Mean expression of SOD3 and selected well known examples of adipogenesis and satiety signalling genes in the knockdown and scramble samples during differentiation. Plot elements are analogous to those in (b).
Fig. 6
Fig. 6
Treatment of human liver HepG2 cells with the CCDC80 and SOD3 recombinant proteins changes the expression of several known NAFLD-related genes. We treated separate cultures of human liver HepG2 cells with the CCDC80 and SOD3 recombinant proteins for 24 h (see Methods), and measured expression via RNA-seq. We then performed a differential expression (DE) analysis between the recombinant protein treated cells and non-treated control cells. (a) Results of the CCDC80 treatment DE analysis. The X-axis represents the log fold-change (logFC) of the 9 significant DE genes, and the Y-axis represents the gene names. Blue genes were expressed significantly more in the CCDC80 treated cells than in the control cells, and red genes were expressed less. (b) Mean expression of all 9 significant DE genes in the CCDC80 treated cells compared to the control cells. The X-axis represents counts per million (CPM), standardized by the mean and standard deviation of each gene; the Y-axis gene name; error bars the mean ± one standard deviation; and colours the experimental condition (CCDC80 treated HepG2 cells or non-treated control cells). Each row represents 4 samples treated with CCDC80 and 4 control samples, for a total of 8 samples per row. The “∗” annotation indicates that the gene was significantly DE between the CCDC80 treatment and control samples (adjP < 0.05 after Benjamini–Hochberg correction (FDR < 0.05)). (c) Results of the SOD3 treatment DE analysis, with 2 significant DE genes. Plot elements are analogous to those in (a). (d) Mean expression of the 2 DE genes in the SOD3 treated cells compared to the control cells. Plot elements are analogous to those in (b).
Fig. 7
Fig. 7
Mendelian Randomization (MR) analysis suggests a unidirectional effect of serum triglycerides (TG) on imputed non-alcoholic fatty liver disease (NAFLD) status, mediated by cis regulators of adipose aware DE genes. We derived 6 instrumental variable (IV) variants for MR analysis from the cis regions of adipose aware differentially expressed (DE) genes by selecting adipose cis-expression quantitative trait loci (cis-eQTL) SNPs colocalised with TG GWAS SNPs that were not also NAFLD genome-wide association study (GWAS) SNPs. We then conducted MR analysis with MR-PRESSO using variant GWAS effect sizes from the UK Biobank, and discovered a significant result. (a) Colocalization of VEGFB adipose cis-eQTL rs2845885 with TG GWAS variant rs56271783. Strong colocalization of variants regulating both TGs and adipose expression of an SBC gene suggests that key DE genes and serum TG levels may share a directional pathway. Each point represents one genetic variant, and colour indicates pairwise linkage disequilibrium (LD) with rs56271783, as described in the legend in the left panel. Upper right panel: X-axis represents position on chromosome 11 in megabases (Mb). Y-axis represents the significance of variant association with VEGFB adipose expression, i.e. the negative log p-value from adipose cis-eQTL analysis. Bottom right panel: X-axis represents the position on chromosome 11 in megabases (Mb). Y-axis represents the significance of variant association with serum TG levels, i.e. the negative log P-value from GWAS analysis. Left panel: X-axis represents the negative log p-value from TG GWAS analysis. Y-axis represents the negative log P-value from VEGFB adipose cis-eQTL analysis. Annotation reports the LD value between rs2845885 and rs56271783. (b) Results of MR analysis with MR-PRESSO. The absence of outliers in the plot indicates that there is no significant horizontal pleiotropy in the set of IVs, as evidenced by non-significance in the MR-PRESSO global test. Each point represents an IV, and error bars represent the effect size ± SE. X-axis represents the variant effect size for serum TGs, while Y-axis represents the variant effect size for the imputed NAFLD status. Regression line is generated from the MR-PRESSO output slope with an intercept of 0.

Similar articles

Cited by

References

    1. Younossi Z.M., Koenig A.B., Abdelatif D., Fazel Y., Henry L., Wymer M. Global epidemiology of nonalcoholic fatty liver disease—meta-analytic assessment of prevalence, incidence, and outcomes. Hepatology. 2016;64(1):73–84. - PubMed
    1. Powell E.E., Wong V.W.S., Rinella M. Non-alcoholic fatty liver disease. Lancet. 2021;397(10290):2212–2224. - PubMed
    1. Wong R.J., Aguilar M., Cheung R., et al. Nonalcoholic steatohepatitis is the second leading etiology of liver disease among adults awaiting liver transplantation in the United States. Gastroenterology. 2015;148(3):547–555. - PubMed
    1. Albhaisi S., Chowdhury A., Sanyal A.J. Non-alcoholic fatty liver disease in lean individuals. JHEP Rep. 2019;1(4):329–341. - PMC - PubMed
    1. Friedman S.L., Neuschwander-Tetri B.A., Rinella M., Sanyal A.J. Mechanisms of NAFLD development and therapeutic strategies. Nat Med. 2018;24(7):908–922. - PMC - PubMed

MeSH terms