. 2023 Jun 8;186(12):2644-2655.e16.
doi: 10.1016/j.cell.2023.04.028. Epub 2023 May 23.

Structural and functional insights into Spns2-mediated transport of sphingosine-1-phosphate

Affiliations

Structural and functional insights into Spns2-mediated transport of sphingosine-1-phosphate

Hongwen Chen et al. Cell. .

Abstract

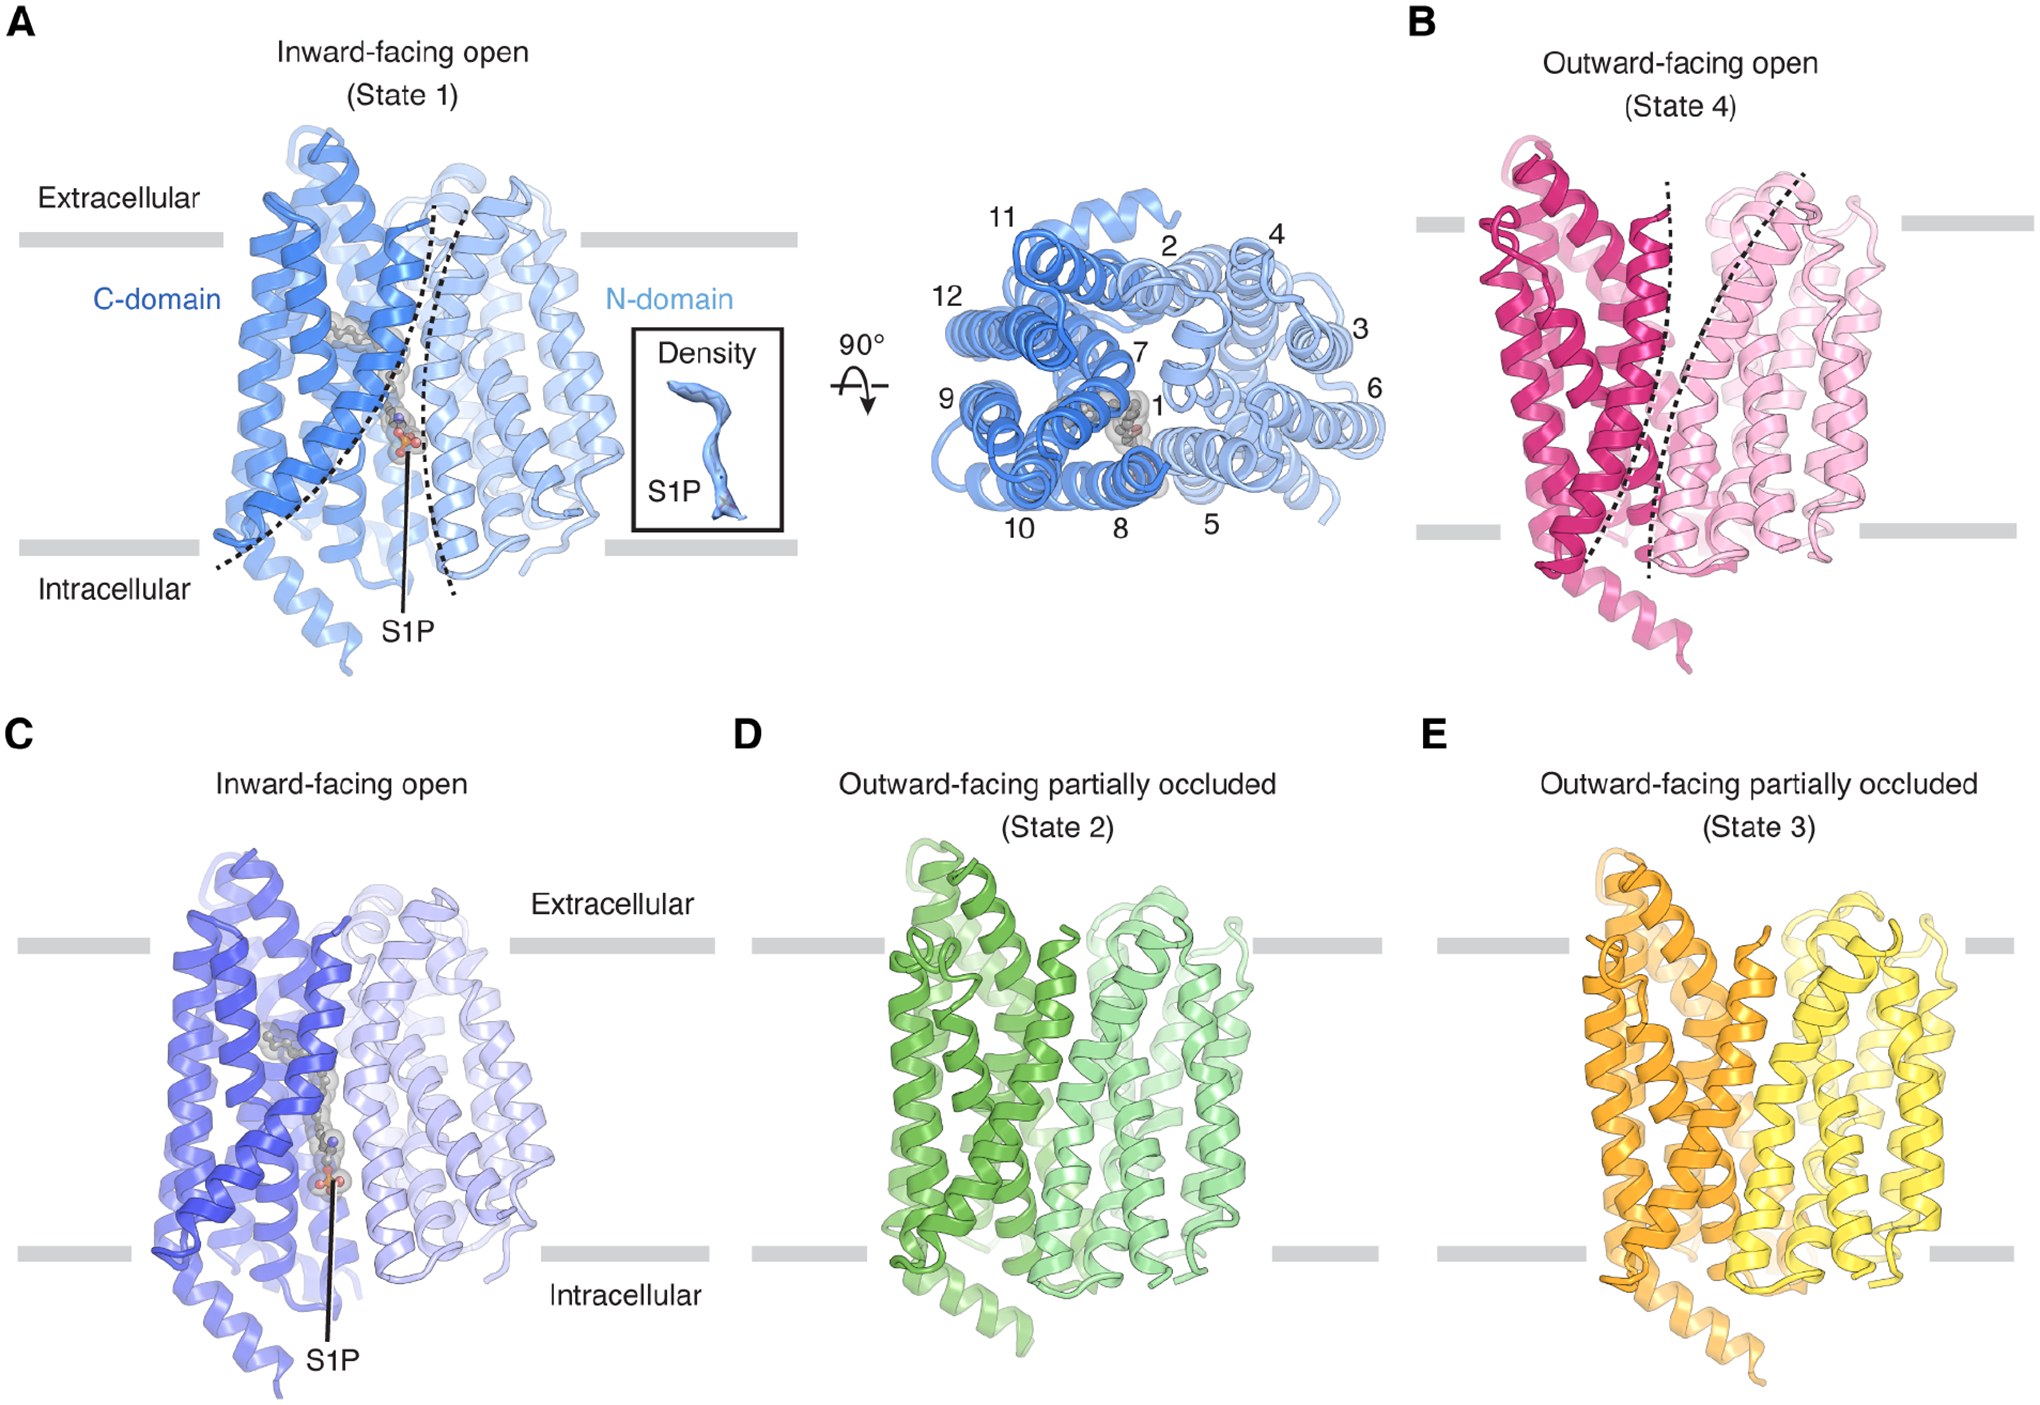
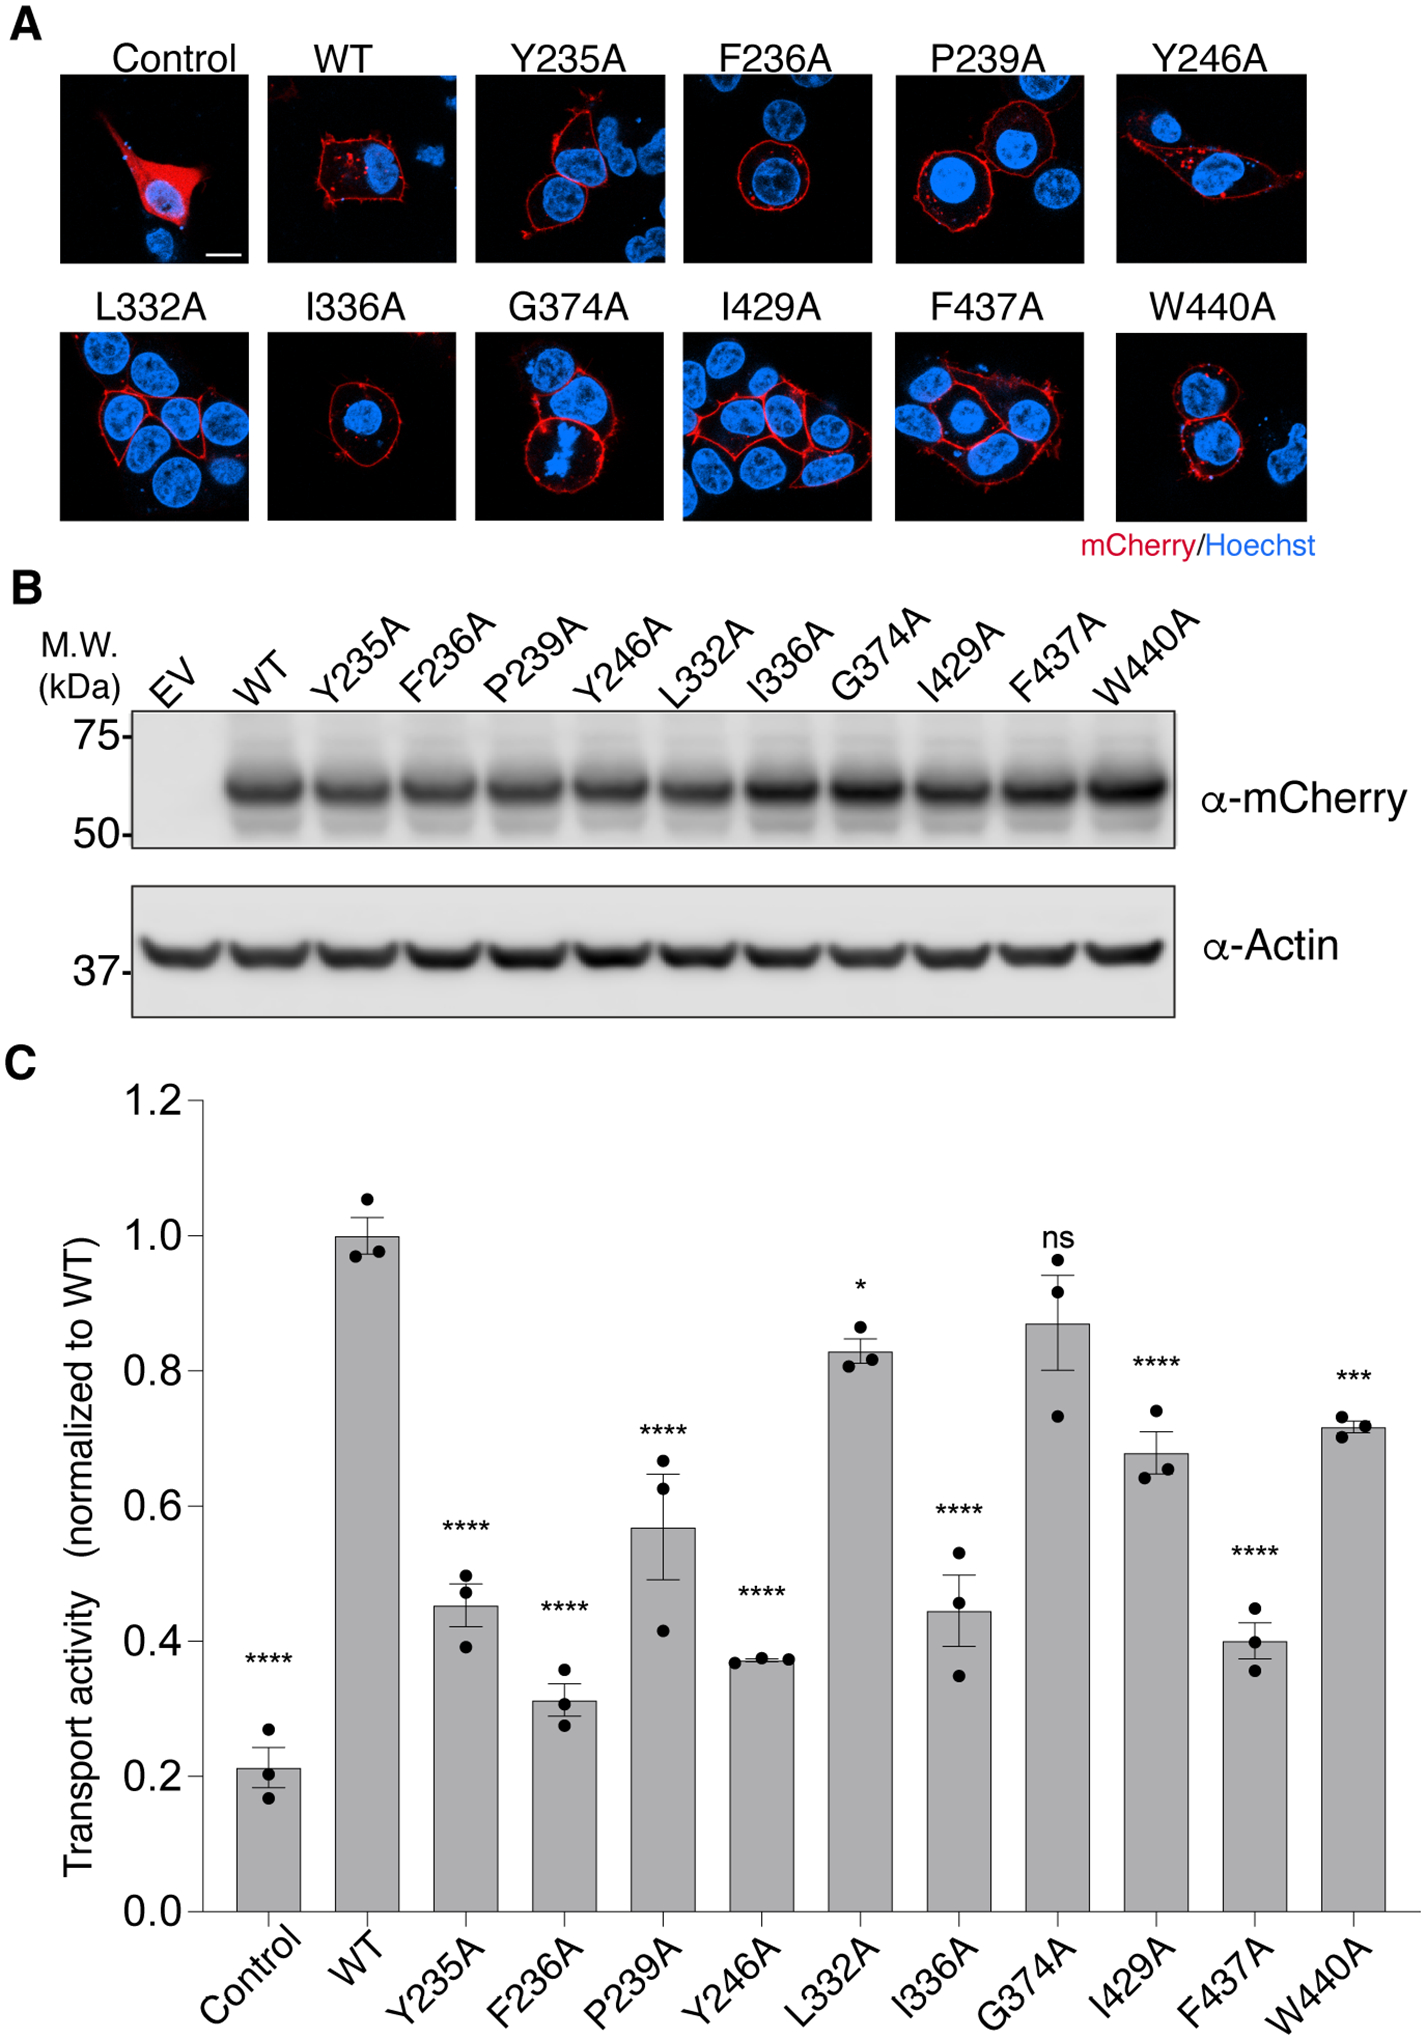
Sphingosine-1-phosphate (S1P) is an important signaling sphingolipid that regulates the immune system, angiogenesis, auditory function, and epithelial and endothelial barrier integrity. Spinster homolog 2 (Spns2) is an S1P transporter that exports S1P to initiate lipid signaling cascades. Modulating Spns2 activity can be beneficial in treatments of cancer, inflammation, and immune diseases. However, the transport mechanism of Spns2 and its inhibition remain unclear. Here, we present six cryo-EM structures of human Spns2 in lipid nanodiscs, including two functionally relevant intermediate conformations that link the inward- and outward-facing states, to reveal the structural basis of the S1P transport cycle. Functional analyses suggest that Spns2 exports S1P via facilitated diffusion, a mechanism distinct from other MFS lipid transporters. Finally, we show that the Spns2 inhibitor 16d attenuates the transport activity by locking Spns2 in the inward-facing state. Our work sheds light on Spns2-mediated S1P transport and aids the development of advanced Spns2 inhibitors.

Keywords: S1P; Spns2; cryo-EM; major facilitator superfamily; sphingolipid; uniporter.


Conflict of interest statement

Declaration of interests The authors declare no competing interests.

Figures

Figure 1
Figure 1. Functional characterization of human Spns2cryo.
(A) Schematic of Spns2-mediated S1P export assay. Created with BioRender.com. (B) Representative images of the cellular localization of human Spns2wt and Spns2cryo. Control, mCherry alone. The HEK293 cells expressing Spns2-mCherry were stained with Hoechst (blue). Scale bar, 10 μm. (C) Western blot analysis of the expression level of Spns2-mCherry variants. Actin serves as a loading control. Control, mCherry alone; WT, wild type; cryo, construct for cryo-EM study. (D) Functional validation of human Spns2WT and Spns2cryo. Spns2WT and Spns2cryo are overexpressed in HEK293 cells that stably express SphK1. Data are represented as mean ± SEM (n=3 biological replicates). ****P ≤ 0.0001, ns: not significant, calculated by ordinary one-way ANOVA with Dunnett’s multiple comparisons test using GraphPad Prism 9. (E)The IC50 measurement of 16d. Data are represented as mean ± SEM (n=3 biological replicates). The experiments in panel (B-E) were conducted three times on different days with three independent group for each repeat. Similar results were obtained. (F) LC-MS measurements of Spns2WT-mediated S1P export. Data are represented as mean ± SEM (n=3 biological replicates). **P ≤ 0.01, ****P ≤ 0.0001, ns: not significant, calculated by ordinary one-way ANOVA with Dunnett’s multiple comparisons test using GraphPad Prism 9. The experiments were conducted two times on different days with three independent group for each repeat. Similar results were obtained.
Figure 2
Figure 2. Overall structures of human Spns2.
(A) Overall structure of S1P-bound Spns2 in an inward-facing open conformation (state 1) viewed from the side of the membrane (left) or from the extracellular space (right). S1P is shown as sticks in gray and its cryo-EM density is shown in the inset. (B) Overall structure of Spns2 in an outward-facing open conformation (state 4). (C) Overall structure of S1P-bound Spns2 in an inward-facing open conformation. (D) Overall structure of Spns2 in an outward-facing partially occluded conformation (state 2). (E) Overall structure of Spns2 in another outward-facing partially occluded conformation (state 3). S1P is shown as sticks in gray. The structures (A and B) were determined without additional S1P supplement in the protein solution. The structures (C-E) were determined in the presence of additional S1P in the protein solution.
Figure 3
Figure 3. Structures of human Spns2 in distinct states.
(A) Surface representation of inward-facing cavity (state 1). The cytosolic side reveals two openings toward the intracellular solution. S1P is shown as sticks in gray. (B) Interaction of S1P with residues in the cavity. (C) Surface representation of outward-facing cavity of state 2. The asterisk indicates the closure of the inward-facing cavity. (D) Surface representation of outward-facing cavity of state 3. (E)Surface representation of outward-facing cavity of the state 4. In (C) to (E), residues Tyr120 and Met334 are shown as sticks. The movements of these marker residues highlight the opening of the outward-facing cavity. (F) Structural comparison between the state 4 structure (magenta) and an outward-facing Mfsd2a structure (gray, PDB: 7N98). The comparison of putative lipid entrances is shown on right in a zoomed view. The arrow indicates the different arrangement of TM8s in Spns2 and Mfsd2a. TMs and related residues are labeled.
Figure 4
Figure 4. Structural transitions during the transport cycle of Spns2.
(A) Structural comparison of four different states of Spns2. The N-domains (indicated as gray surface) are aligned. (B) The transitions of four states. The hydrophilic interactions are indicated as dashed lines. (C) and (D) Structural comparison of TM7 and TM8 between states 1 and 2. Cα positions of Ala368 and Gly471 are indicated by spheres. The clashes between S1P (in the state 1) and structural elements of Spns2 in state 2 are indicated by dashed circles. (E) Structural comparisons of Spns2 in states 2, 3 and 4. The extracellular view shows considerable movements of the extracellular halves of TM7, 8, and 11 during the transitions of different states. (F) Structural comparison of the C-domain between states 2 and 3. (G) Structural comparison of C-domain between states 2 and 4. The movements of TMs are indicated by arrows.
Figure 5
Figure 5. Validation of the key residues of human Spns2 in S1P transport.
(A) Representative images of the localization of Spns2-mCherry variants. HEK293 cells expressing Spns2-mCherry were stained with Hoechst (blue). Control, mCherry alone; WT, wild type. Scale bar, 10 μm. The experiments were independently conducted two times, on different days, with similar results obtained. (B) Western blot analysis of the expression level of human Spns2-mCherry variants. Actin serves as a loading control. EV, empty vector; WT, wild type. The experiments were independently conducted three times, on different days, with similar results obtained. (C) Transport activity of mutants in key residues involved in substrate engagement and structural transitions. Control, mCherry alone; WT, wild type. Data are represented as mean ± SEM (n=3 biological replicates). * P ≤ 0.1, ** P ≤ 0.01, ***P ≤ 0.001, ****P ≤ 0.0001, ns: not significant, calculated by ordinary one-way ANOVA with Dunnett’s multiple comparisons test using GraphPad Prism 9. The experiments were conducted three times, on different days with three independent groups for each repeat, with similar results obtained.
Figure 6
Figure 6. Functional investigations on Spns2 transport mechanism.
(A) and (B) The transport activity of Spns2 under different pHs (A) or different ionic environments (B). 140 mM NaCl, KCl, Hank’s balanced salt solution (HBSS) or N-methyl-D-glucamine (NMDG)-Cl was used in these experiments. 16d was added at a final concentration of 100 μM. Data are represented as mean ± SEM (n=3 biological replicates). ***P ≤ 0.001, ****P ≤ 0.0001, statistical significance between 16d treated and untreated samples was evaluated by two-tailed unpaired Student’s t test using GraphPad Prism 9. (C) Schematic of Spns2-mediated NBD-S1P uptake assay. Created with BioRender.com. (D) Uptake activity of Spns2 in HBSS or NMDG-Cl supplemented with 1 μM NDB-S1P. Control, mCherry alone. Data are represented as mean ± SEM (n=3 biological replicates). ** P ≤ 0.01, ***P ≤ 0.001, ns: not significant, calculated by ordinary one-way ANOVA with Dunnett’s multiple comparisons test using GraphPad Prism 9. The experiments in panel (A), (B) and (D) were conducted three times on different days with three independent groups for each repeat, with similar results obtained.
Figure 7
Figure 7. Spns2 structure in complex with the inhibitor 16d.
(A) Overall structure of 16d-bound Spns2 viewed from the side of the membrane. The inhibitor 16d ligand is shown as sticks in orange. (B) Interactions between 16d and residues in the inward-facing cavity. (C)and (D) Structural comparison of S1P-bound Spns2 (state 1, color in blue) and 16d-bound Spns2. Phe236 and Trp440 change their conformations in response to the binding of 16d. S1P and 16d are shown as sticks. S1P is in gray and 16d is in orange.

Comment in

References

    1. Cartier A, and Hla T (2019). Sphingosine 1-phosphate: Lipid signaling in pathology and therapy. Science 366. 10.1126/science.aar5551. - DOI - PMC - PubMed
    1. Rosen H, Stevens RC, Hanson M, Roberts E, and Oldstone MB (2013). Sphingosine-1-phosphate and its receptors: structure, signaling, and influence. Annual review of biochemistry 82, 637–662. 10.1146/annurev-biochem-062411-130916. - DOI - PubMed
    1. Proia RL, and Hla T (2015). Emerging biology of sphingosine-1-phosphate: its role in pathogenesis and therapy. The Journal of clinical investigation 125, 1379–1387. 10.1172/JCI76369. - DOI - PMC - PubMed
    1. Green CD, Maceyka M, Cowart LA, and Spiegel S (2021). Sphingolipids in metabolic disease: The good, the bad, and the unknown. Cell metabolism 33, 1293–1306. 10.1016/j.cmet.2021.06.006. - DOI - PMC - PubMed
    1. Lu E, and Cyster JG (2019). G-protein coupled receptors and ligands that organize humoral immune responses. Immunol Rev 289, 158–172. 10.1111/imr.12743. - DOI - PMC - PubMed

Publication types