. 2023 Aug;79(2):296-313.
doi: 10.1016/j.jhep.2023.04.037. Epub 2023 May 22.

Intestinal B cells license metabolic T-cell activation in NASH microbiota/antigen-independently and contribute to fibrosis by IgA-FcR signalling

Elena Kotsiliti  1 Valentina Leone  2 Svenja Schuehle  3 Olivier Govaere  4 Hai Li  5 Monika J Wolf  6 Helena Horvatic  7 Sandra Bierwirth  8 Jana Hundertmark  9 Donato Inverso  10 Laimdota Zizmare  11 Avital Sarusi-Portuguez  12 Revant Gupta  13 Tracy O'Connor  14 Anastasios D Giannou  15 Ahmad Mustafa Shiri  16 Yehuda Schlesinger  12 Maria Garcia Beccaria  1 Charlotte Rennert  17 Dominik Pfister  1 Rupert Öllinger  18 Iana Gadjalova  19 Pierluigi Ramadori  1 Mohammad Rahbari  1 Nuh Rahbari  20 Marc E Healy  21 Mirian Fernández-Vaquero  1 Neda Yahoo  1 Jakob Janzen  1 Indrabahadur Singh  22 Chaofan Fan  1 Xinyuan Liu  23 Monika Rau  24 Martin Feuchtenberger  25 Eva Schwaneck  26 Sebastian J Wallace  27 Simon Cockell  28 John Wilson-Kanamori  27 Prakash Ramachandran  27 Celia Kho  7 Timothy J Kendall  29 Anne-Laure Leblond  6 Selina J Keppler  19 Piotr Bielecki  30 Katja Steiger  31 Maike Hofmann  32 Karsten Rippe  33 Horst Zitzelsberger  34 Achim Weber  6 Nisar Malek  35 Tom Luedde  36 Mihael Vucur  36 Hellmut G Augustin  10 Richard Flavell  30 Oren Parnas  37 Roland Rad  38 Olivier Pabst  39 Neil C Henderson  29 Samuel Huber  16 Andrew Macpherson  5 Percy Knolle  40 Manfred Claassen  41 Andreas Geier  24 Christoph Trautwein  11 Kristian Unger  34 Eran Elinav  42 Ari Waisman  23 Zeinab Abdullah  7 Dirk Haller  8 Frank Tacke  9 Quentin M Anstee  43 Mathias Heikenwalder  44
Affiliations

Intestinal B cells license metabolic T-cell activation in NASH microbiota/antigen-independently and contribute to fibrosis by IgA-FcR signalling

Elena Kotsiliti et al. J Hepatol. 2023 Aug.

Abstract

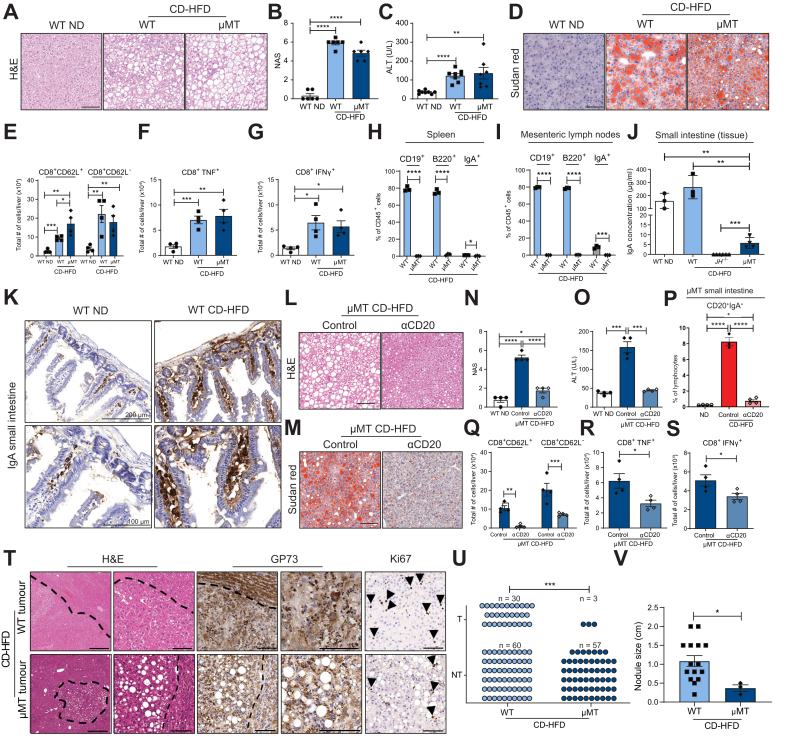
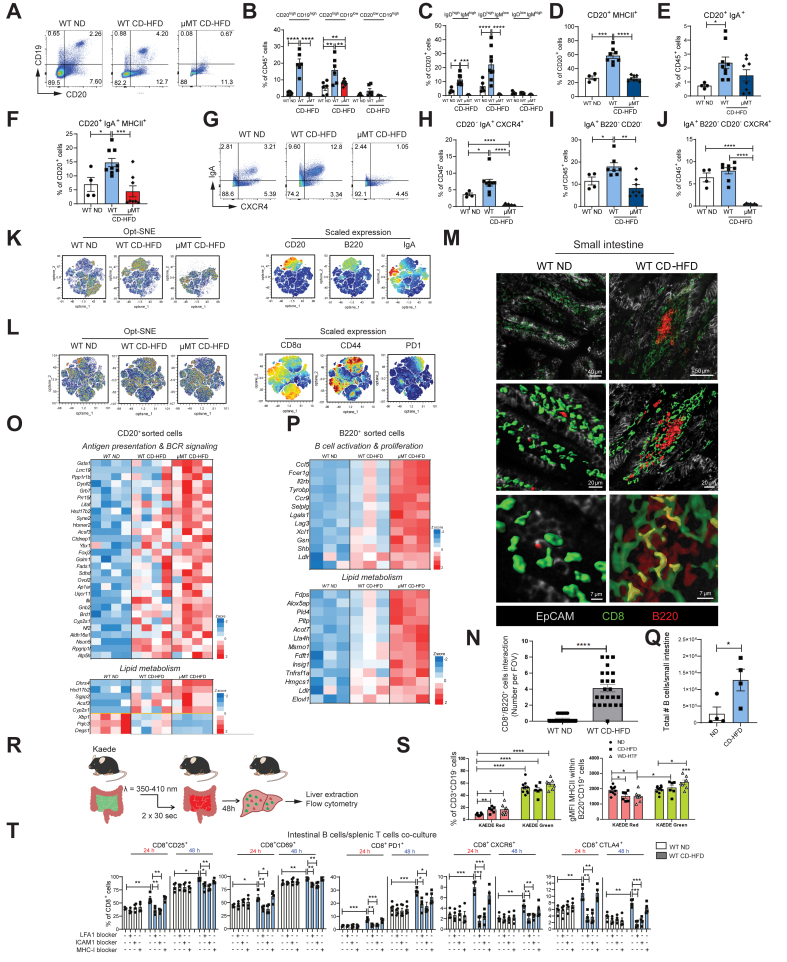
Background & aims: The progression of non-alcoholic steatohepatitis (NASH) to fibrosis and hepatocellular carcinoma (HCC) is aggravated by auto-aggressive T cells. The gut-liver axis contributes to NASH, but the mechanisms involved and the consequences for NASH-induced fibrosis and liver cancer remain unknown. We investigated the role of gastrointestinal B cells in the development of NASH, fibrosis and NASH-induced HCC.

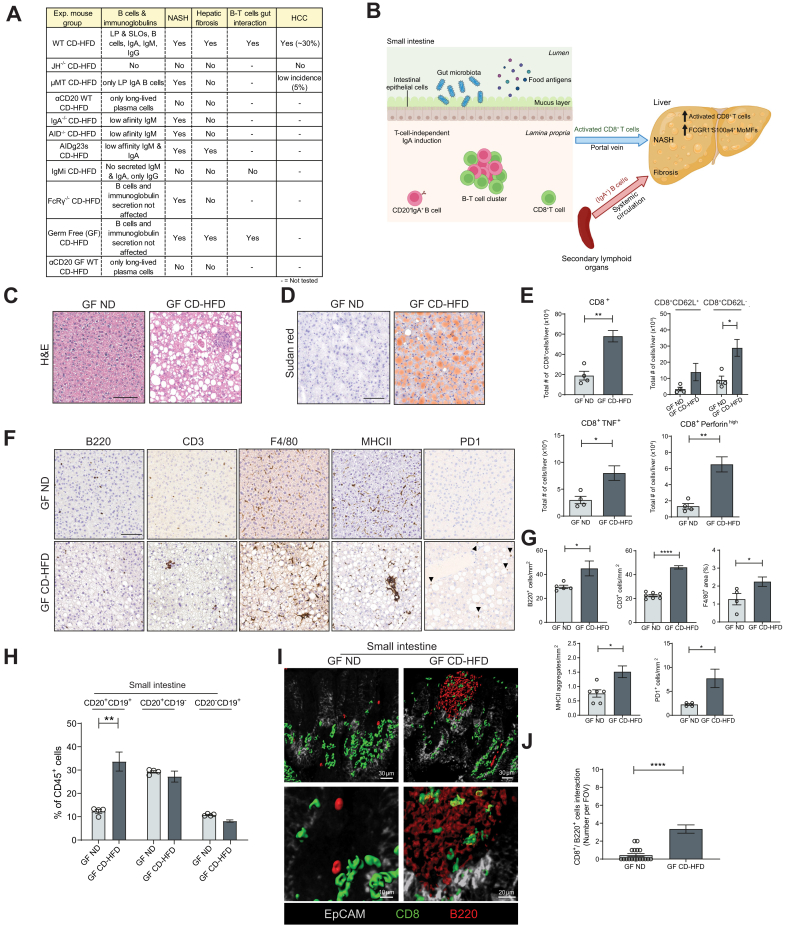
Methods: C57BL/6J wild-type (WT), B cell-deficient and different immunoglobulin-deficient or transgenic mice were fed distinct NASH-inducing diets or standard chow for 6 or 12 months, whereafter NASH, fibrosis, and NASH-induced HCC were assessed and analysed. Specific pathogen-free/germ-free WT and μMT mice (containing B cells only in the gastrointestinal tract) were fed a choline-deficient high-fat diet, and treated with an anti-CD20 antibody, whereafter NASH and fibrosis were assessed. Tissue biopsy samples from patients with simple steatosis, NASH and cirrhosis were analysed to correlate the secretion of immunoglobulins to clinicopathological features. Flow cytometry, immunohistochemistry and single-cell RNA-sequencing analysis were performed in liver and gastrointestinal tissue to characterise immune cells in mice and humans.

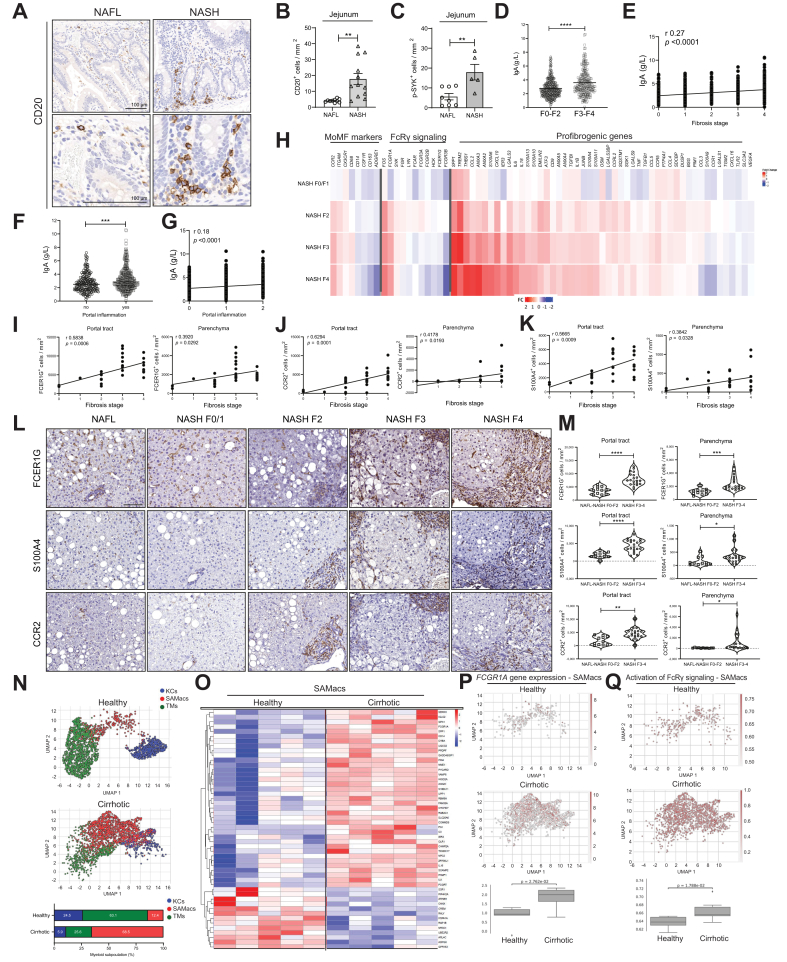
Results: Activated intestinal B cells were increased in mouse and human NASH samples and licensed metabolic T-cell activation to induce NASH independently of antigen specificity and gut microbiota. Genetic or therapeutic depletion of systemic or gastrointestinal B cells prevented or reverted NASH and liver fibrosis. IgA secretion was necessary for fibrosis induction by activating CD11b+CCR2+F4/80+CD11c-FCGR1+ hepatic myeloid cells through an IgA-FcR signalling axis. Similarly, patients with NASH had increased numbers of activated intestinal B cells; additionally, we observed a positive correlation between IgA levels and activated FcRg+ hepatic myeloid cells, as well the extent of liver fibrosis.

Conclusions: Intestinal B cells and the IgA-FcR signalling axis represent potential therapeutic targets for the treatment of NASH.

Impact and implications: There is currently no effective treatment for non-alcoholic steatohepatitis (NASH), which is associated with a substantial healthcare burden and is a growing risk factor for hepatocellular carcinoma (HCC). We have previously shown that NASH is an auto-aggressive condition aggravated, amongst others, by T cells. Therefore, we hypothesized that B cells might have a role in disease induction and progression. Our present work highlights that B cells have a dual role in NASH pathogenesis, being implicated in the activation of auto-aggressive T cells and the development of fibrosis via activation of monocyte-derived macrophages by secreted immunoglobulins (e.g., IgA). Furthermore, we show that the absence of B cells prevented HCC development. B cell-intrinsic signalling pathways, secreted immunoglobulins, and interactions of B cells with other immune cells are potential targets for combinatorial NASH therapies against inflammation and fibrosis.

Keywords: B cells; HCC; NAFL; NAFLD; NASH; fibrosis; gut-liver axis.


Figures

None
Graphical abstract
Fig. 1
Fig. 1
B cells support NASH and subsequent HCC development. (A) Representative H&E staining of liver sections derived from WT ND, CD-HFD and JH-/- CD-HFD male mice fed for 6 months. (B) NAFLD score evaluation (n = 8). (C) Serum ALT levels (n = 9). (D) Representative Sudan red analysis of liver sections of male mice fed for 6 months. (E-G) Quantifications of the total number of cells (absolute number) of liver flow cytometry analyses of male mice (n = 5) fed for 6 months (numbers indicate %) of (E) hepatic CD8+CD62L+ and CD8+CD62L- T cells, (F) CD8+TNF+ cells, (G) CD8+IFNγ+ cells, derived from livers of the respective genotypes/groups fed for 6 months. (H) Treatment scheme for the WT CD-HFD male mice treated with B-cell depletion antibody anti-CD20 (αCD20). (I) Quantifications of flow cytometry analyses of liver CD19+ and CD20+ cells and (J) lamina propria small intestine CD19+ and CD20+ cells, comparing control and WT CD-HFD αCD20-treated male mice (n ≥3). All mice were fed for 6 months. (K) Representative H&E staining of liver sections. (L) NAS evaluation of mice (n = 5). (M) Serum ALT levels in male mice (n = 5). (N) Representative Sudan red staining of liver sections of control and WT CD-HFD αCD20-treated male mice. (O) Analysis of hepatic triglycerides in male mice (n ≥3). (P–S) Quantification of flow cytometry analyses comparing control-treated and WT CD-HFD αCD20-treated male mice (n ≥3) of (P) hepatic CD8+CD62L+ and CD8+CD62L- cells; quantification of (Q) hepatic CD8+TNF+ cells and (R) CD8+IFNγ+ cells. (S) Representative H&E staining and IHC staining of GP73, collagen IV and Ki67 for WT CD-HFD tumours and for not-affected livers of JH-/- CD-HFD; from 12 months fed CD-HFD mice. Scale bars represent H&E: 500 μm (left) and 100 μm (right); GP73: 100 μm; collagen IV: 100 μm; Ki67: 100 μm (positive hepatocytes depicted by arrowheads). (T) Graph summarizing non-tumour (NT) and tumour (T), of WT and JH-/- mice fed with CD-HFD for 12 months (numbers of mice are indicated, as symbols depict individual mice), data were analysed by Fisher’s exact test. All data are presented as mean ± SEM. Statistical analyses were performed using unpaired t test. Displayed scale bars represent 100 μm.
Fig. 2
Fig. 2
Intestinal B cells suffice to cause NASH. (A) Representative H&E staining of liver sections of WT ND, WT and μMT CD-HFD male mice fed for 6 months. (B) NAS male mice (n = 6). (C) Serum ALT levels in male mice (n ≥6). (D) Representative Sudan red staining of liver sections. (E) Absolute quantifications of flow cytometry of hepatic CD8+CD62L+ and CD8+CD62L- T cells, (F) for CD8+TNF+ cells and (G) CD8+IFNγ+ cells (n = 4). (H) Percentages of splenic CD19+, B220+ and IgA+ cells in male mice (n = 3), evaluated by flow cytometry. (I) Percentages of CD19+, B220+ and IgA+ cells from mesenteric lymph nodes of male mice (n = 3), evaluated by flow cytometry. (J) IgA levels of small intestinal tissues in male mice (n ≥3), measured by ELISA. (K) Representative IgA staining of small intestine sections of 6-month-old male mice (upper row: scale bar 200 μm, bottom row scale bar: 100 μm). (L) Representative H&E staining of liver sections of 6-month-old μMT CD-HFD and μMT CD-HFD αCD20-treated male mice. (M) Representative Sudan red staining of liver sections of male mice. (N) NAS evaluation of male mice (n = 4). (O) ALT levels in male mice (n = 4). (P) Flow cytometric analysis quantifications of lamina propria CD20+IgA+ cells. (Q) Absolute quantifications of hepatic CD8+CD62L+ and CD8+CD62L- cells (n = 4). (R) Hepatic CD8+TNF+ and (S) CD8+IFNγ+ cells, comparing WT ND, μMT CD-HFD and μMT CD-HFD αCD20-treated male mice (n = 4). (T) Representative H&E and IHC staining of GP73 and Ki67 in WT and μMT CD-HFD tumours (12 months under diet). Scale bars H/E: 500 μm (left) and 100 μm (right); GP73: 100 μm; Ki67: 100 μm (positive hepatocytes depicted by arrowheads). (U) Graph summarizing non-tumour (NT) and tumour (T) of WT and μMT mice fed with CD-HFD for 12 months (n ≥60). Symbols depict individual mice. Data were analysed by Fisher’s exact test. (V) Quantification of nodule size in 12-month WT and μMT CD-HFD mice (n ≥3). All data are presented as mean ± SEM. Statistical analyses were performed using unpaired t test. The scale bars represent 100 μm.
Fig. 3
Fig. 3
B cells get metabolically activated and form clusters with T cells in the lamina propria of NASH-bearing mice. All data represent the small intestine. (A-J) Representative pseudocolor plots and quantifications of flow cytometric analyses comparing small intestine lamina propria from WT ND, WT CD-HFD and μMT CD-HFD male mice (≥4): (B) percentages of CD20+CD19+, CD20+CD19-, CD20-CD19- cells, (C) IgD+IgM+, IgD+IgM-, IgD-IgM+ cells, (D) CD20+MHC-II+ cells, (E) CD20+IgA+ cells, (F) CD20+IgA+MHC-II+ cells, (G) representative pseudocolor plots for IgA+ and CXCR4+ cells, (H) percentages of CD20-IgA+CXCR4+ cells, (I) IgA+B220-CD20- cells, and (J) IgA+B220-CD20-CXCR4+ cells. (K) Automated optimized parameters for T-distributed stochastic neighbour embedding (opt-SNE) graphs from flow cytometric analysis of male mice (n = 9) displaying B cells. On the left, opt-SNE plots indicate scaled expression of CD20, B220 and IgA. (L) Opt-SNE graphs from flow cytometric analysis of male mice (n = 9) displaying T cells and scaled expression of CD8α, CD44 and PD1. (M) Representative high-resolution confocal microscopy and 3D reconstruction images of small intestine lamina propria staining for B220+ and CD8+ cells (yellow areas indicate a point of contact among B220+ and CD8+ cells), and (N) quantification of clusters of B220+/CD8+ interacting cells, (number cells interactions per field of view, FOV), in WT ND and WT CD-HFD (n = 3, with n = 8 FOV each mouse). (O, P) Heatmaps of immune system-related genes and metabolic process-related genes significantly different in small intestine lamina propria FACS-sorted (O) CD20+ cells or (P) B220+ cells isolated from WT and μMT CD-HFD vs. WT ND, indicated as z-scaled values. (Q) Flow cytometry quantification of total living B cells isolated from small intestine derived from male mice (6 months of diet) (n = 4). (R) Descriptive scheme for the flow cytometry performed with a transgenic mouse model of Kaede mice, bearing the photoconvertible fluorescence Kaede protein, which changes from green to red upon exposure to violet light: immune cells stained in red indicate migration into the liver from the small intestine; instead, cells stained in green are migrating immune cells from any other organ. (S) On the left, flow cytometric analysis indicates frequencies of liver CD3+CD19- cells (n ≥5). On the right, geometrical MFI from flow cytometry analysis of Kaede red or green liver B220+CD19+ cells in ND, CD-HFD and WD-HTC mice (n ≥5). (T) Percentages of flow cytometry analysis of splenic CD8+CD69+, CD8+CD25+, CD8+PD1+, CD8+CXCR6+ and CD8+CTL4+ cells from CD44+CD8+ cells; splenic T cells isolated from a healthy mouse were stimulated with Dynabeads (anti-CD3/CD28) and were co-cultured for 24 or 48 h with intestinal B cells isolated from WT ND or WT CD-HFD. Additional treatments included Dynabeads plus LFA-1 blocker, or ICAM-1 blocker, or MHC-I blocker (n = 4). All data are presented as mean ± SEM. Statistical analyses were performed using unpaired t test.
Fig. 4
Fig. 4
Immunoglobulin secretion by B cells is essential for NASH development. (A) Representative H&E staining of liver sections from WT ND, WT CD-HFD and IgMi CD-HFD mice fed for 6 months. (B) NAS and (C) body weight measurement of male mice at 6 months post-diet-start (n ≥5). (D) Serological ALT male mice (n ≥5). (E) Representative Sudan red of liver sections. (F–I) Quantification of flow cytometry for (F) hepatic total CD8+CD62L+ and CD8+CD62L-cells, (G) total CD8+TNF+ cells, (H) total CD8+IFNγ+ cells, (I) total CD19+ cells, in male mice (n ≥4). (J) Quantification of hepatic clusters of B220+/CD8+ interacting cells in male mice (n = 3 for WT controls, n = 2 for IgMi CD-HFD mice, with n = 8 FOV each mouse). (K) Representative high-resolution confocal microscopy and 3D reconstruction images of small intestine lamina propria staining for B220+ cells and CD8+ cells (yellow areas indicate cell-cell contact between B220+ and CD8+ cells). (L) Quantification of flow cytometric analyses of small intestine CD20+, IgA+ cells, MHC-II+ cells, of CD8+ cells. All data are presented as mean ± SEM. Statistical analyses were performed using unpaired t test. Scale bars represent 100 μm, or as indicated.
Fig. 5
Fig. 5
FcR signalling activated in macrophages through IgA drives hepatic fibrosis in NASH. (A) Sirius red staining representative images from livers of WT ND and WT, JH-/-, WT αCD20-treated, μMT, IgMi, AIDg23s mice (all under CD-HFD for 6 months). (B) Percentages of fibrosis incidence divided among the different degrees of fibrosis (mild 0.5-2%; moderate 2-5%; severe >5%) in above-mentioned mouse groups. (C) Quantifications of liver flow cytometric analyses of total CD45+Ly6G-Cd11c-F4/80+CD11b+Ly6C+ cells from WT ND and WT, JH-/-, WT αCD20-treated, μMT, IgMi mice under CD-HFD (n ≥3). (D) Sirius red quantification of livers from 4-month WT ND, WT CD-HFD, WT WD-HTF or CDA-HFD (n ≥4). (E) CD45+ cells from livers of 4-month ND, WD-HTF and CDA-HFD (all WT) fed mice were sorted and 10X single-cell RNA-seq experiments were performed (n ≥2); Representative UMAP plots visualizing single-cell RNA-sequenced CD45+ cells from livers of 4-month ND, WD-HTF and CDA-HFD, indicating individual cell spatial positions in blue colour among the three groups. (F) UMAP plot visualizing immune cell populations FACS-sorted by CD45+. The identified immune cells population displayed are MoMFs/monocytes, KCs, DCs, neutrophils, T cells, B cells, plasma B cells, diving cells, NKT cells, and ILCs. (G) UMAP plot visualizing cell clusters of single-cell RNA-sequenced CD45+ cells of all mouse groups (legend reporting the number of cells in parentheses). (H) Abundance plots showing relative percentages of MoMF clusters majorly differentiated under diet-experimental conditions,, of 4-month ND, WD-HTF and CDA-HFD mice (n ≥2). (I) Double-violin plots showing the mRNA expression of Fcgr1 in most relevant MoMF clusters, comparing CDA-HFD or WD against ND mice (n ≥2). (J) Representative H&E staining of liver sections of 6-month WT and FcRγ-/- male mice fed with CD-HFD. (K) Representative Sirius red staining and quantification of liver sections of 6-month WT and FcRγ-/- male mice fed with CD-HFD (n = 4). (L) Quantifications of liver flow cytometric analyses of total CD45+Ly6G-Cd11c-F4/80+CD11b+Ly6C+ cells in WT and FcRγ-/- male mice fed with CD-HFD (n = 4). (M) Correlation plot indicating serological IgA and Sirius red positivity in CD-HFD male mice (n ≥3). (N) Representative IHC images of FCGR1 staining of liver sections and (O) quantifications of FCGR1+ aggregates per mm2 (n ≥3) and phospho-HCK (per mm2) (n ≥3). (P) Correlation plots indicating FCGR1+ aggregates per mm2 and Sirius red positivity, and p-HCK+ cells per mm2 and Sirius red positivity (n ≥3). (Q) Relative mRNA expression levels measured through qRT-PCR of major profibrogenic genes from 12-weeks in WT or FcRγ-/- BMDMs, after stimulation with serum of WT ND, WT CD-HFD or μMT CD-HFD (6-months under diet) (n ≥2), with or without the addition of IgA alone or in combination with Fc-blocker. Complement proteins were deactivated with a serum pre-treatment of 30 min at 56 °C. All data are presented as mean ± SEM. Statistical analyses were performed using unpaired t test or Pearson correlation's test. The scale bar represents 100 μm.
Fig. 6
Fig. 6
Summary of models, including germ-free mice on NASH diet. (A) Table indicating NASH phenotypes, B cells/immunoglobulin types, fibrosis, B-T cell interactions and HCC in all mouse models applied in this study research. (B) Graphical summary displaying the role of lamina propria CD20+IgA+B cells in the context of NASH activated externally to lymphoid follicles and increased in number, forming clusters with CD8+ T cells. The latter may migrate from the lamina propria to the liver via the portal vein. Secondary lymphoid organ (e.g., spleen) derived IgA+B cells contribute via IgA+ to liver fibrosis through activation of FcRγ signalling in monocyte-derived macrophages (positive for FCGR1, S100a4, Ly6C, CD11b, F4/80). (C) Representative H&E staining of liver sections derived from GF WT ND and GF WT CD-HFD male mice fed for 6 months. (D) Representative Sudan red staining of liver sections from GF male mice (CD-HFD for 6 months). (E) Quantifications of liver flow cytometric analyses comparing 6-month GF ND, and GF CD-HFD for total CD8+ cells, CD8+CD62L+ and CD8+CD62L- cells, CD8+TNF+ cells, and CD8+perforinhigh cells (n = 4). (F) Representative IHC images of liver sections and (G) quantifications per mm2 for B220, CD3, F4/80 and MHC-II staining of GF ND and GF CD-HFD mice (n = 5). (H) Quantifications of small intestine flow cytometric analyses of CD20+CD19+, CD20+CD19- and CD20-CD19+ cells in GF male mice (n = 4). (I) Representative high-resolution confocal microscopy and 3D reconstruction images of small intestine lamina propria staining for B220+ and CD8+ cells (yellow areas indicate a point of contact among B220+ and CD8+ cells), and (J) quantification of clusters of B220+/CD8+ interacting cells, of GF male mice (n = 3, with n ≥4 FOV each mouse). All data are presented as mean ± SEM. Statistical analyses were performed using unpaired t test. The scale bar represents 100 μm.
Fig. 7
Fig. 7
Intestinal B cells and hepatic myeloid cells in NAFLD-affected patients. (A) Representative CD20 stained jejunum samples of NAFL and NASH-affected patients. (B) CD20+ cells quantification in jejuna of patients with NAFL, and NASH, per mm2 (n ≥4). (C) Phospho-SYK quantification on immune cells (B cells or myeloid cells) in jejuna on patients with NAFL or NASH (n ≥5). (D) Serum measurement of IgA levels in patients with NAFLD divided into two subgroups (F0–F2 and F3–F4) based on fibrosis score (Brunt/Kleiner scoring) (n ≥233 each group, total n = 639). (E) Correlation plot of IgA serological levels and fibrosis stage in NAFLD patient cohort of 639 individuals. (F) Serum measurement of IgA levels in patients with NAFLD divided into two subgroups based on the absence or presence of liver portal inflammation (n ≥233 each group, total n = 639). (G) Correlation plot of IgA serological levels and portal inflammation scores in the NAFLD patient cohort of 639 individuals. (H) Heatmaps showing transcriptomics analysis derived log2 fold-change values of selected genes involved in the monocyte-derived macrophage phenotype, in FcRγ signalling and in fibrogenesis, from patients with NAFLD and with different degrees of fibrosis vs. patients with NAFL (total n = 206). (I–K) Correlation plots of fibrosis stage and portal tract or parenchymal (I) FCER1G+ cells/mm2, (J) CCR2+ cells/mm2, or (K) S10014+ cells/mm2 (n = 31). (L) IHC representative images of FCER1G, CCR2 and S100A4 in patients with NAFLD, with absent/very low fibrosis (F0/F1) and high fibrosis (F3), and their quantifications (M) in two fibrosis subgroups for portal and parenchymal quantified stained cells (n ≥11). (N) UMAP plots indicating liver CD45+ FACS-sorted cells and subsequently single-cell 10X RNA-sequenced, divided into TMs, KCs, and SAMs, from healthy donors and patients with NAFLD-related cirrhosis, and percentages of each myeloid subpopulation below (n ≥5). (O) Heatmaps indicating the top 100 most variable genes among healthy donors and patients with cirrhosis in SAMac population (n = 5). (P) UMAP plots indicating mRNA expression scores of FCGR1A gene in SAMs from healthy donors and patients with NAFLD and cirrhosis, with statistical analysis below (n ≥5). (Q) Expression scores of activated FcRγ signature (Reactome) in healthy donor livers and in NAFLD/ALD-cirrhotic SAM population, with statistical analysis below (n ≥5). All data are presented as mean ± SEM. Statistical analyses were performed using unpaired t test or Pearson correlation's test.. The scale bar for IHC represents 100 μm, for immunofluorescence 50 μm.

Similar articles

Cited by

References

    1. Huang D.Q., El-Serag H.B., Loomba R. Global epidemiology of NAFLD-related HCC: trends, predictions, risk factors and prevention. Nat Rev Gastroenterol Hepatol. 2021;18(4):223–238. - PMC - PubMed
    1. Anstee Q.M., Reeves H.L., Kotsiliti E., Govaere O., Heikenwalder M. From NASH to HCC: current concepts and future challenges. Nat Rev Gastroenterol Hepatol. 2019;16(7):411–428. - PubMed
    1. Pfister D., Núñez N.G., Pinyol R., Govaere O., Pinter M., Szydlowska M., et al. NASH limits anti-tumour surveillance in immunotherapy-treated HCC. Nature. 2021;592(7854):450–456. - PMC - PubMed
    1. Dudek M., Pfister D., Donakonda S., Filpe P., Schneider A., Laschinger M., et al. Auto-aggressive CXCR6. Nature. 2021;592(7854):444–449. - PubMed
    1. Ringelhan M., Pfister D., O'Connor T., Pikarsky E., Heikenwalder M. The immunology of hepatocellular carcinoma. Nat Immunol. 2018;19(3):222–232. - PubMed

Publication types

Substances