. 2023 Aug:124:45-55.e2.
doi: 10.1016/j.exphem.2023.05.004. Epub 2023 May 22.

Comparative analysis of Tet2 catalytic-deficient and knockout bone marrow over time

Affiliations

Comparative analysis of Tet2 catalytic-deficient and knockout bone marrow over time

Julio C Flores et al. Exp Hematol. 2023 Aug.

Abstract

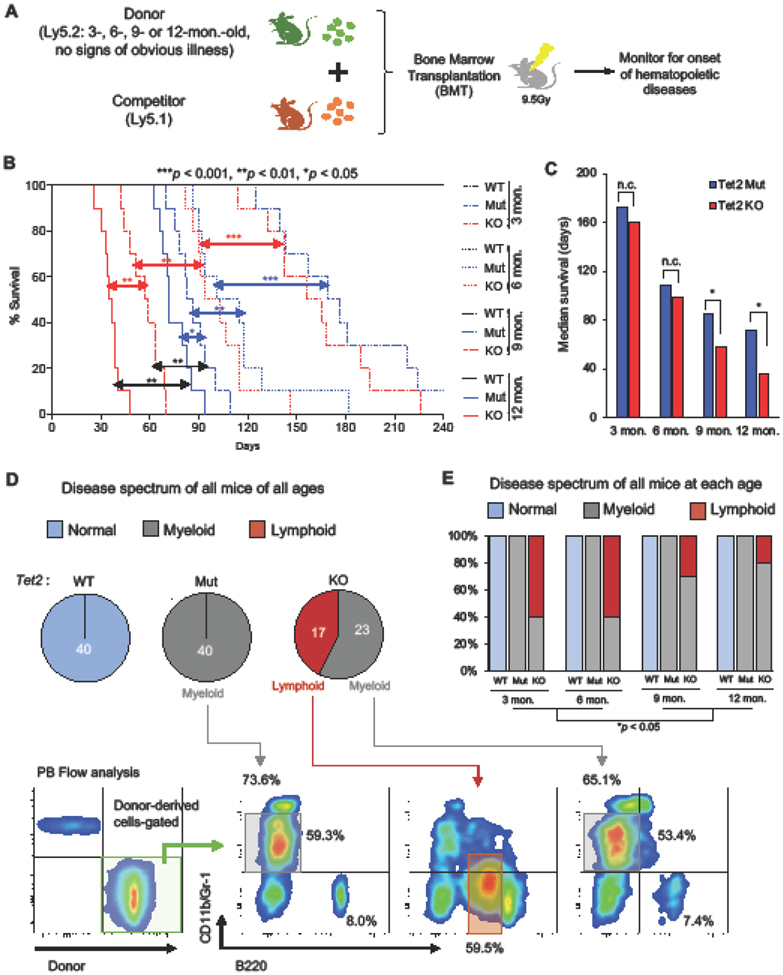
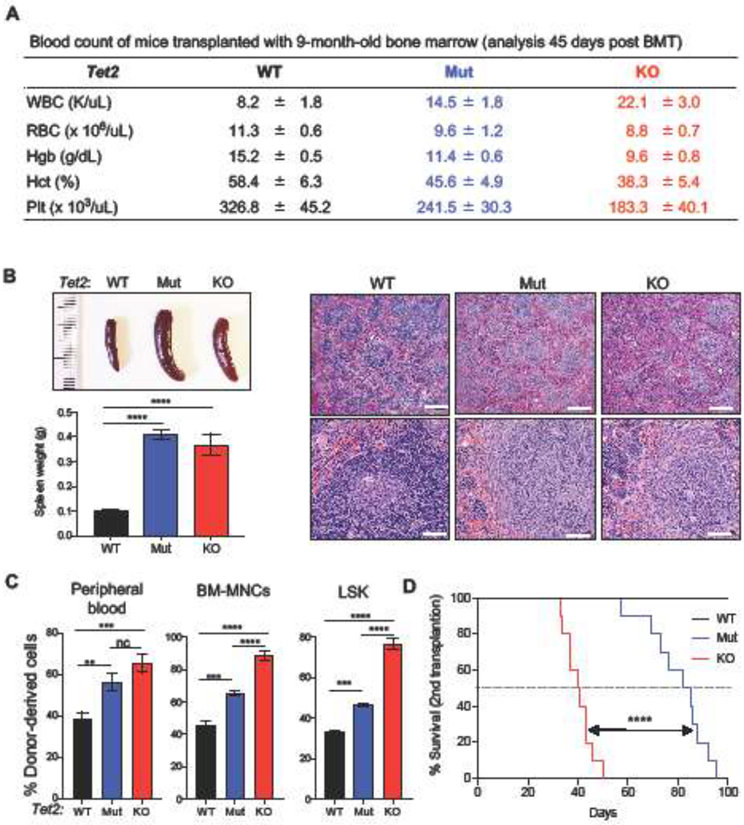
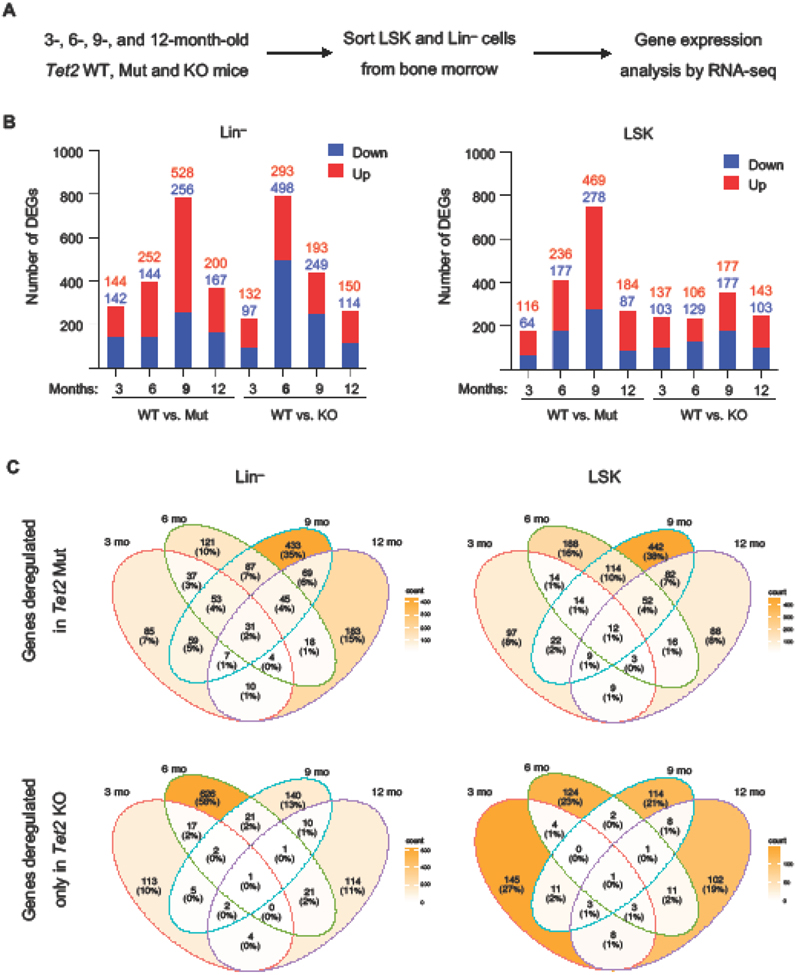
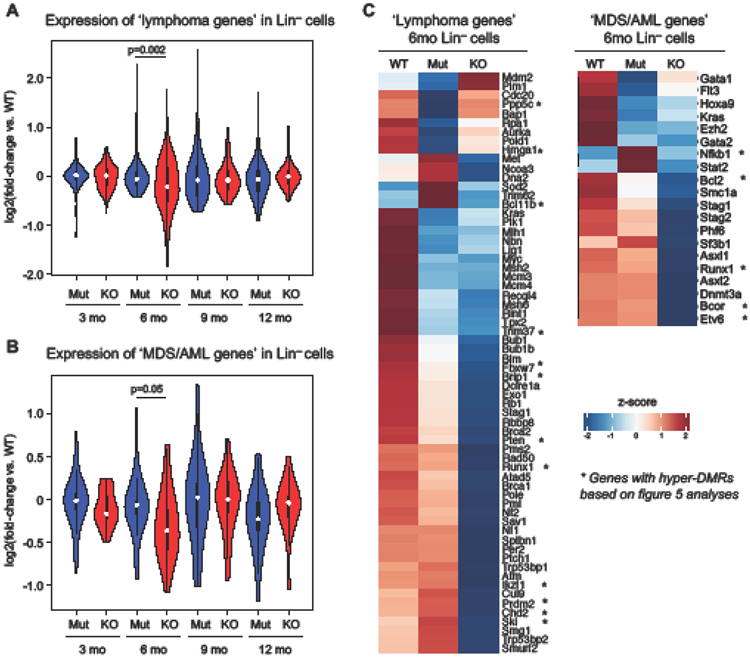
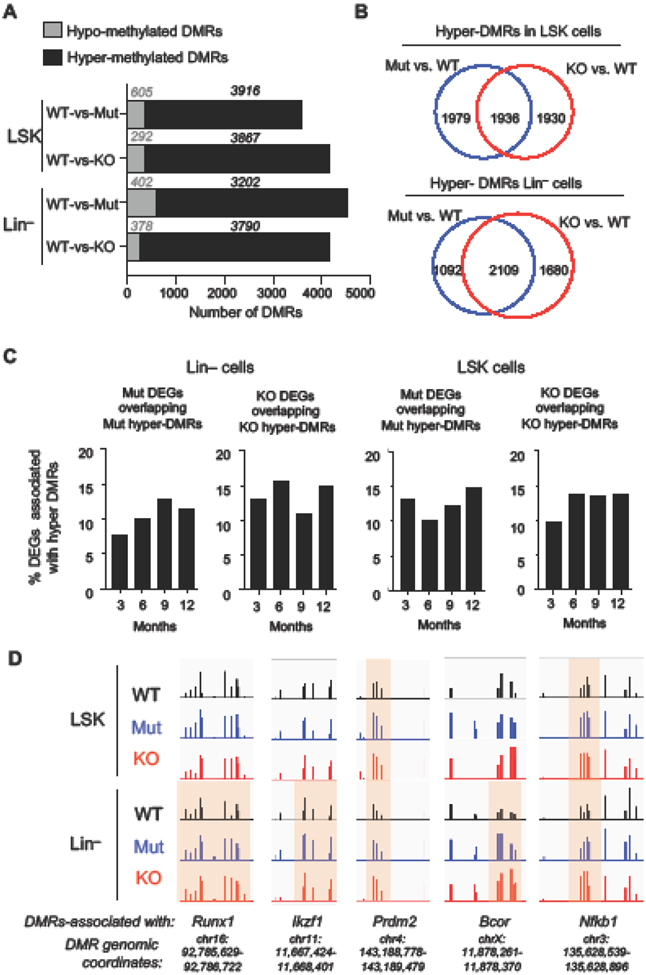
TET2 is a member of the Ten-eleven translocation (Tet) family of DNA dioxygenases that regulate gene expression by promoting DNA demethylation (enzymatic activity) and partnering with chromatin regulatory complexes (nonenzymatic functions). TET2 is highly expressed in the hematopoietic lineage, where its molecular functions are the subject of continuous investigations because of the prevalence of TET2 mutations in hematologic malignancies. Previously, we have implicated Tet2 catalytic and noncatalytic functions in the regulation of myeloid and lymphoid lineages, respectively. However, the impact of these functions of Tet2 on hematopoiesis as the bone marrow ages remains unclear. Here, we conducted comparative transplantations and transcriptomic analyses of 3-, 6-, 9-, and 12-month-old Tet2 catalytic mutant (Mut) and knockout (KO) bone marrow. Tet2 Mut bone marrow of all ages exclusively caused hematopoietic disorders of the myeloid lineage. In contrast, young Tet2 KO bone marrow developed both lymphoid and myeloid diseases, whereas older Tet2 KO bone marrow predominantly elicited myeloid disorders with shorter latency than age-matched Tet2 Mut bone marrow. We identified robust gene dysregulation in Tet2 KO Lin- cells at 6 months that involved lymphoma and myelodysplastic syndrome and/or leukemia-causing genes, many of which were hypermethylated early in life. There was a shift from lymphoid to myeloid gene deregulation in Tet2 KO Lin- cells with age, underpinning the higher incidence of myeloid diseases. These findings expand on the dynamic regulation of bone marrow by Tet2 and show that its catalytic-dependent and -independent roles have distinct impacts on myeloid and lymphoid lineages with age.


Conflict of interest statement

Disclosure of conflict of interests

The authors declare no competing financial or other conflicts of interest.

Figures

Figure 1.
Figure 1.. Analysis of the age-related hematological phenotypes induced by Tet2 Mut and KO mouse bone marrow cells.
A. Schematic of transplantation of bone marrow from Tet2 Mut and KO mice at the indicated ages. 4.0 × 10⁵ bone marrow mononuclear cells (BM-MNCs) from 3-, 6-, 9- and 12- month-old Tet2 Mut or KO primary mice with no sign of hematological disorders, or age-matched wild-type mice (Ly5.2) were transplanted into irradiated recipient mice (Ly5.1) with 4.0 × 10⁵ competitor BM-MNCs (Ly5.1). B. Kaplan-Meier survival curve of transplanted mice (n = 10 per each group). Log-rank test was used to assess statistical significance (p-value). C. Median survival of transplanted mice. Note: control wild-type cohort survived beyond 240 days. D. Disease spectrum of the recipient mice from entire cohort (3, 6, 9 and 12 months old, n = 40). Representative flow data and percentages of the indicated fractions of the donor-derived cells in the peripheral blood of recipient mice transplanted with Tet2 Mut and KO donor bone marrow cells which developed hematological disorders are shown in lower panels. Representative gating strategy of donor-derived cells (green) is also shown in bottom left. E. Disease spectrum of each cohort (n = 10 per each group). In all panels, error bars indicate SD unless otherwise specified. n.c. stands for no significant change. *p < 0.05, **p < 0.01, ***p < 0.001, ****p < 0.0001.
Figure 2.
Figure 2.. Hematopoietic characterization induced by donor bone marrow cells from 9-month-old Tet2 Mut and KO mice.
A. Blood count of recipient mice transplanted with BM-MNCs from 9-month-old Tet2 Mut and KO donor bone marrow cells 45 days after 1st BMT (n = 5 of each genotype). B. Representative images and weights (left) and H&E staining (right) of spleens of recipient mice transplanted with 9-month-old Tet2 WT, Mut, or KO BM-MNCs 45 days after 1st BMT. Scale bars= 400 μm (in top three panels) and 60 μm (in bottom three panels). C. Percent donor-derived cells in peripheral blood (left) and bone marrow (BM-MNCs [middle] and LSK [right]) 45 days after 1st BMT. D. Kaplan-Meier survival curve of recipient mice upon secondary transplantation (2nd BMT, 10 mice per group). Mice were transplanted with donor bone marrow cells from recipients of 1st transplantation. Log-rank test was used to generate p values. LSK, LinSca-1+c-Kit+. Error bars indicate SD. n.c. stands for no significant change. *p < 0.05, **p < 0.01, ***p < 0.001, ****p < 0.0001.
Figure 3:
Figure 3:. Gene expression profiling of Tet2 Mut and KO LSK and Lin cells harvested at various time points
A. Schematic of RNA-seq strategy. B. Quantification of the number of upregulated and downregulated DEGs in Tet2 Mut and KO Lin and LSK cells vs. WT (log2 fold-change > 1.0, FDR < 0.05) identified by RNA-seq. C. Venn diagram overlapping DEGs found specifically in Tet2 Mut and KO Lin cells (left) and LSK cells (right) across different time points (3, 6, 9, and 12 months). Note that different sets of genes are affected at each time point.
Figure 4:
Figure 4:. Lymphoma and leukemia genes are downregulated in Tet2 KO Lin cells
A. Expression levels of lymphoma signature genes (from GSEA) in Tet2 Mut and KO Lin cells across time points. Fold-change vs. WT is shown. Welch two sample t-test. B. Expression levels of selected MDS/AML signature genes (reported as commonly mutated in the literature) in Tet2 Mut and KO Lin cells across time points. Fold-change vs. WT is shown. Welch two sample t-test. C. Heatmap showing lymphoma and MDS/AML signature genes downregulated in Tet2 KO Lin cells at 6 months. Relative expression levels from normalized counts are shown. * indicated genes containing a hyper-DMR (per the analyses in figure 5).
Figure 5:
Figure 5:. DNA methylation profiling of Tet2 Mut and KO LSK and Lin cells at 3 months of age
A. Number of hypermethylated and hypomethylated differentially methylated regions (DMRs) found in Tet2 Mut and KO LSK and Lin cells by whole genome bisulfite sequencing (WGBS). B. Overlap of differentially hyper-methylated regions (hyper-DMRs) between Tet2 Mut and KO LSK and Lin– cells. C. Overlap of DEGs in Tet2 Mut and KO LSK and Lin cells with hypermethylated DMRs across time points. %DEGs that overlapped with hyper-DMR-associated genes are shown. D. DNA methylation tracks at selected DMRs associated with deregulated lymphoma or MDS/AML-causing genes in LSK and Lin cells.

References

    1. Tahiliani M. et al. Conversion of 5-methylcytosine to 5-hydroxymethylcytosine in mammalian DNA by MLL partner TET1. Science 324, 930–935, doi:10.1126/science.1170116 (2009). - DOI - PMC - PubMed
    1. Ito S. et al. Tet Proteins Can Convert 5-Methylcytosine to 5-Formylcytosine and 5-Carboxylcytosine. Science 333, 1300–1303, doi:10.1126/science.1210597 (2011). - DOI - PMC - PubMed
    1. He YF et al. Tet-mediated formation of 5-carboxylcytosine and its excision by TDG in mammalian DNA. Science 333, 1303–1307, doi:10.1126/science.1210944 (2011). - DOI - PMC - PubMed
    1. Pastor WA, Aravind L & Rao A TETonic shift: biological roles of TET proteins in DNA demethylation and transcription. Nat Rev Mol Cell Biol 14, 341–356, doi:10.1038/nrm3589 (2013). - DOI - PMC - PubMed
    1. Wu SC & Zhang Y Active DNA demethylation: many roads lead to Rome. Nat Rev Mol Cell Biol 11, 607–620, doi:10.1038/nrm2950 (2010). - DOI - PMC - PubMed

Publication types