. 2023 Aug 7;119(9):1825-1841.
doi: 10.1093/cvr/cvad082.

Macrophage angiotensin-converting enzyme reduces atherosclerosis by increasing peroxisome proliferator-activated receptor α and fundamentally changing lipid metabolism

Affiliations

Macrophage angiotensin-converting enzyme reduces atherosclerosis by increasing peroxisome proliferator-activated receptor α and fundamentally changing lipid metabolism

DuoYao Cao et al. Cardiovasc Res. .

Erratum in

Abstract

Aims: The metabolic failure of macrophages to adequately process lipid is central to the aetiology of atherosclerosis. Here, we examine the role of macrophage angiotensin-converting enzyme (ACE) in a mouse model of PCSK9-induced atherosclerosis.

Methods and results: Atherosclerosis in mice was induced with AAV-PCSK9 and a high-fat diet. Animals with increased macrophage ACE (ACE 10/10 mice) have a marked reduction in atherosclerosis vs. WT mice. Macrophages from both the aorta and peritoneum of ACE 10/10 express increased PPARα and have a profoundly altered phenotype to process lipids characterized by higher levels of the surface scavenger receptor CD36, increased uptake of lipid, increased capacity to transport long chain fatty acids into mitochondria, higher oxidative metabolism and lipid β-oxidation as determined using 13C isotope tracing, increased cell ATP, increased capacity for efferocytosis, increased concentrations of the lipid transporters ABCA1 and ABCG1, and increased cholesterol efflux. These effects are mostly independent of angiotensin II. Human THP-1 cells, when modified to express more ACE, increase expression of PPARα, increase cell ATP and acetyl-CoA, and increase cell efferocytosis.

Conclusion: Increased macrophage ACE expression enhances macrophage lipid metabolism, cholesterol efflux, efferocytosis, and it reduces atherosclerosis. This has implications for the treatment of cardiovascular disease with angiotensin II receptor antagonists vs. ACE inhibitors.

Keywords: PPARα; angiotensin converting enzyme; atherosclerosis; lipid metabolism; macrophages.


Conflict of interest statement

Conflict of interest: None declared.

Figures

Graphical Abstract
Graphical Abstract
Figure 1
Figure 1
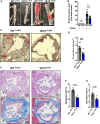
Decreased atherosclerosis in ACE 10/10PCSK9 mice. (A) Aortas from WT and ACE 10/10 mice (10/10) treated with PCSK9-AVV or control mice treated with null-AAV. Aortas were stained with Sudan IV; red indicates lipid-enriched plaque. Scale bar: 500 µm. (B) Percentage of aortic surface area staining for lipid-enriched plaque. (C and D) Histology and quantitation of aortic root sections stained with Oil Red O show decreased wall lipid in ACE 10/10PCSK9 aortas compared to WTPCSK9 (W: wall; L: lumen. Bar: 200 µm). (E) Aortic root sections from WTPCSK9 mice (panels 1 & 3) vs. ACE 10/10PCSK9 mice (2 & 4) stained with haematoxylin and eosin (panels 1 and 2) or the trichrome stain (3 and 4) (Bar: 200 µm). 10/10PCSK9 mice have thinner valve cusps (thin arrows) and valve rings (VR) with less atherosclerotic plaque, less cholesterol crystal deposits (bold arrows), calcium deposits (*), and collagen (blue on the trichrome stain). Flow analysis of apoptotic cells (F) and necrotic cells (G) from the aortas of WTPCSK9 and ACE 10/10PCSK9 mice show more pathology in the tissues of WTPCSK9 mice. Data are presented as the mean ± standard error of the mean (SEM). P-values are shown in the figure (B, D, F, and G) by a two-tailed t-test. *P < 0.05, **P < 0.01, ***P < 0.001, and NS (not significant). Each point is one mouse (n ≥ 8).
Figure 2
Figure 2
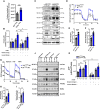
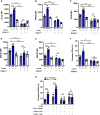
Reparative CD206+ macrophages in atherosclerosis. (A) Percent of CD11b+/F4/80+ cells in the CD11b+ aortic wall population as determined by flow cytometry. (B, C) Percent of F4/80+CD206+ macrophages in the aortas of WTcontrol, WTPCSK9, ACE 10/10control, and ACE 10/10PCSK9 mice ± ramipril (an ACEi) or losartan (an ARB) assessed by flow cytometry. (D–G) Mean fluorescent intensity (MFI) of CD36 (D), IL-10 (E) Ym-1(F), and Arginase-1 (G). (H–K) MFI in F4/80+CD206+ aortic macrophages of MerTK (H), C1q (I), ABCA1 (J), and ABCG1 (K). Where indicated, mice were treated with either ramipril or losartan. Data are presented as the mean ± standard error of the mean (SEM). P-values are shown in the figure (A, F, G, J, and K) by two-tailed t-test or two-way ANOVA (C, D, E, H, and I). *P < 0.05, **P < 0.01, ***P < 0.001, and NS (not significant). n ≥ 6 mice.
Figure 3
Figure 3
Increased ACE in atherosclerotic macrophages. (A) Confocal microscopic pictures of the aortic roots from WTPCSK9 and ACE 10/10PCSK9 mice stained for expression of DAPI, CD206, PPARα, and ACE. Bar indicates 200 µm; enlarged bar 50 µm. L, lumen; W, wall. Arrows in the Enlarged panel indicate groups of cells. (B) In the histologic sections from panel A, CD206+ cells were quantitated for ACE expression. (C and D) In cells isolated from the aortas of WTPCSK9 and ACE 10/10PCSK9 mice, ACE expression by CD206+ macrophages was measured by flow cytometry. Panel C shows raw data while D shows mean fluorescence intensity (MFI). Data are presented as the mean ± standard error of the mean (SEM). P-values are shown in the figure (B and D) by a two-tailed t-test. *P < 0.05, **P < 0.01, ***P < 0.001, and NS (not significant). n ≥ 6 mice.
Figure 4
Figure 4
Increased ACE elevates PPARα in aortic macrophages. (A) In the histologic sections of the aortic root presented in Figure 3A, CD206+ cells were quantitated for PPARα expression by confocal microscopy. (B) The mean fluorescent intensity (MFI) of PPARα in CD206+ cells isolated from aortas of WTPCSK9 and 10/10PCSK9 mice was measured by flow analysis. Some mice were treated with either ramipril or losartan. (C) Western blot analysis of ACE and lipid metabolism-related markers CPT1A/B, CPT2, ACADL, PPARα, and RXRα made by aortic macrophages from WTPCSK9 and 10/10PCSK9 mice. (D–F) Oxygen consumption rates (OCR), calculated basal respiration, and maximal oxygen consumption rates of macrophages from atherosclerotic aortas determined by Seahorse analysis. (G–I) Seahorse analysis of basal respiration and maximal oxygen consumption by WTPCSK9 and 10/10PCSK9 thioglycollate elicited peritoneal macrophages (TPM). (J) Western blot analyses of CPT1A/B, CPT2, ACADL, PPARα, and RXRα in TPM from WT and ACE 10/10 mice treated with either control AAV (null-AAV) or PCSK9-AAV. Some of the PCSK9-AAV treated mice (i.e. WTPCSK9 and ACE 10/10PCSK9 mice) were also treated with ramipril or losartan. (K) ATP levels in OA-treated TPM from WTPCSK9 and ACE 10/10PCSK9 mice in the presence of ramipril or losartan. Data are presented as the mean ± standard error of the mean (SEM). P-values are shown in the figure (A, E, F, H, and I) by two-tailed t-test or two-way ANOVA (B and K) *P < 0.05, **P < 0.01, ***P < 0.001, and NS (not significant). Each point is one mouse (n ≥ 5).
Figure 5
Figure 5
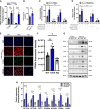
PPARα activation in macrophages with increased ACE expression. (A) Peritoneal macrophages from WTPCSK9 and ACE 10/10PCSK9 mice were incubated with 13C-glucose/unlabelled OA or 13C-OA/unlabelled glucose to compare 13C incorporation into citric acid as measured by mass spectrometry. This assay measures cell metabolic preference. (B) Acetyl-CoA levels in WTPCSK9 and ACE 10/10PCSK9 TPM. (C and D) The oxygen consumption of WTPCSK9 TPM and ACE 10/10PCSK9 TPM treated in vitro with OA was measured using the MitoXpress assay system. Basal respiration is shown in C and the maximal respiration rate in D. Data from TPM treated as above but incubated with ramipril, losartan, or the CPT1 etomoxir are also shown. (E) Cell expression of ACE and nuclear PPARα after OA treatment by WT, ACE 10/10, and ACE KO TPM were studied by immunofluorescence. The TPM is from mice without atherosclerosis or a high-fat diet. Bar indicates 10 µm. (F) Quantitation of PPARα fluorescence intensity of cells in panel E. (G and H) Western blot analysis of untreated (control) and OA treated TPM for CPT1A/B, CPT2, ACADL, ATGL, PPARα, and RXRα. Each point represents data from a single mouse. Data are given as the mean ± standard error of the mean (SEM). P-values are shown in the figure (A and B) by two-tailed t-test or two-way ANOVA (C, D, F, and H). *P < 0.05, **P < 0.01, ***P < 0.001, and NS (not significant). n ≥ 6.
Figure 6
Figure 6
ACE increases the reparative macrophage phenotype induced by oleic acid treatment. Expression of CD206 (A), CD163 (B), CD80 (C) CD86 (D), MerTK (E), C1q (F), and IL-10 (G) by OA treated TPM from WT, ACE 10/10, and ACE KO mice. Expression was measured by flow cytometry. (H) Real-time quantitative PCR of genes associated with β-oxidation (PPARα, RXRα, CPT1A, CPT1B, CPT2, and CD36), reparative (M2) genes (Arg-1, Ym-1, FIZZ-1), and genes associated with efferocytosis (C1q, IL-10, and MerTK) by OA treated TPM from ACE KO, ACE 10/10, and WT mice. Each point is from a single mouse. Data are given as the mean ± standard error of the mean (SEM). P-values are shown in the figure (A–G) by two-way ANOVA. n ≥ 5. *P < 0.05, **P < 0.01, ***P < 0.001, and NS (not significant). Each point represents data from a single mouse.
Figure 7
Figure 7
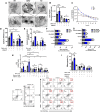
ACE expression increases macrophage lipid uptake, utilization, and cell efferocytosis via the PPARα pathway. (A) In vitro assessment by electron microscopy of lipid droplets in ACE WT, ACE 10/10, and ACE KO TPM after 48 h OA treatment with or without GW6471. Bar indicates 4 µm and 2 µm; enlarged bar 600 and 800 nm. (B) TPMs were cultured with OA as in panel A and then stained with DropliteTM red. Lipid uptake was determined by fluorescence. (C) Reduction of intracellular lipid droplets over time in WT, ACE 10/10, and ACE KO TPM. (D) Lipolysis of TPM after OA treatment with or without GW6471. (E) Acetyl-CoA levels in WT, ACE 10/10, and KO TPM after OA with or without GW6471. (F and G) Basal (F) and maximal (G) respiration rates of TPM from WT, ACE 10/10, and ACE KO mice were measured using the MitoXpress assay. Cells were treated with OA for 48 h along with the FAO inhibitor etomoxir (ETO, 5 μM) or the PPARα antagonist GW6471 (10 μM). (H) The ATP content of WT, ACE 10/10, and ACE KO TPM was measured. Cells were treated as indicated in the panel. (I and J) Efferocytosis of CSFE-labelled apoptotic neutrophils by ACE 10/10, WT, and ACE KO TPM after OA treatment in the presence of etomoxir or GW6471. The ratio of macrophages/apoptotic cells was 1:4. Neutrophil uptake was measured by flow cytometry. Each point represents a single mouse. Data are presented as the mean ± standard error of the mean (SEM). P-values are shown in the figure (B–I) by two-way ANOVA. *P < 0.05, **P < 0.01, ***P < 0.001, and NS (not significant). (n ≥ 5).
Figure 8
Figure 8
ACE 10/10 macrophages have increased cholesterol efflux. (A–E) ACE WT, ACE 10/10, and ACE KO TPMs were treated with ox-LDL with or without GW6471 (30 μg/mL) for 12 h. Flow analysis of ox-LDL uptake (A), PPARα expression (B), CD36 expression (C), ABCA1 expression (D), and ABCG1 expression (E). (F) Cholesterol efflux percent over a 4-h period of ACE WT, ACE 10/10, and ACE KO TPMs treated with ox-LDL with or without GW6471 (30 μg/mL) for 12 h. (G) Cholesterol efflux percent over a 4-h period of TPM from WTPCSK9 and ACE 10/10PCSK9 mice treated with ox-LDL (30 μg/mL) for 12 h in the presence of ramipril or GW6471. Cholesterol efflux was measured using the protocol and reagents from BioVision (Milpitas, CA). Each point is from a single mouse. Data are given as the mean ± standard error of the mean (SEM). P-values are shown in the figure (A–G) by two-way ANOVA. *P < 0.05, **P < 0.01, ***P < 0.001, and NS (not significant). n ≥ 6.
Figure 9
Figure 9
Effect of ACE expression in the human THP-1 cell line. THP-1 cells were stably transfected with an ACE-expressing lentivirus vector (THP-1ACE) or an empty vector (THP- 1VECTOR). The THP-1 cells were primed with 250 nM PMA for 48 h to induce a macrophage phenotype and then treated with OA (200 µM) for 48 h. (A) ACE, PPARα, and the downstream metabolic target CPT1A and CPT1B were studied by Western blot analysis. (B) THP-1ACE and THP-1VECTOR cells were transfected with a PPRE driven-luciferase plasmid, induced to a macrophage phenotype, and treated with OA 200 µM ± the ACE inhibitor lisinopril for 48 h before luciferase activity was measured. ACE inhibition blocks luciferase expression. (C and D) Cellular ATP production and acetyl-CoA concentration in THP-1vector and THP-1ACE cells treated with OA. (E and F) Flow cytometric analysis of efferocytosis. THP-1ACE and THP-1VECTOR cells were induced to a macrophage phenotype and then co-cultured with apoptotic neutrophils as in Figure 7I and J and the percent of cells efferocytosing neutrophils was measured. Data are given as the mean ± standard error of the mean (SEM). P-values are shown in the figure (B–E) by two-way ANOVA. *P < 0.05, **P < 0.01, ***P < 0.001, and NS (not significant). n ≥ 5.

References

    1. Moore KJ, Sheedy FJ, Fisher EA. Macrophages in atherosclerosis: a dynamic balance. Nat Rev Immunol 2013;13:709–721. - PMC - PubMed
    1. Barrett TJ. Macrophages in atherosclerosis regression. Arterioscler Thromb Vasc Biol 2020;40:20–33 - PMC - PubMed
    1. Chen R, Suchard MA, Krumholz HM, Schuemie MJ, Shea S, Duke J, Pratt N, Reich CG, Madigan D, You SC, Ryan PB, Hripcsak G. Comparative first-line effectiveness and safety of ACE (angiotensin-converting enzyme) inhibitors and angiotensin receptor blockers: a multinational cohort study. Hypertension 2021;78:591–603. - PMC - PubMed
    1. Cao DY, Saito S, Veiras LC, Okwan-Duodu D, Bernstein EA, Giani JF, Bernstein KE, Khan Z. Role of angiotensin-converting enzyme in myeloid cell immune responses. Cell Mol Biol Lett 2020;25:31. - PMC - PubMed
    1. Bernstein KE, Khan Z, Giani JF, Cao DY, Bernstein EA, Shen XZ. Angiotensin-converting enzyme in innate and adaptive immunity. Nat Rev Nephrol 2018;14:325–336. - PMC - PubMed

Publication types