Observational Study
. 2023 Aug;94(8):605-613.
doi: 10.1136/jnnp-2022-330626. Epub 2023 May 24.

Early autoimmunity and outcome in virus encephalitis: a retrospective study based on tissue-based assay

Affiliations
Observational Study

Early autoimmunity and outcome in virus encephalitis: a retrospective study based on tissue-based assay

Ding Liu et al. J Neurol Neurosurg Psychiatry. 2023 Aug.

Abstract

To explore the autoimmune response and outcome in the central nervous system (CNS) at the onset of viral infection and correlation between autoantibodies and viruses.

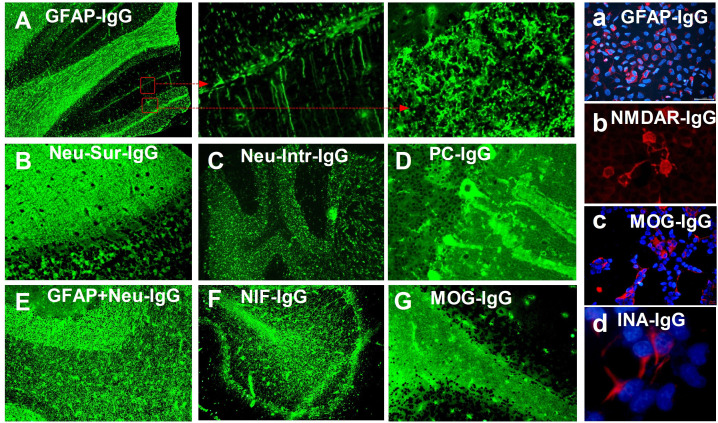
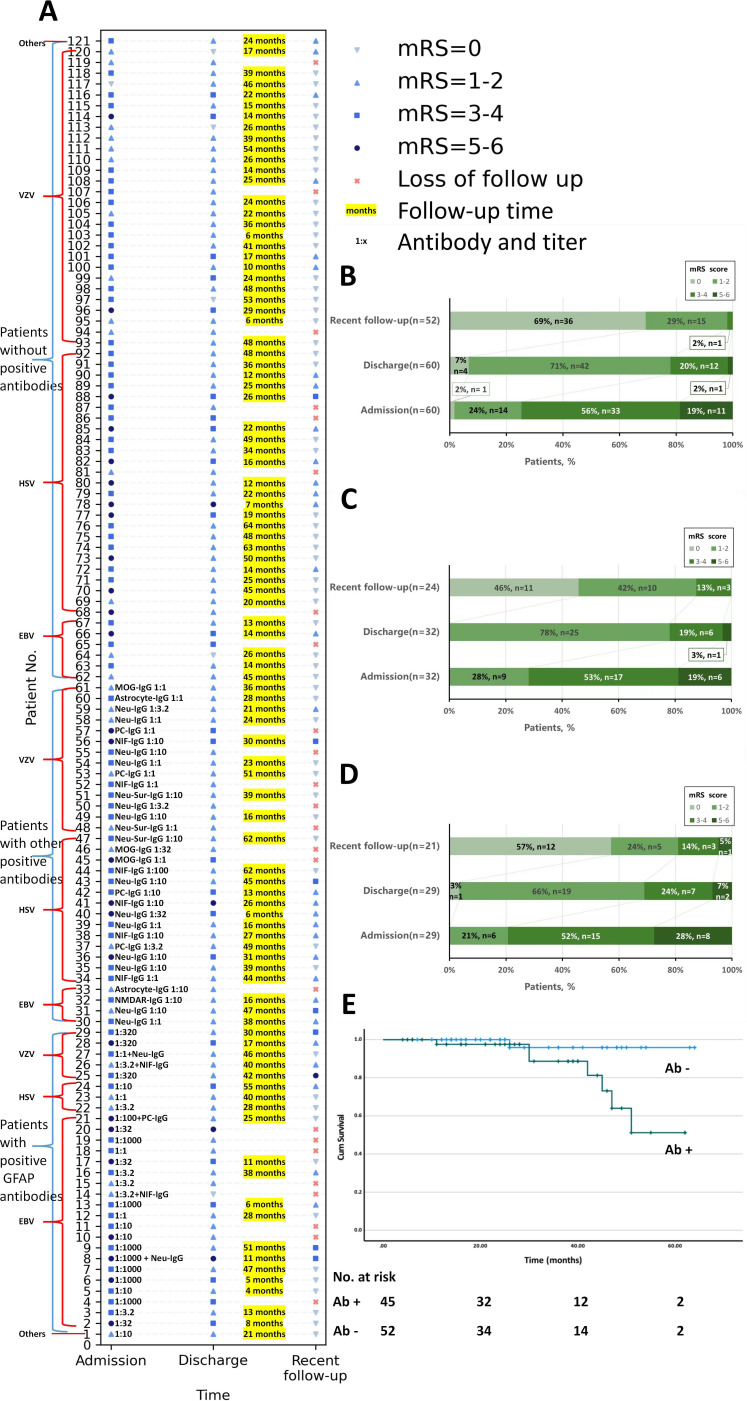
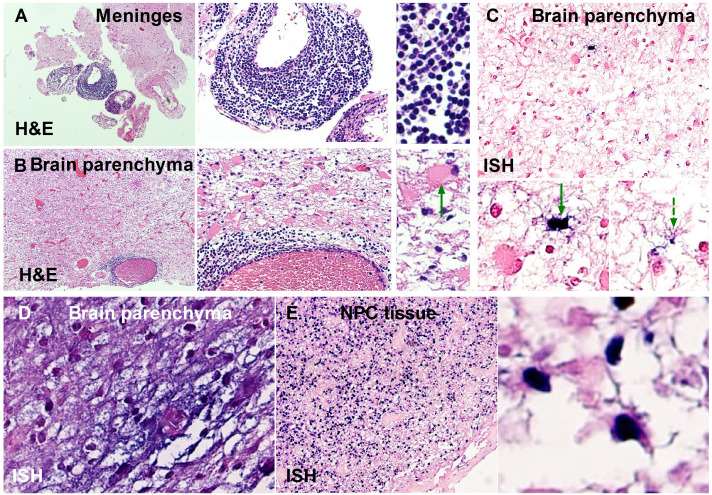
Methods: A retrospective observational study was conducted in 121 patients (2016-2021) with a CNS viral infection confirmed via cerebrospinal fluid (CSF) next-generation sequencing (cohort A). Their clinical information was analysed and CSF samples were screened for autoantibodies against monkey cerebellum by tissue-based assay. In situ hybridisation was used to detect Epstein-Barr virus (EBV) in brain tissue of 8 patients with glial fibrillar acidic protein (GFAP)-IgG and nasopharyngeal carcinoma tissue of 2 patients with GFAP-IgG as control (cohort B).

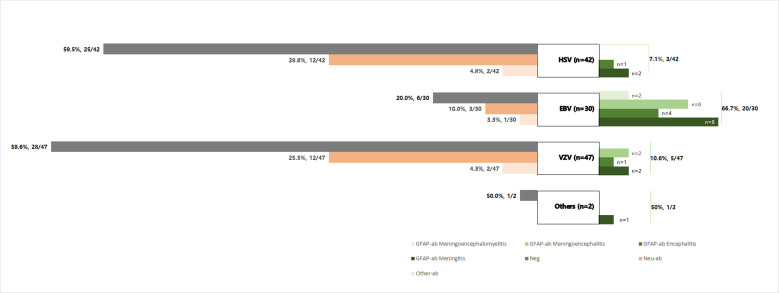
Results: Among cohort A (male:female=79:42; median age: 42 (14-78) years old), 61 (50.4%) participants had detectable autoantibodies in CSF. Compared with other viruses, EBV increased the odds of having GFAP-IgG (OR 18.22, 95% CI 6.54 to 50.77, p<0.001). In cohort B, EBV was found in the brain tissue from two of eight (25.0%) patients with GFAP-IgG. Autoantibody-positive patients had a higher CSF protein level (median: 1126.00 (281.00-5352.00) vs 700.00 (76.70-2899.00), p<0.001), lower CSF chloride level (mean: 119.80±6.24 vs 122.84±5.26, p=0.005), lower ratios of CSF-glucose/serum-glucose (median: 0.50[0.13-0.94] vs 0.60[0.26-1.23], p=0.003), more meningitis (26/61 (42.6%) vs 12/60 (20.0%), p=0.007) and higher follow-up modified Rankin Scale scores (1 (0-6) vs 0 (0-3), p=0.037) compared with antibody-negative patients. A Kaplan-Meier analysis revealed that autoantibody-positive patients experienced significantly worse outcomes (p=0.031).

Conclusions: Autoimmune responses are found at the onset of viral encephalitis. EBV in the CNS increases the risk for autoimmunity to GFAP.

Keywords: autoimmune encephalitis; clinical neurology; neuroimmunology; neurovirology.


Conflict of interest statement

Competing interests: None declared.

Figures

Figure 1
Figure 1
Indirect immunofluorescence patterns of autoantibodies against neurons, astrocytes or other antigens. (A) Typical immunofluorescence pattern of glial fibrillar acidic protein (GFAP)-IgG in the cerebellum, showing IgG bound to the astrocytes in all layers (arrows), which was confirmed by cell-based assay (CBA, figure a). (B) Immunofluorescence pattern of neuronal cellular surface-specific antibody overlapping N-methyl-D-aspartate receptor (NMDAR)-IgG (granular layer confirmed by CBA, figure b) with unknown antigen (molecular layer) in the cerebellum. (C) Immunofluorescence pattern of neuronal nucleus-specific antibody with unknown antigen. (D) Immunofluorescence pattern of Purkinje cell (PC)-specific antibody with unknown antigen. (E) Immunofluorescence pattern of overlapping GFAP-IgG and unknown neuron-specific antibody. (F) Immunofluorescence pattern of neuronal intermediate filament (NIF), confirmed as α-internexin (INA) by CBA (figure d). (G) Typical immunofluorescence pattern of antimyelin oligodendrocyte glycoprotein (MOG) IgG in the myelin of the cerebellum, which was confirmed by CBA (figure c).
Figure 2
Figure 2
Classification of virus and autoantibody. At the onset of herpes simplex virus (HSV) infection, 17/42 (10.5%) patients had antibodies against neuronal antigens (n=12, 28.6%), glial fibrillar acidic protein (GFAP) (n=3, 7.1%) or other antigens (n=2, 4.8%); at the onset of Epstein-Barr virus (EBV) infection, 24/30 (80.0%) patients had antibodies against neuronal antigens (n=3, 10.0%), GFAP (n=20, 66.7%) or other antigens (n=1, 3.3%); at the onset of varicella zoster virus (VZV), 19/47 (40.4%) patients had antibodies against neuronal antigens (n=12, 25.5%), GFAP (n=5, 10.6%) or other antigens (n=2, 4.3%). The one patient with cytomegalovirus had GFAP-IgG in the cerebrospinal fluid. The patients with EBV infection were more likely to have autoantibodies (24/30), compared with patients with HSV (17/42) or VZV (19/47) infection (p<0.001). More antibodies against neuronal antigens were detected in patients with HSV (12/17) or VZV (12/19) infection (EBV 3/24, p<0.001) while more antibodies against GFAP (20/24) were detected in patients with EBV infection (HSV 3/17, VZV 5/19, p<0.001). Ab, antibody.
Figure 3
Figure 3
Neurological status of the patients stratified by autoantibody presence in the CSF. The neurological status was measured using the mRS and was colour-coded. (A) Each patient’s mRS scores at admission, discharge and recent follow-up are shown in the chart. According to mRS scores at admission, there were no statistical differences in severity of infection between CSF-positive and CSF-negative patients. CSF-positive patients seemed to have worse neurological status at discharge, although there were no statistical differences. And CSF-positive patients had worse outcome according to the mRS scores in recent follow-up. In each group, there were no statistical difference in the mRS scores between patients with different virus infection, except that in the CSF-negative group, patients with HSV infection were worse than those with VZV infection at admission (median: 4 (2–5) vs 3 (0–5), p<0.001). (B, C, D) Bar charts of statistics on the mRS scores of patients with detectable anti-GFAP antibody (B, n=29, loss to follow-up rate (loss rate)=7/29), with other autoantibodies (C, n=32, loss rate=7/32) or without autoantibodies (D, n=60, loss rate=8/60). No significant differences were found among the loss to follow-up rates (loss rates) of the different groups (p=0.339). CSF-positive patients (n=45) with follow-up (median: 28 months; IQR: 16–42 months; range: 4–62 months). CSF-negative patients (n=52) with follow-up (median: 25 months; IQR: 15–44 months; range: 6–64 months). No significant differences were found in loss rates between CSF-positive and CSF-negative patients (p=0.075). (E) A Kaplan-Meier analysis with mRS ≥3 as the end point (log rank (Mantel-Cox), p=0.031). The CSF-positive patients were more likely to have poorer outcomes. There were no statistical differences in outcomes between patients with anti-GFAP antibodies and other antibodies. Ab, antibody; CSF, cerebrospinal fluid; EBV, Epstein-Barr virus; GFAP, glial fibrillar acidic protein; HSV, herpes simplex virus; mRS, modified Rankin Scale; VZV, varicella zoster virus.
Figure 4
Figure 4
Pathological evidence of EBV infection in the CNS of patients with GFAP-A. (A, B, C, D) Brain tissue was obtained from two previously reported patients with subacute encephalitis. (A, B, C) Tissue was obtained from patient no. 2 in the previous study. (D) Tissue was obtained from patient no. 6 in the previous study. (A, B) Inflammation was revealed in the meninges and brain parenchyma. Green arrow: astrocyte dystrophy. (C) Astrocytes with EBV infection, detected by ISH. Green solid arrow: EBV-infected astrocyte with degeneration. Green dashed arrow: EBV-infected astrocyte with normal morphology. (D) Neurons and astrocytes stained by ISH. (E) EBV-infected NPC tissue, included as a control, was obtained from the patients with GFAP-A in cohort B. CNS, central nervous system; EBV, Epstein-Barr virus; GFAP, glial fibrillar acidic protein; ISH, in situ hybridisation; NPC, nasopharyngeal carcinoma.

References

    1. Dubey D, Pittock SJ, Kelly CR, et al. . Autoimmune encephalitis epidemiology and a comparison to infectious encephalitis. Ann Neurol 2018;83:166–77. 10.1002/ana.25131 - DOI - PMC - PubMed
    1. Stahl JP, Mailles A. Herpes simplex virus encephalitis update. Curr Opin Infect Dis 2019;32:239–43. 10.1097/QCO.0000000000000554 - DOI - PubMed
    1. Sköldenberg B, Aurelius E, Hjalmarsson A, et al. . Incidence and pathogenesis of clinical relapse after herpes simplex encephalitis in adults. J Neurol 2006;253:163–70. 10.1007/s00415-005-0941-6 - DOI - PubMed
    1. Armangue T, Spatola M, Vlagea A, et al. . Frequency, symptoms, risk factors, and outcomes of autoimmune encephalitis after herpes simplex encephalitis: a prospective observational study and retrospective analysis. Lancet Neurol 2018;17:760–72. 10.1016/S1474-4422(18)30244-8 - DOI - PMC - PubMed
    1. Schäbitz W-R, Rogalewski A, Hagemeister C, et al. . VZV brainstem encephalitis triggers NMDA receptor immunoreaction. Neurology 2014;83:2309–11. 10.1212/WNL.0000000000001072 - DOI - PubMed

Publication types