. 2023 May 24;9(1):27.
doi: 10.1038/s41522-023-00395-3.

Gut microbiome signatures of extreme environment adaption in Tibetan pig

Affiliations

Gut microbiome signatures of extreme environment adaption in Tibetan pig

Fangfang Zhao et al. NPJ Biofilms Microbiomes. .

Abstract

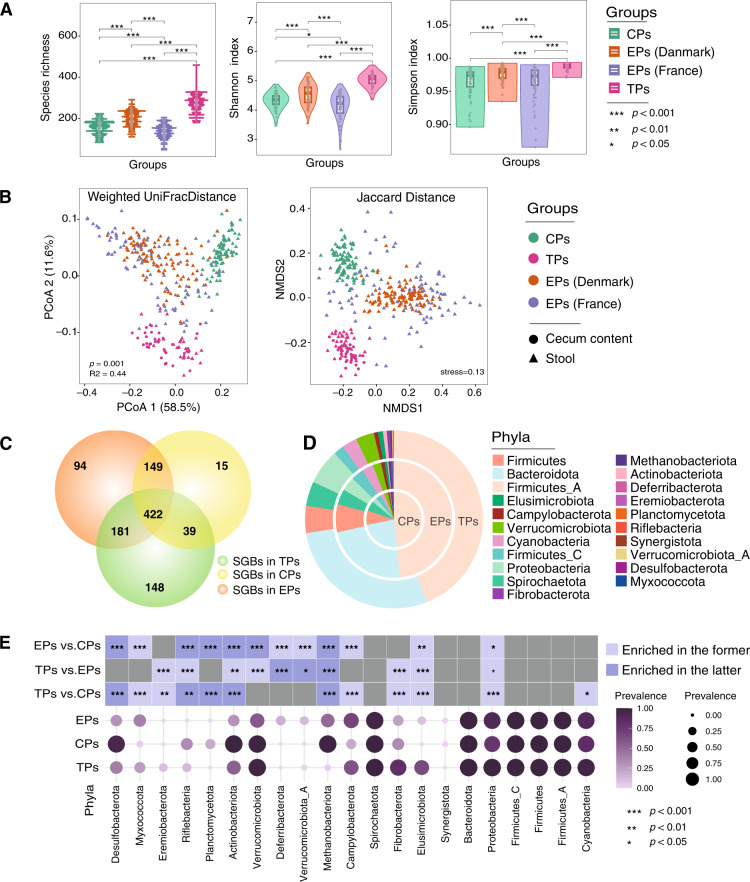
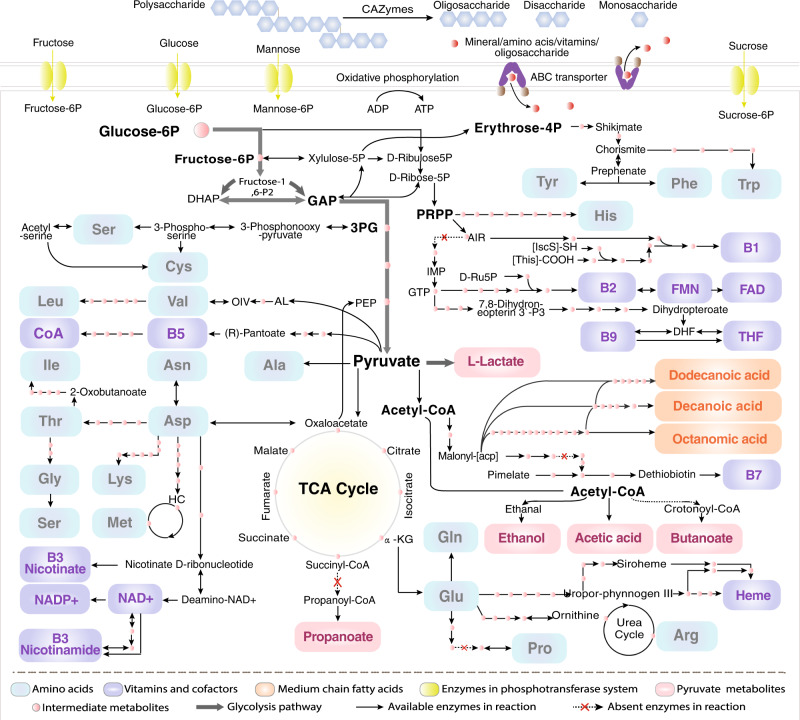
Tibetan pigs (TPs) can adapt to the extreme environments in the Tibetan plateau implicated by their self-genome signals, but little is known about roles of the gut microbiota in the host adaption. Here, we reconstructed 8210 metagenome-assembled genomes from TPs (n = 65) living in high-altitude and low-altitude captive pigs (87 from China-CPs and 200 from Europe-EPs) that were clustered into 1050 species-level genome bins (SGBs) at the threshold of 95% average nucleotide identity. 73.47% of SGBs represented new species. The gut microbial community structure analysis based on 1,048 SGBs showed that TPs was significantly different from low-altitude captive pigs. TP-associated SGBs enabled to digest multiple complex polysaccharides, including cellulose, hemicellulose, chitin and pectin. Especially, we found TPs showed the most common enrichment of phyla Fibrobacterota and Elusimicrobia, which were involved in the productions of short- and medium-chain fatty acids (acetic acid, butanoate and propanoate; octanomic, decanoic and dodecanoic acids), as well as in the biosynthesis of lactate, 20 essential amino acids, multiple B vitamins (B1, B2, B3, B5, B7 and B9) and cofactors. Unexpectedly, Fibrobacterota solely showed powerful metabolic capacity, including the synthesis of acetic acid, alanine, histidine, arginine, tryptophan, serine, threonine, valine, B2, B5, B9, heme and tetrahydrofolate. These metabolites might contribute to host adaptation to high-altitude, such as energy harvesting and resistance against hypoxia and ultraviolet radiation. This study provides insights into understanding the role of gut microbiome played in mammalian high-altitude adaptation and discovers some potential microbes as probiotics for improving animal health.


Conflict of interest statement

The authors declare no competing interests.

Figures

Fig. 1
Fig. 1. Assessment of MAGs quality and taxonomic annotation of SGBs.
A Profiles of medium and high-quality of MAGs. Genome size, N50 and contigs number of medium and high-quality genomes with different colors indicating different genome quality. The related source data is provided as a source data file. B Estimated completeness and contamination of 8210 genomes recovered from pig gut metagenomes. Genome quality was scored as completeness − 5 contamination, and only genomes with a quality score of above 75% were retained. Medium-quality genomes are shown in green, and high-quality genomes in red. Histograms along the x and y axes showing the percentage of genomes at varying levels of completeness and contamination, respectively. The related source data is provided as a source data file. C Numbers of SGBs in each taxonomic rank. The SGBs without existing reference genomes at species-level by GTDB-Tk were defined as unknown SGBs (uSGBs), instead, the SGBs having at least one reference genome were considered as known SGBs (kSGBs). D Phylogenetic tree of pig gut representative SGBs. Inner circle is a phylogenetic tree of 1048 representative SGBs colored according to GTDB phylum-level taxonomic classifications (see color legend). Concentric rings moving outward from first to third ring representing group enriched SGBs according to the presence/absence of SGBs in each group. TPs represents freely grazing Tibetan pigs, EPs represents low-altitude captive European pigs, and CPs represents low-altitude captive Chinese pigs. The related source data is provided as a source data file.
Fig. 2
Fig. 2. Microbial composition and diversity of TPs, EPs and CPs.
A Comparison of alpha diversity indices of gut microbiome among TPs, EPs and CPs. The violin plot and box plot representing the Species richness, Shannon and Simpson diversity index, respectively. Species Richness bar plot based on the presence or absence of SGBs in each sample, Shannon and Simpson diversity index based on relative abundance of SGBs in each sample. The colors indicate host-groups. The related source data is provided as a source data file. B Comparison of beta diversity among TPs, EPs and CPs. PCoA was based on weighted UniFrac distance matrix among samples. The colors and shapes indicate host-groups and sample types, respectively. PCoA plotting showing the microbial community of TPs separated from those of EPs and CPs (Per mutational multivariate analysis of variance, p = 0.001, adjusted R2 = 0.44). B NMDS plotting analysis was based on Jaccard distance matrix among samples. The colors and shapes indicate host-groups and sample types, respectively. NMDS plotting demonstrates the microbial community of TPs separate from EPs and CPs (stress=0.13). The related source data is provided as a source data file. C Distribution of SGBs among TPs, EPs and CPs. Venn diagram showing the prevalence of SGBs in TPs, EPs, and CPs. The colors indicate sample group. D Distribution of microbiota at phylum-level among TPs, EPs and CPs. Pie chart showing the prevalence of phyla in TPs, EPs, and CPs. E, Comparison of enrichment analysis at phylum-level among TPs, EPs and CPs. Bubble plot color and size corresponding to the prevalence of SGBs in a certain phylum. Heat map shows the enrichment significance level (no * representing p > 0.05), and the colors indicate enriched groups.
Fig. 3
Fig. 3. Significant difference in CAZymes and potential substrates between TPs, EPs, and CPs.
Heat map showing the significant difference in CAZymes (except glycosyltransferases) between TPs, EPs and CPs, and their related potential substrates. It only demonstrates the significantly enriched CAZymes in the former host-group.
Fig. 4
Fig. 4. Functional profiles of Elusimicrobia and Fibrobacterota based on KEGG pathways.
Bubble plot showing the significantly enriched KEGG pathways in Elusimicrobia and Fibrobacterota. Enrichment significance (p value) was measured with Fisher’s test (see “Methods”). Bubble color responds to the enrichment significance and bubble size is related to the ratio of the number of genes mapped to a certain pathway. The same color of metabolism pathways in right indicates same pathway module.
Fig. 5
Fig. 5. Metabolic pathway overview of TPs-associated bacteria.
Elusimicrobia and Fibrobacterota were involved in polysaccharide degradation, membrane transport, glycolysis, and TCA cycle, as well as anabolism of fatty acids, amino acids, and B vitamins and cofactors. DHAP dihydroxyacetone phosphate, GAP glyceraldehyde 3-phosphate, PRPP 5-phosphoribosyl diphosphate, 3PG 3-phosphoglycerate, PEP phosphoenolpyruvate, AIR amino imidazole ribonucleotide, IMP inosine monophosphate, GTP guanosine 5′-triphosphate, D-Ru5P d-ribulose 5-phosphate, FAD flavin adenine dinucleotide, FMN riboflavin-5-phosphate, DHF 7,8-Dihydrofolate, THF tetrahydrofolate, AL (S)-2-acetolactate, OIV 2-oxoisovalerate, NAD+ nicotinamide adenine dinucleotide, NADP+ nicotinamide adenine dinucleotide phosphate.

References

    1. Yang S, et al. The local origin of the Tibetan pig and additional insights into the origin of Asian pigs. PLoS One. 2011;6:e28215. doi: 10.1371/journal.pone.0028215. - DOI - PMC - PubMed
    1. Yang J, et al. Genetic signatures of high-altitude adaptation in Tibetans. Proc. Natl. Acad. Sci. USA. 2017;114:4189–4194. doi: 10.1073/pnas.1617042114. - DOI - PMC - PubMed
    1. Qu Y, et al. Ground tit genome reveals avian adaptation to living at high altitudes in the Tibetan plateau. Nat. Commun. 2013;4:2071. doi: 10.1038/ncomms3071. - DOI - PubMed
    1. Li M, et al. Genomic analyses identify distinct patterns of selection in domesticated pigs and Tibetan wild boars. Nat. Genet. 2013;45:1431–1438. doi: 10.1038/ng.2811. - DOI - PubMed
    1. Ai H, et al. Population history and genomic signatures for high-altitude adaptation in Tibetan pigs. BMC Genom. 2014;15:834. doi: 10.1186/1471-2164-15-834. - DOI - PMC - PubMed

Publication types