. 2023 May 24;14(1):2952.
doi: 10.1038/s41467-023-38020-8.

Nucleocapsid-specific T cell responses associate with control of SARS-CoV-2 in the upper airways before seroconversion

Affiliations

Nucleocapsid-specific T cell responses associate with control of SARS-CoV-2 in the upper airways before seroconversion

Tabea M Eser et al. Nat Commun. .

Abstract

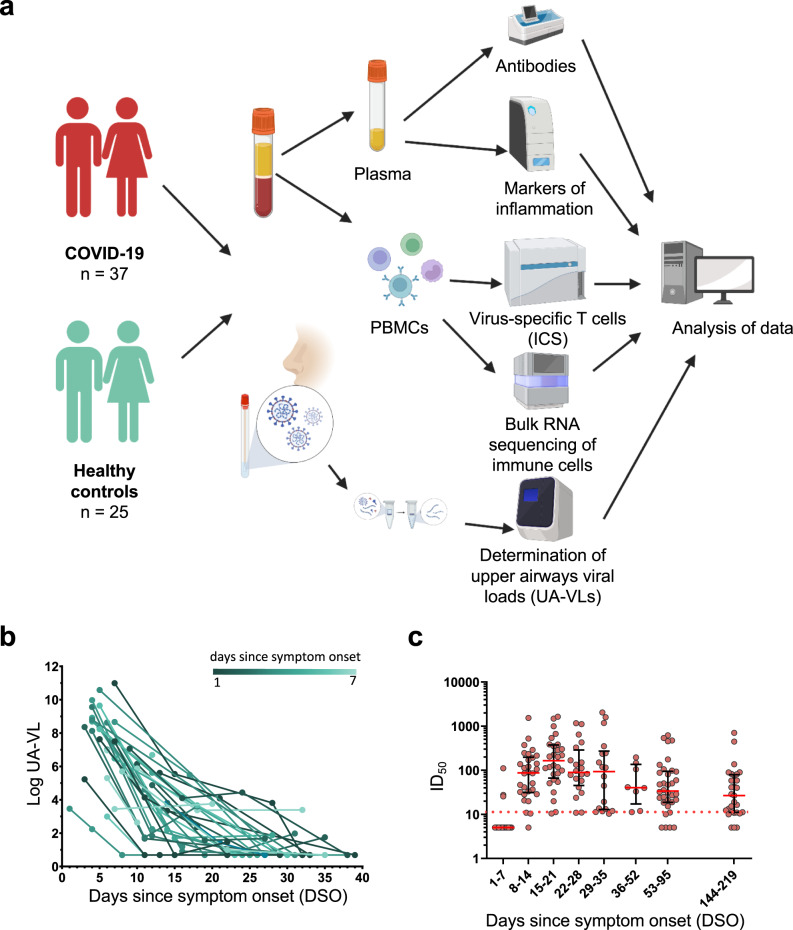
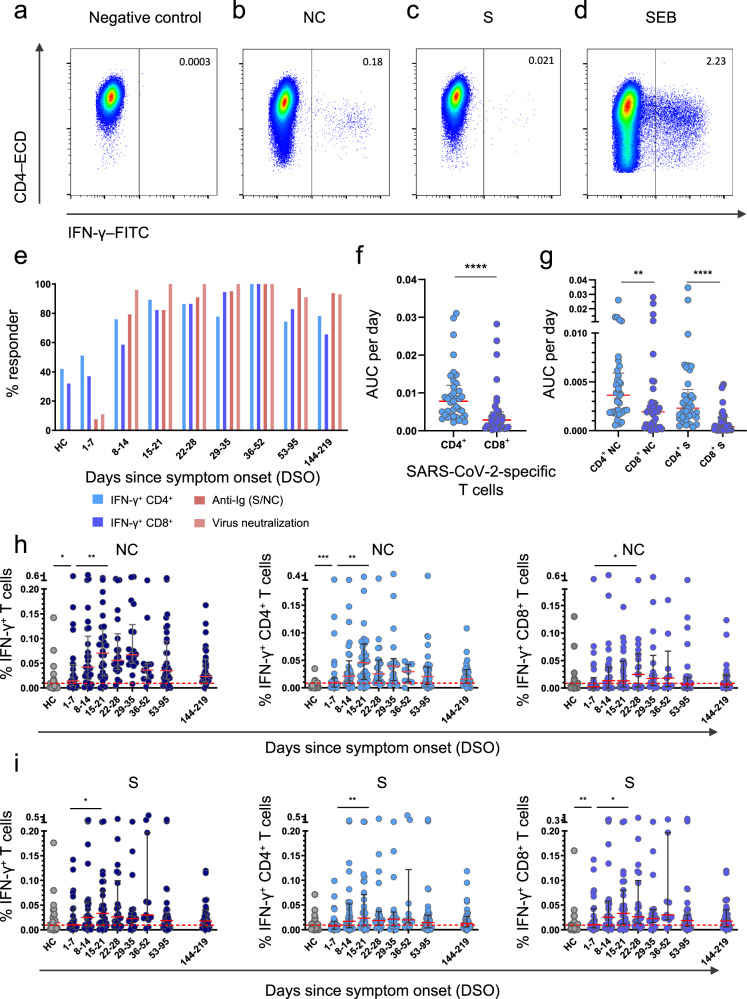
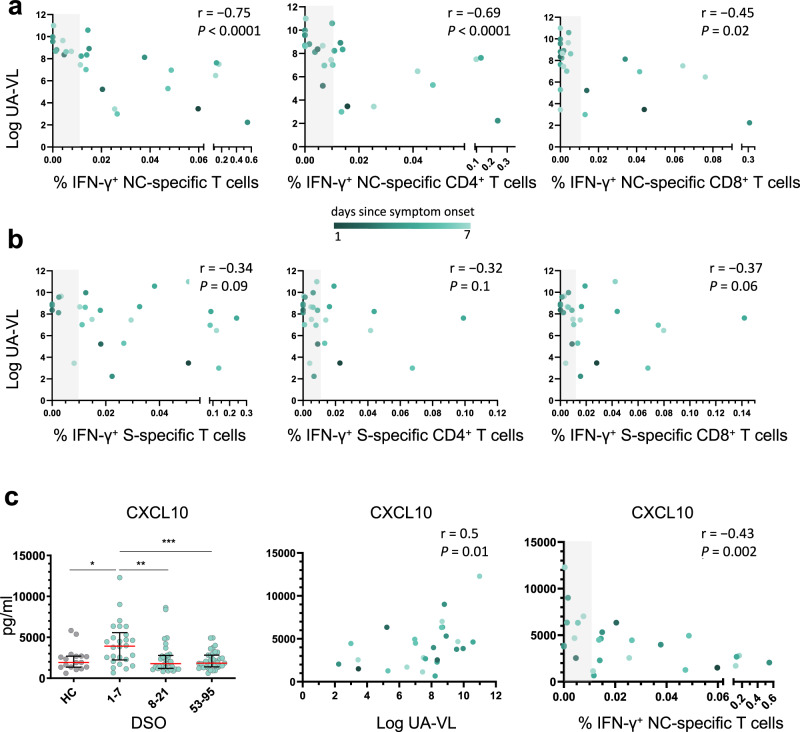
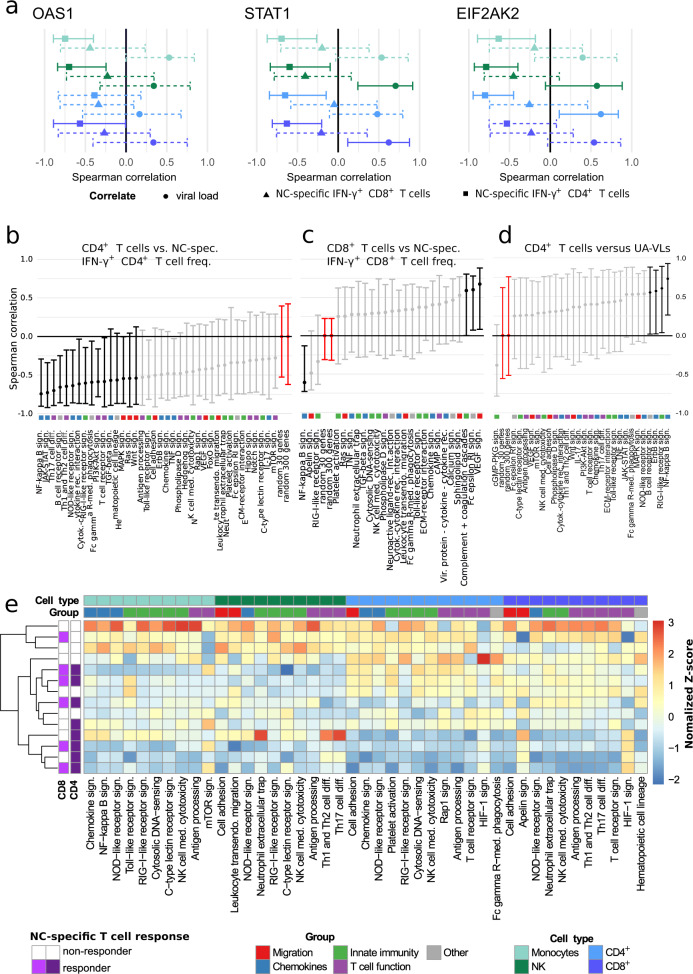
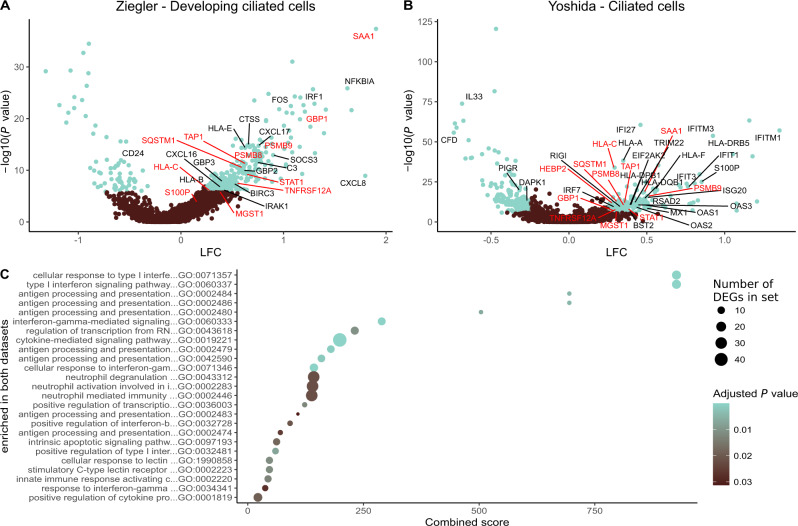
Despite intensive research since the emergence of SARS-CoV-2, it has remained unclear precisely which components of the early immune response protect against the development of severe COVID-19. Here, we perform a comprehensive immunogenetic and virologic analysis of nasopharyngeal and peripheral blood samples obtained during the acute phase of infection with SARS-CoV-2. We find that soluble and transcriptional markers of systemic inflammation peak during the first week after symptom onset and correlate directly with upper airways viral loads (UA-VLs), whereas the contemporaneous frequencies of circulating viral nucleocapsid (NC)-specific CD4+ and CD8+ T cells correlate inversely with various inflammatory markers and UA-VLs. In addition, we show that high frequencies of activated CD4+ and CD8+ T cells are present in acutely infected nasopharyngeal tissue, many of which express genes encoding various effector molecules, such as cytotoxic proteins and IFN-γ. The presence of IFNG mRNA-expressing CD4+ and CD8+ T cells in the infected epithelium is further linked with common patterns of gene expression among virus-susceptible target cells and better local control of SARS-CoV-2. Collectively, these results identify an immune correlate of protection against SARS-CoV-2, which could inform the development of more effective vaccines to combat the acute and chronic illnesses attributable to COVID-19.


Conflict of interest statement

The authors declare no competing interests.

Figures

Fig. 1
Fig. 1. Study overview, upper airways viral loads, and antibody-mediated neutralization of SARS-CoV-2.
a Schematic representation of the study design. Donors were sampled weekly for 1 month and then periodically until 6 months after initial presentation. b Longitudinal quantification of upper airways viral loads (UA-VLs) in patients with mild COVID-19 (n = 25) recruited during the first week after symptom onset. Each line represents one donor. The green scale stratifies patients according to days since symptom onset at presentation. c Pseudovirus neutralization titers (ID50) plotted versus days since symptom onset (DSO). Each dot represents one donor at one time point as follows: 0–7 DSO, n = 25; 8–14 DSO, n = 30; 15–21 DSO, n = 28; 22–28 DSO, n = 20; 29–35 DSO, n = 18; 36–52 DSO, n = 8; 53–95 DSO, n = 34; 144–219 DSO, n = 29. The cutoff is indicated by the dotted red line. Serum samples that did not achieve 50% neutralization (ID50 < 10) were assigned a value halfway below the lower limit of quantification (ID50 = 5). Data are shown as median ± IQR. Source data are provided as a source data file. Figure 1a was created with Biorender (publication licence number GL254AMU2N).
Fig. 2
Fig. 2. T cell responses against the nucleocapsid and spike proteins of SARS-CoV-2.
ad Representative flow cytometry plots showing the identification of IFN-γ+ CD4+ T cells in the absence of stimulation (a) or in the presence of overlapping nucleocapsid (NC) peptides (b), overlapping spike (S) peptides (c), or staphylococcal enterotoxin B (SEB) as the positive control (d). Plots are gated on CD3. Numbers indicate the percent frequency of CD4+ T cells that produced IFN-γ. e Responder frequencies for IFN-γ+ CD4+ and IFN-γ+ CD8+ T cells specific for NC or S, antibody titers against NC or S, and antibody-mediated neutralization of SARS-CoV-2 (HC, healthy control). f, g Area under the curve (AUC) per day comparisons of the overall magnitude of SARS-CoV-2-specific CD4+ versus CD8+ T cells (f) and the overall magnitude of SARS-CoV-2-specific CD4+ versus CD8+ T cells broken down by target protein (NC versus S). Each dot represents one donor. h Frequencies of all NC-specific T cells (left), NC-specific CD4+ T cells (middle), and NC-specific CD8+ T cells (right). Each dot represents one donor. The cutoff is indicated by the dotted red line. i Frequencies of all S-specific T cells (left), S-specific CD4+ T cells (middle), and S-specific CD8+ T cells (right). Each dot represents one donor. The cutoff is indicated by the dotted red line. Data are shown as median ± IQR (f, g, h, i). Sample sizes in (e, h, i): HC, n = 24; 1–7 DSO, n = 25; 8–14 DSO, n = 30; 15–21 DSO, n = 28; 22–28 DSO, n = 20; 29–35 DSO, n = 18; 36–52 DSO, n = 8; 53–95 DSO, n = 34; 144–219 DSO, n = 29. Sample size in (f, g): n = 37. P values in (f): ****P < 0.0001; (g): ***P = 0.0005, ****P < 0.0001; (h): NC-specific IFN-γ+ T cells: *P = 0.017, **P = 0.0032; NC-specific IFN-γ+ CD4+ T cells: **P = 0.0018, ***P = 0.0005; NC-specific IFN-γ+ CD8+ T cells: *P = 0.042; (i): S-specific IFN-γ+ T cells: *P = 0.038; S-specific IFN-γ+ CD4+ T cells: **P = 0.0063; S-specific IFN-γ+ CD8+ T cells: *P = 0.038, **P = 0.0085 (Mann–Whitney U test or Wilcoxon signed rank test, two-sided). Source data are provided as a source data file.
Fig. 3
Fig. 3. Nucleocapsid-specific T cell responses correlate inversely with upper airways viral loads and systemic markers of inflammation during acute infection with SARS-CoV-2.
a, b Spearman rank correlations showing upper airways viral loads (UA-VLs) versus the frequencies of all NC-specific T cells (left), NC-specific CD4+ T cells (middle), or NC-specific CD8+ T cells (right) (an = 25) and the frequencies of all S-specific T cells (left), S-specific CD4+ T cells (middle), or S-specific CD8+ T cells (right) (b, n = 25) during the first week after symptom onset. c Left: plasma concentrations of CXCL10 are shown for healthy controls (HCs, n = 17) and longitudinally for patients according to the number of days since symptom onset (1–7 DSO, n = 25; 8–21 DSO, n = 32; 53–95 DSO, n = 35). *P = 0.01, **P = 0.003, ***P = 0.0007 (Mann–Whitney U test, two-sided). The green scale stratifies patients according to days since symptom onset at presentation. Data are shown as median ± IQR. Middle and right: Spearman rank correlations showing plasma concentrations of CXCL10 during the first week after symptom onset versus UA-VLs (middle) and the frequencies of all NC-specific T cells (right). The gray bar indicates non-responders (right). Source data are provided as a source data file.
Fig. 4
Fig. 4. Gene expression profiles in immune cell subsets during acute infection with SARS-CoV-2.
RNA sequencing data were obtained from circulating CD4+ T cells (light blue), CD8+ T cells (dark blue), monocytes (light green), and NK cells (dark green) isolated during the first week after symptom onset (n = 14 patients with mild COVID-19). a Spearman rank correlations showing mean expression scores for OAS1 (left), STAT1 (middle), and EIF2AK2 (right) versus NC-specific IFN-γ+ CD4+ (squares) and NC-specific IFN-γ+ CD8+ T cell frequencies (triangles) and upper airways viral loads (circles, UA-VLs). Whiskers show 95% confidence intervals calculated using bootstrapping with replacement using sample numbers equal to the original dataset. Solid lines indicate significance. Dashed lines indicate correlation results below the threshold for significance. bd Spearman rank correlations showing mean pathway gene expression scores for CD4+ T cells versus NC-specific IFN-γ+ CD4+ T cell frequencies (b), CD8+ T cells versus NC-specific IFN-γ+ CD8+ T cell frequencies (c), and monocytes versus UA-VLs. Whiskers as in (a). Data are shown as r values with 95% confidence intervals. Black and light grey lines indicate significant and non-significant associations, respectively. Red lines indicate reference control r values derived from 30 or 300 random genes as shown. Colored squares indicate the pathway group (manual annotation). e Spearman rank correlations for all KEGG pathways in the categories Signal Transduction, Signaling Molecules and Interaction, Immune System, and Cell Growth and Death. Data are shown as z-normalized mean pathway expression scores. Patients were clustered by expression profile similarity. Pathways are shown for cell subsets with significant enrichment scores in patients versus healthy controls (top row, P < 0.05; exact P values are provided in Supplementary Tables 1–4). Source data are provided as a source data file.
Fig. 5
Fig. 5. The presence of T cells expressing mRNA encoding IFN-γ in the upper airways is linked with the upregulation of genes associated with antigen processing and presentation.
a, b Volcano plots showing DEGs (blue; Padj. < 0.05, absolute LFC > 0.25) among the biggest clusters of ciliated cells from responders in the primary (a) and secondary datasets (b). Genes annotated in red are significant in both datasets, and genes annotated in black are significant in one dataset. c Gene ontology (GO) terms enrichment plot for pathways significantly enriched in both datasets (Padj. < 0.05). Dot size represents the average number of significant DEGs that contributed to the term, and dot color represents the adjusted P value (Padj.). X-axis shows combined scores as reported by enrichR. Source data are provided as supplementary datasets.

References

    1. Baden LR, et al. Efficacy and safety of the mRNA-1273 SARS-CoV-2 vaccine. New Engl. J. Med. 2020;384:403–416. doi: 10.1056/NEJMoa2035389. - DOI - PMC - PubMed
    1. Polack FP, et al. Safety and efficacy of the BNT162b2 mRNA Covid-19 vaccine. New Engl. J. Med. 2020;383:2603–2615. doi: 10.1056/NEJMoa2034577. - DOI - PMC - PubMed
    1. Gilbert, P. B. et al. Immune correlates analysis of the mRNA-1273 COVID-19 vaccine efficacy clinical trial. Science375, 43–50 (2022). - PMC - PubMed
    1. Sadoff J, et al. Final analysis of efficacy and safety of single-dose Ad26.COV2.S. New Engl. J. Med. 2022;386:847–860. doi: 10.1056/NEJMoa2117608. - DOI - PMC - PubMed
    1. Voysey M, et al. Safety and efficacy of the ChAdOx1 nCoV-19 vaccine (AZD1222) against SARS-CoV-2: an interim analysis of four randomised controlled trials in Brazil, South Africa, and the UK. Lancet. 2021;397:99–111. doi: 10.1016/S0140-6736(20)32661-1. - DOI - PMC - PubMed

Publication types