. 2023 May 24;14(5):340.
doi: 10.1038/s41419-023-05859-0.

Chemotherapy impairs ovarian function through excessive ROS-induced ferroptosis

Affiliations

Chemotherapy impairs ovarian function through excessive ROS-induced ferroptosis

Shenghui Zhang et al. Cell Death Dis. .

Abstract

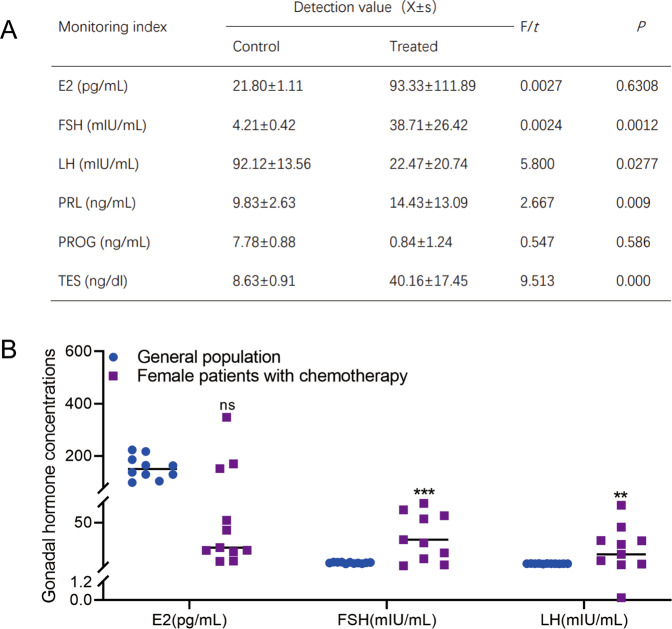
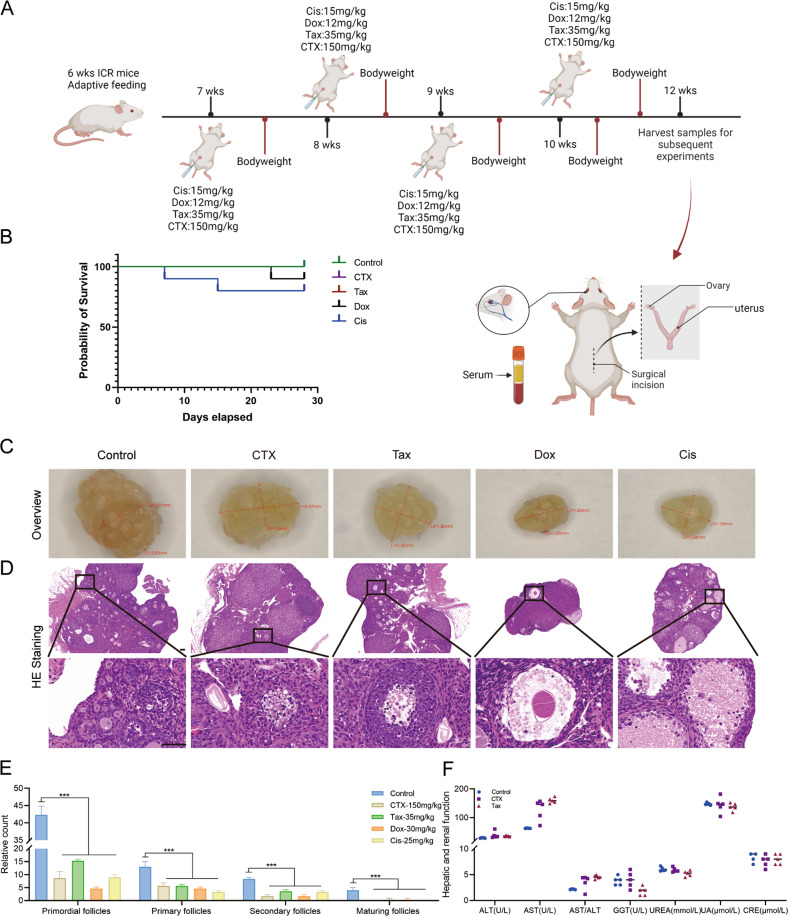
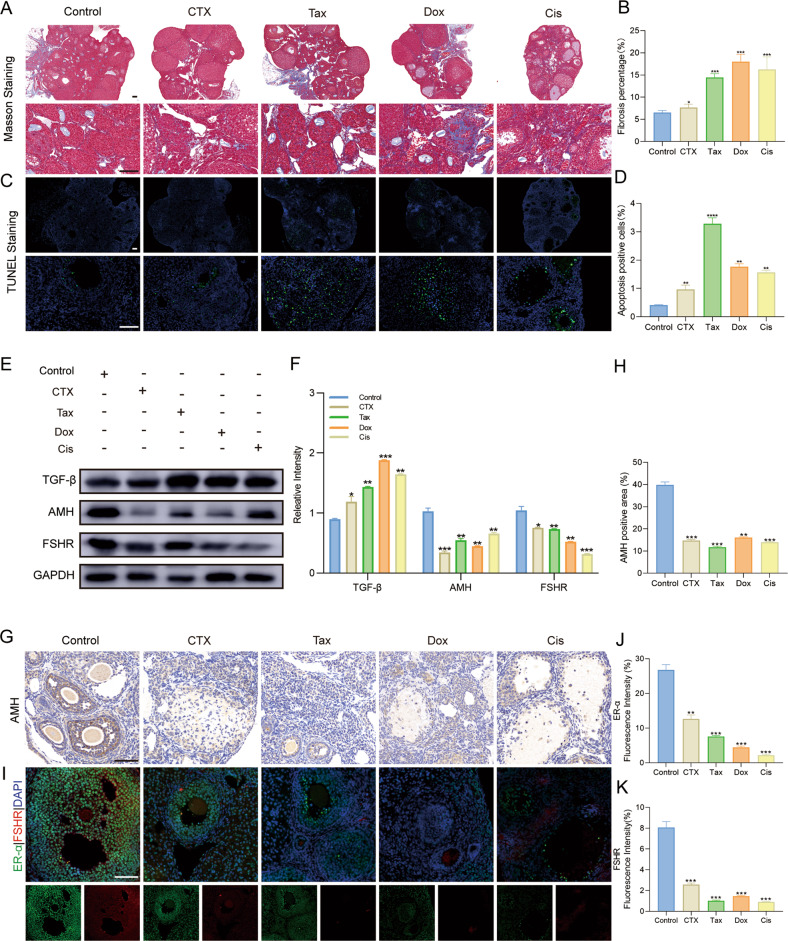
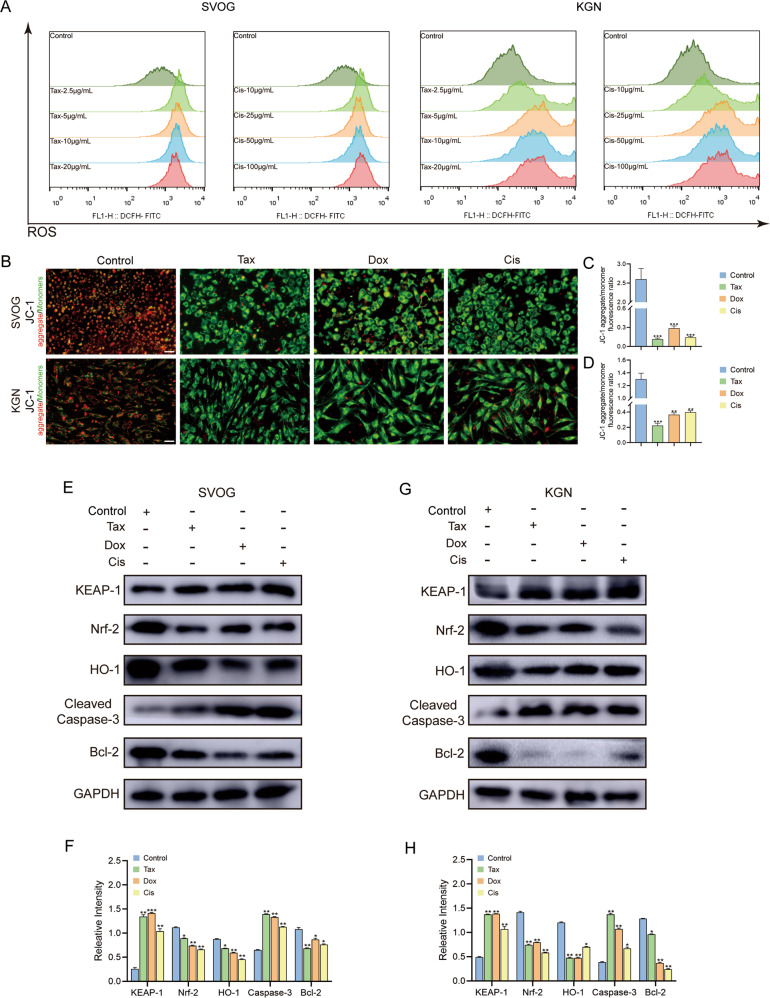
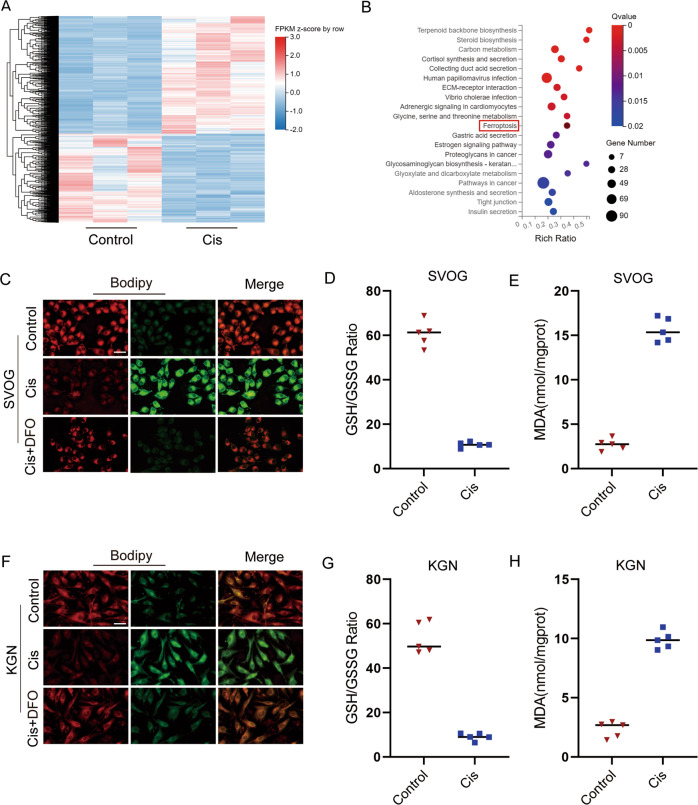
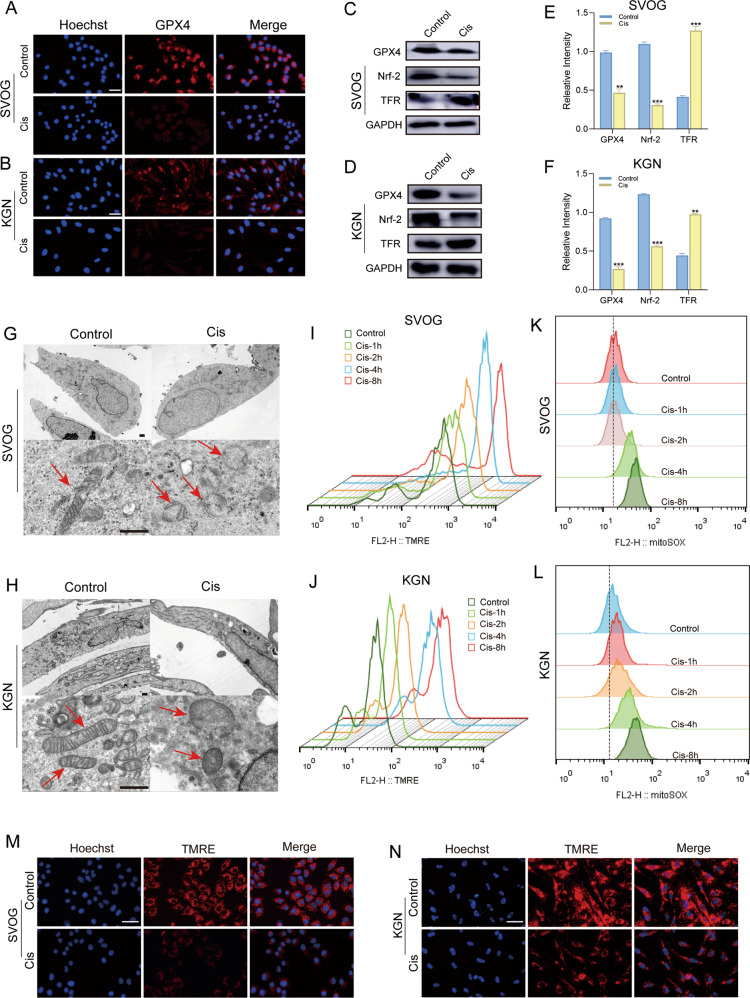
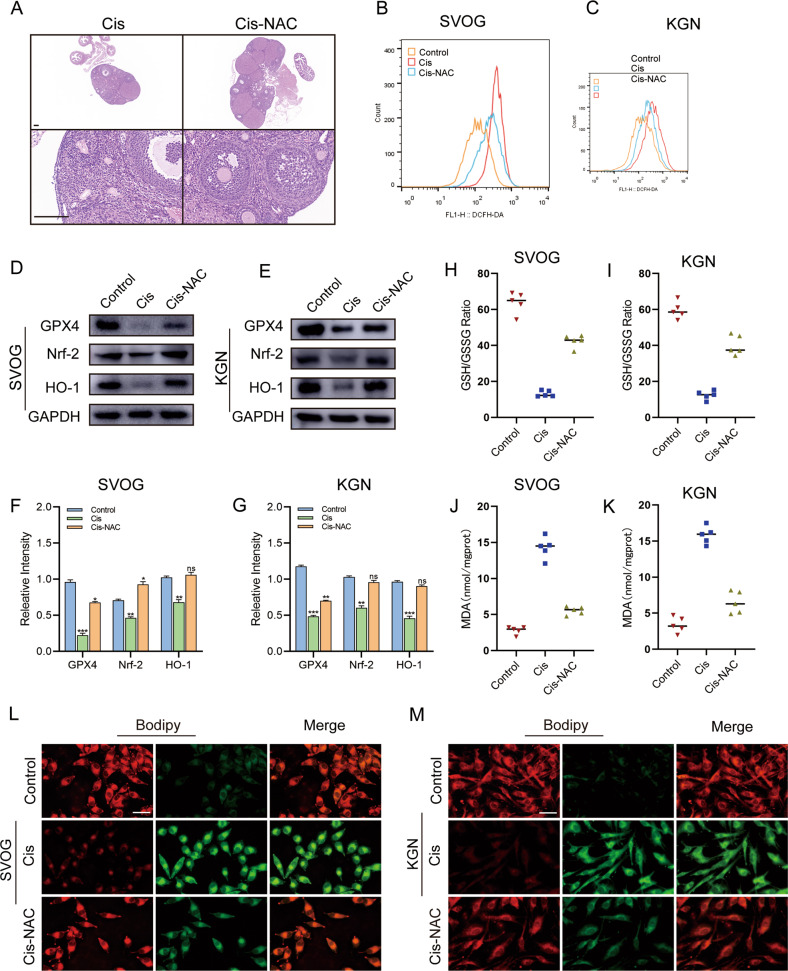
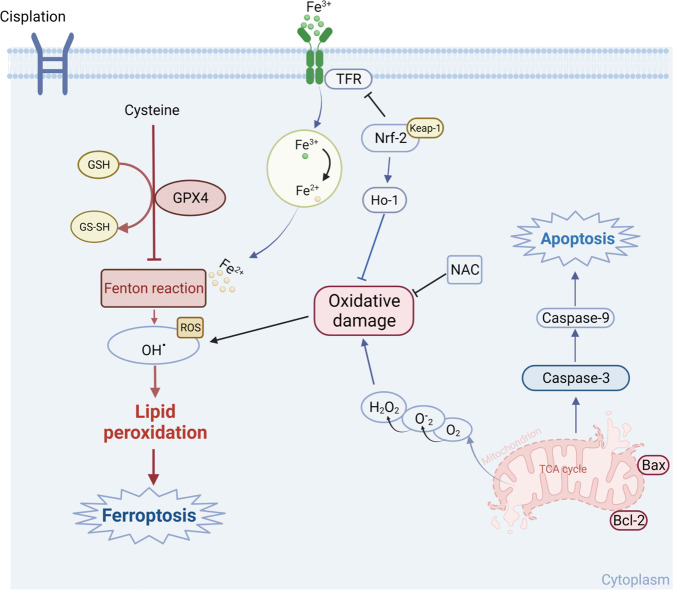
Chemotherapy was conventionally applied to kill cancer cells, but regrettably, they also induce damage to normal cells with high-proliferative capacity resulting in cardiotoxicity, nephrotoxicity, peripheral nerve toxicity, and ovarian toxicity. Of these, chemotherapy-induced ovarian damages mainly include but are not limited to decreased ovarian reserve, infertility, and ovarian atrophy. Therefore, exploring the underlying mechanism of chemotherapeutic drug-induced ovarian damage will pave the way to develop fertility-protective adjuvants for female patients during conventional cancer treatment. Herein, we firstly confirmed the abnormal gonadal hormone levels in patients who received chemotherapy and further found that conventional chemotherapeutic drugs (cyclophosphamide, CTX; paclitaxel, Tax; doxorubicin, Dox and cisplatin, Cis) treatment significantly decreased both the ovarian volume of mice and the number of primordial and antral follicles and accompanied with the ovarian fibrosis and reduced ovarian reserve in animal models. Subsequently, Tax, Dox, and Cis treatment can induce the apoptosis of ovarian granulosa cells (GCs), likely resulting from excessive reactive oxygen species (ROS) production-induced oxidative damage and impaired cellular anti-oxidative capacity. Thirdly, the following experiments demonstrated that Cis treatment could induce mitochondrial dysfunction through overproducing superoxide in GCs and trigger lipid peroxidation leading to ferroptosis, first reported in chemotherapy-induced ovarian damage. In addition, N-acetylcysteine (NAC) treatment could alleviate the Cis-induced toxicity in GCs by downregulating cellular ROS levels and enhancing the anti-oxidative capacity (promoting the expression of glutathione peroxidase, GPX4; nuclear factor erythroid 2-related factor 2, Nrf2 and heme oxygenase-1, HO-1). Our study confirmed the chemotherapy-induced chaotic hormonal state and ovarian damage in preclinical and clinical examination and indicated that chemotherapeutic drugs initiated ferroptosis in ovarian cells through excessive ROS-induced lipid peroxidation and mitochondrial dysfunction, leading to ovarian cell death. Consequently, developing fertility protectants from the chemotherapy-induced oxidative stress and ferroptosis perspective will ameliorate ovarian damage and further improve the life quality of cancer patients.


Conflict of interest statement

The authors declare no competing interests.

Figures

Fig. 1
Fig. 1. Abnormal gonadal hormone levels in chemotherapy patients.
A, B FSH, E2, and LH levels of chemotherapy patients were determined using chemiluminescence.
Fig. 2
Fig. 2. Chemotherapeutic agents induced acute ovarian injury.
A The flowchart of the experimental procedure. The mice in each group received CTX, Tax, Dox, or Cis, respectively, once a week for four consecutive 4 weeks from 7 to 10 weeks. All mice were sacrificed at 12 week-age. n = 10 mice/group. B Kaplan–Meier survival curves were used to record the survival of the mice during the agent administration. C The ovarian macrostructure was observed under visible light. D Representative images of H&E staining of ovarian micromorphology after treatment with chemotherapeutic agents. Scale bars = 100 μm. n = 5 (independent experiments). E The quantities of primordial, primary, secondary, and maturing follicles per slide in each group were analyzed. n = 5 (independent experiments). F Conventional biochemical methods were used to detect the activity of levels of ALT, AST, GGT UREA, UA, and CRE in the serum of mice. n = 5 (independent experiments). ***p < 0.001.
Fig. 3
Fig. 3. Chemotherapeutic agents induced serious ovarian dysfunction.
A, B Representative images of Masson staining were exhibited to indicate the ovarian stroma fibrosis in mice after treatment with chemotherapeutic agents (A) and the further quantification in each group (B). Scale bar =100 μm. n = 5 (independent experiments). C, D Representative images of TUNEL staining in the ovaries of mice were shown (C), and the ratio of apoptotic cells was quantified (D). Scale bar =100 μm. n = 5 (independent experiments). E, F Expressions of TGF-β, AMH, and FSHR were determined by the Western blot in the ovaries (E) and further quantified with Image J software (F). GAPDH was used as the internal control. n = 3 (independent experiments). G, H Representative immunohistochemistry images for AMH (G) and further semi-quantitative comparisons among the five groups (H) were shown. Scale bar = 100 μm. n = 3 (independent experiments). IK Representative photographs of immunofluorescence (I) and semi-quantitative comparisons were shown among the five groups for ER-α (green) (J) and FSHR (red) (K). Scale bar = 100 μm. n = 3 (independent experiments). *p < 0.05, **p < 0.01, ***p < 0.001.
Fig. 4
Fig. 4. Chemotherapeutic agents induced apoptosis of ovarian GCs through oxidative stress.
A ROS assay to evaluate the intracellular ROS levels of SVOG and KGN cells after Tax (0, 2.5, 5, 10, 20 μg/ml) or Cis (0, 10, 25, 50, 100 μg/ml) treatments for 24 h. BD SVOG and KGN cells were treated with Tax (5 μg/ml), Dox (10 μg/ml), or Cis (25 μg/ml) for 24 h and then stained with JC-1 (red for aggregate, green for monomer). Scale bar = 10 μm. The JC-1 aggregate/monomer fluorescence ratio was quantified for SVOG (C) and KGN (D) cells. n = 3 (independent experiments). E, G The protein levels of KEAP-1, Nrf-2, HO-1, Cleaved Caspase-3, and Bcl-2 were examined using Western blot analysis in SVOG (E) and KGN (G) cells. F, H Quantitative analysis of the targeted protein expressions. n = 3 (independent experiments). *p < 0.05, **p < 0.01, ***p < 0.001.
Fig. 5
Fig. 5. Ferroptosis is involved in Cis-induced ovarian injury.
A. Heatmap indicated that 2584 genes were identified with significant expression change (2 fold with adjusted P < 0.05) after Cis-treated mice. n = 3 (independent experiments). B Differential pathways enriched in ovaries of Control and Cis-treated mice by KEGG. n = 3 (independent experiments). C, F Representative images of BODIPY staining indicated lipid ROS level after Cis (25 μg/ml) or Cis (25 μg/ml) + DFO (100 μM) treatments (red for reduction, green for oxidization) in SVOG (C) and KGN (F) cells. Scale bar = 10 μm. n = 3 (independent experiments). D, G The ratio of Intracellular GSH/GSSG was assayed after Cis (25 μg/ml) treatment for 24 h in SVOG (D) and KGN (G) cells. n = 5 (independent experiments). E, H Intracellular MDA were assayed after Cis (25 μg/ml) treatment for 24 h in SVOG (E) and KGN (H) cells. n = 5 (independent experiments).
Fig. 6
Fig. 6. Cis-induced ferroptosis through mitochondrial dysfunction and impaired antioxidant capacity.
A, B Assessment of GPX4 expression in SVOG (A) and KGN (B) cells treated with Cis (25 μg/ml) for 24 h. Scale bar = 10 μm. C, D The protein levels of GPX4, Nrf-2, and TFR were examined using Western blot analysis in SVOG (C) and KGN (D) cells treated with Cis (25 μg/ml) for 24 h. E, F Quantitative analysis of the targeted protein expressions. n = 3 (independent experiments). *p < 0.05, **p < 0.01, ***p < 0.001. G, H Representative cell and mitochondrial ultrastructural images of SVOG (G) and KGN (H) cells exposed to Cis (25 μg/ml) for 24 h. Scale bar = 5 μm. I, J TMRE assay to evaluate the MMP levels of SVOG (I) and KGN (J) cells after Cis (25 μg/ml) treatment for 1, 2, 4, and 8 h by flow cytometry. K, L MitoSOX assay to evaluate mitochondrial ROS levels of SVOG (K) and KGN (L) cells after Cis (25 μg/ml) treatment for 1, 2, 4, 8 h by flow cytometry. M, N Representative images of TMRE staining indicated MMP levels of SVOG (M) and KGN (N) cells after Cis (25 μg/ml) treatment for 24 h. **p < 0.01, ***p < 0.001.
Fig. 7
Fig. 7. NAC inhibited ferroptosis by enhancing antioxidant capacity.
A Representative images of H&E staining of ovarian micromorphology of mice after treatment with Cis or Cis + NAC. Scale bars = 200 μm. n = 5 (independent experiments). B, C ROS assay to evaluate the intracellular ROS levels of SVOG and KGN cells after Cis (25 μg/ml) or Cis +NAC (5 mM) treatments for 24 h. D, E The protein levels of GPX4, Nrf-2, and HO-1 were examined using Western blot analysis in SVOG (D) and KGN (E) cells treated with Cis (25 μg/ml) or Cis +NAC (5 mM) for 24 h. F, G Quantitative analysis of the targeted protein expressions. n = 3 (independent experiments). H, I The ratio of Intracellular GSH/GSSG was assayed after Cis (25 μg/ml) or Cis +NAC (5 mM) treatment for 24 h in SVOG (H) and KGN (I) cells. n = 5 (independent experiments). J, K Intracellular MDA were assayed after Cis (25 μg/ml) or Cis +NAC (5 mM) treatment for 24 h in SVOG (J) and KGN (K) cells. n = 5 (independent experiments). L, M Representative images of BODIPY staining indicated lipid ROS level after Cis (25 μg/ml) or Cis + NAC (5 mM) treatments (red for reduction, green for oxidization) in SVOG (L) and KGN (M) cells. Scale bar = 10 μm. n = 3 (independent experiments). *p < 0.05, **p < 0.01, ***p < 0.001. NS: not significant.
Fig. 8
Fig. 8. Potential mechanism by which Cis exacerbates ovarian GCs death.
Exposed to Cis leads to ovarian GCs ferroptosis and apoptosis. Cis induces mitochondrial dysfunction and downregulates the expression of GPX4 in ovarian GCs, leading to excessive ROS production and upregulation of apoptosis-related factors. The excessive intracellular ROS combines with Fe2+ to initiate the Fenton reaction, thereby inducing cell ferroptosis. NAC rescues Cis-induced cell death by reducing excessive ROS levels and enhancing antioxidant capacity.

References

    1. Long JP, Wan F, Zhang F, Zhou J, Don LF. DTC chemotherapy regimen is associated with higher incidence of premature ovarian failure in women of reproductive age with breast cancer. Eur Rev Med Pharm Sci. 2016;20:1087–92. - PubMed
    1. Shai D, Aviel-Ronen S, Spector I, Raanani H, Shapira M, Gat I, et al. Ovaries of patients recently treated with alkylating agent chemotherapy indicate the presence of acute follicle activation, elucidating its role among other proposed mechanisms of follicle loss. Fertil Steril. 2021;115:1239–49. doi: 10.1016/j.fertnstert.2020.11.040. - DOI - PubMed
    1. Petrek JA, Naughton MJ, Case LD, Paskett ED, Naftalis EZ, Singletary SE, et al. Incidence, time course, and determinants of menstrual bleeding after breast cancer treatment: a prospective study. J Clin Oncol. 2006;24:1045–51. doi: 10.1200/JCO.2005.03.3969. - DOI - PubMed
    1. McLaughlin M, Kelsey TW, Wallace WH, Anderson RA, Telfer EE. Non-growing follicle density is increased following adriamycin, bleomycin, vinblastine and dacarbazine (ABVD) chemotherapy in the adult human ovary. Hum Reprod. 2017;32:165–74. - PubMed
    1. Meissner J, Tichy D, Katzke V, Kuhn T, Dietrich S, Schmitt T, et al. Long-term ovarian function in women treated with CHOP or CHOP plus etoposide for aggressive lymphoma. Ann Oncol. 2015;26:1771–6. doi: 10.1093/annonc/mdv227. - DOI - PubMed

Publication types

Substances