. 2023 May 24;14(1):2847.
doi: 10.1038/s41467-023-38501-w.

Phospholipase D3 degrades mitochondrial DNA to regulate nucleotide signaling and APP metabolism

Affiliations

Phospholipase D3 degrades mitochondrial DNA to regulate nucleotide signaling and APP metabolism

Zoë P Van Acker et al. Nat Commun. .

Abstract

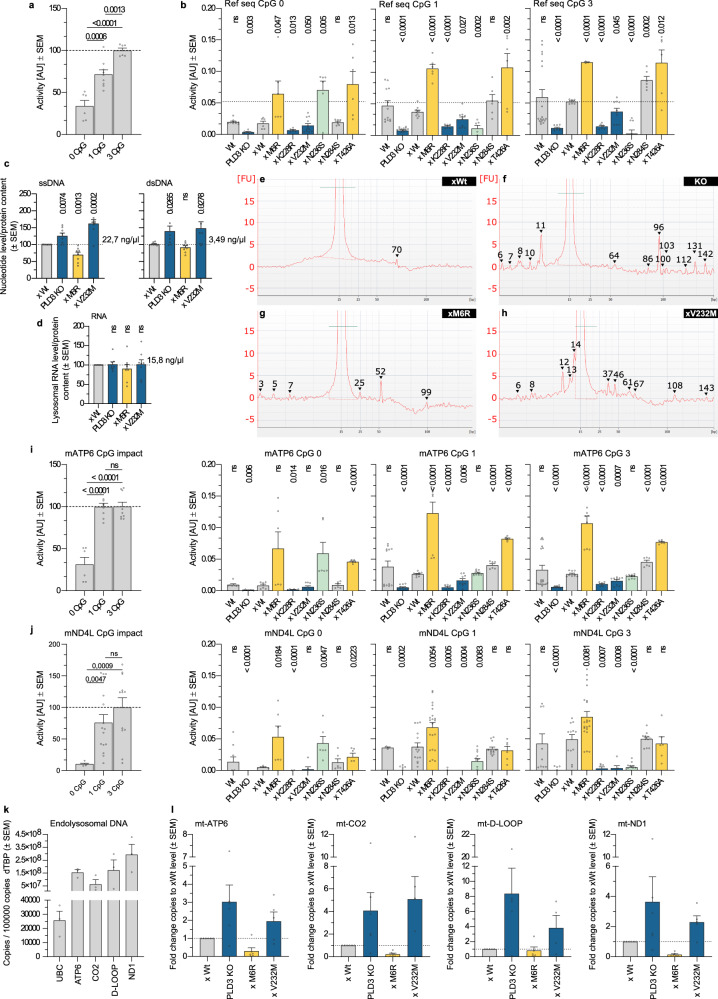
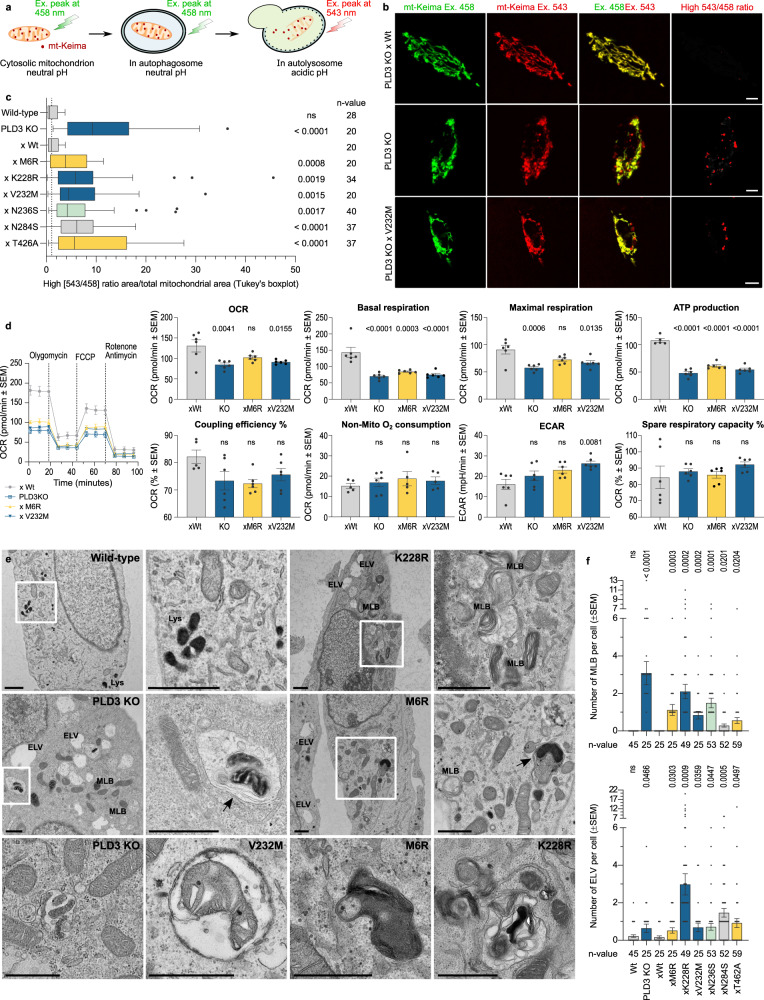
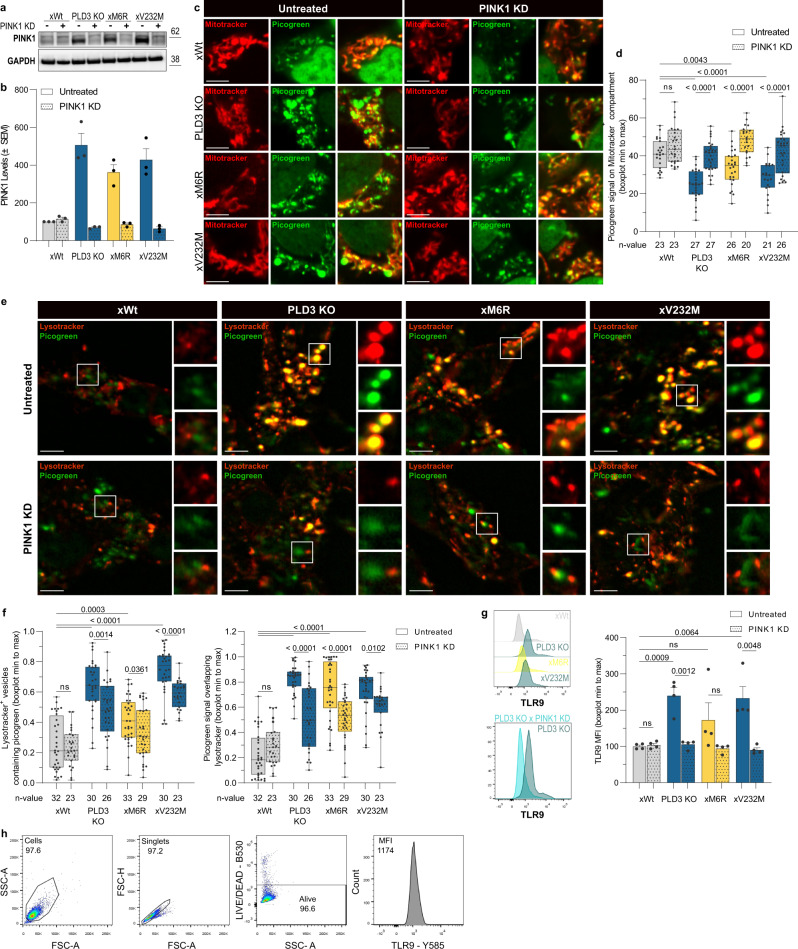
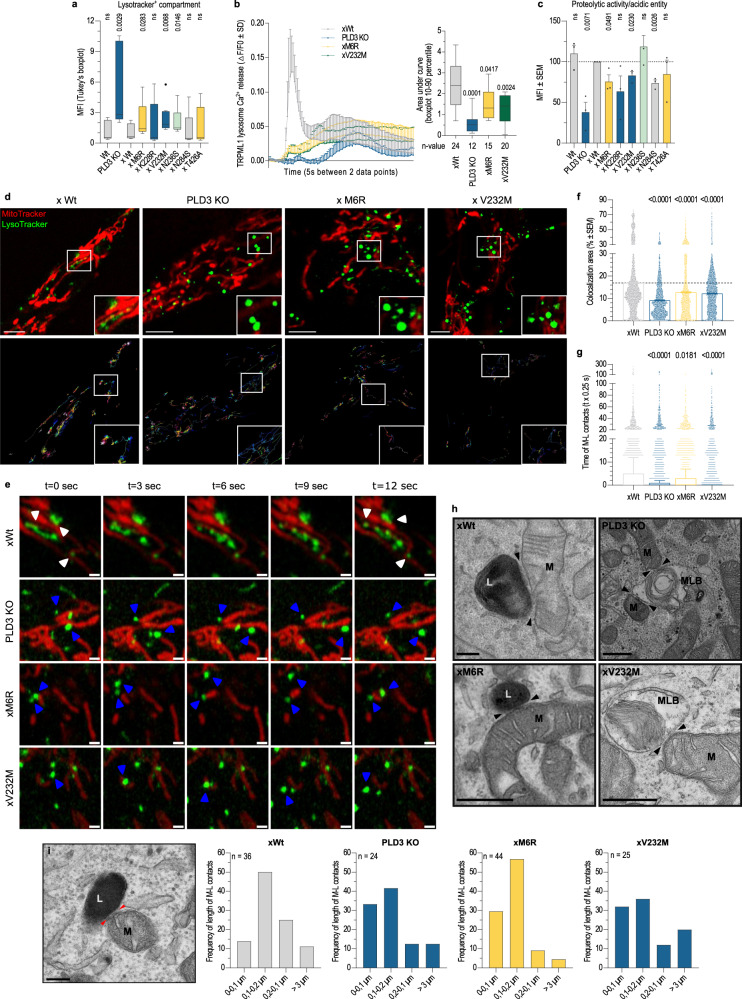
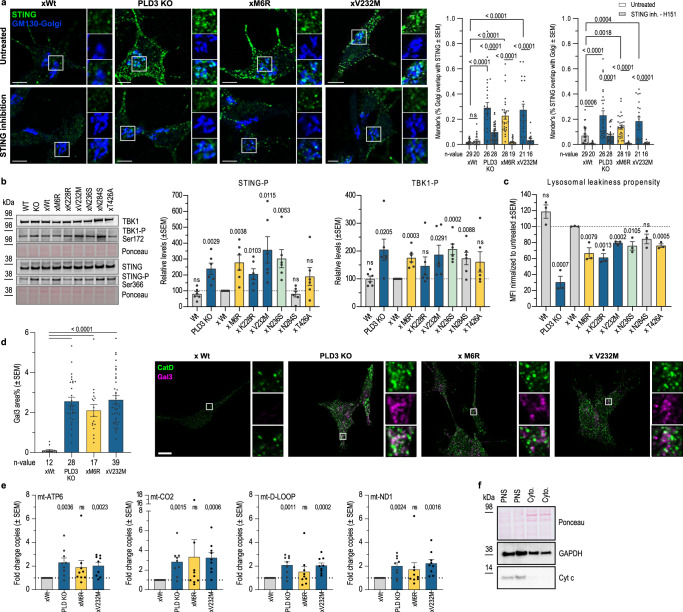
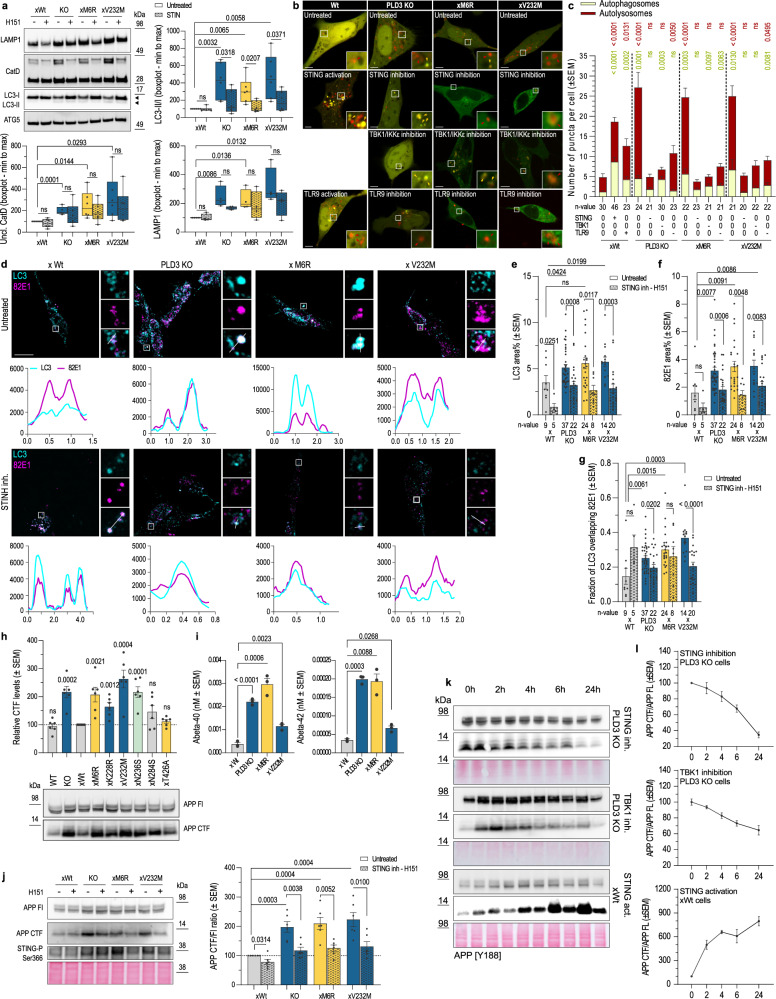
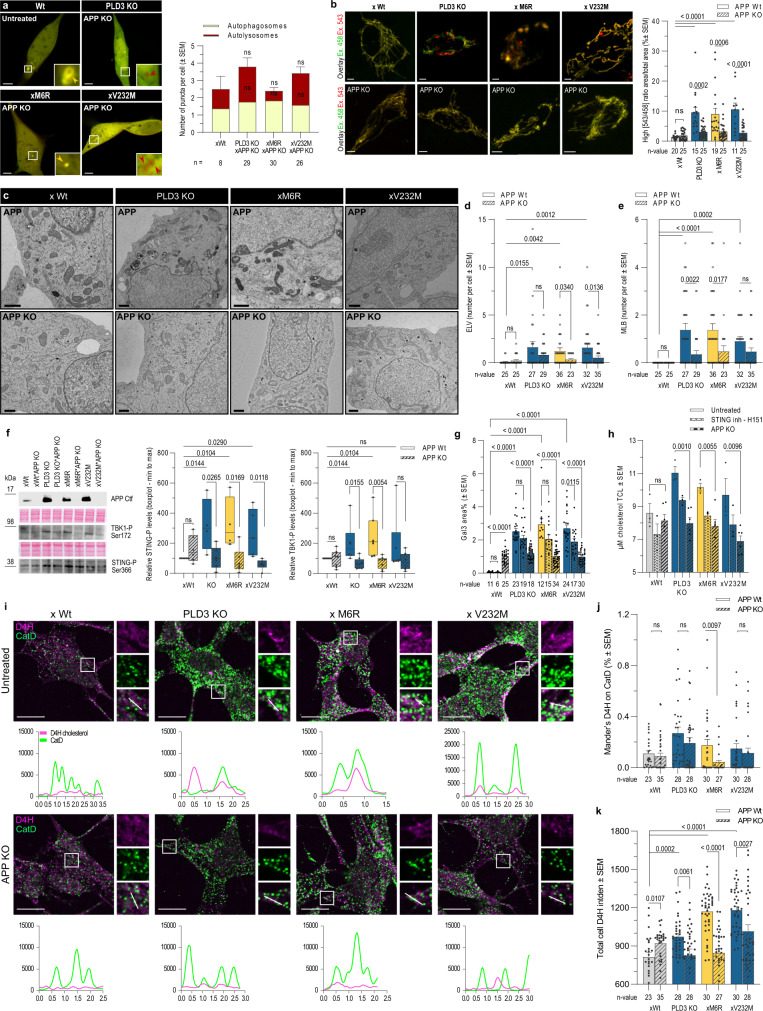
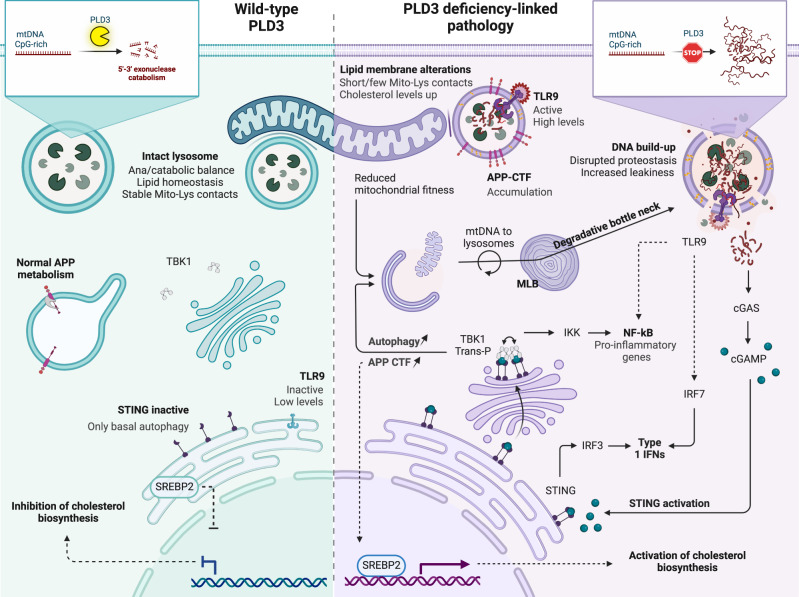
Phospholipase D3 (PLD3) polymorphisms are linked to late-onset Alzheimer's disease (LOAD). Being a lysosomal 5'-3' exonuclease, its neuronal substrates remained unknown as well as how a defective lysosomal nucleotide catabolism connects to AD-proteinopathy. We identified mitochondrial DNA (mtDNA) as a major physiological substrate and show its manifest build-up in lysosomes of PLD3-defective cells. mtDNA accretion creates a degradative (proteolytic) bottleneck that presents at the ultrastructural level as a marked abundance of multilamellar bodies, often containing mitochondrial remnants, which correlates with increased PINK1-dependent mitophagy. Lysosomal leakage of mtDNA to the cytosol activates cGAS-STING signaling that upregulates autophagy and induces amyloid precursor C-terminal fragment (APP-CTF) and cholesterol accumulation. STING inhibition largely normalizes APP-CTF levels, whereas an APP knockout in PLD3-deficient backgrounds lowers STING activation and normalizes cholesterol biosynthesis. Collectively, we demonstrate molecular cross-talks through feedforward loops between lysosomal nucleotide turnover, cGAS-STING and APP metabolism that, when dysregulated, result in neuronal endolysosomal demise as observed in LOAD.


Conflict of interest statement

The authors declare no competing interests.

Figures

Fig. 1
Fig. 1. PLD3’s exonuclease function impacts the endolysosomal nucleotide content.
a, b End-labeled fluorescence-quenched oligonucleotide (EFQO) assay for exonuclease activity analysis. a Lysates (500 ng/µL) of PLD3 KO cells rescued with wild-type PLD3 were incubated at 37 °C (pH 5) with a 30 nucleotide long oligo of a random sequence that was taken from ref. . The impact of the CpG-content was investigated by reducing the original 3xCpG content; CpGs in the sequence were adapted to TpG. The mean values of biologically independent samples are represented in the bar graphs. Statistical analysis was performed with two-tailed, unpaired t-tests. b Analysis of the different SNP lines as in a. c, d Lysosomal nucleotide content as measured on a Qubit fluorometer. Statistical analysis was performed with two-tailed, unpaired t-tests. (n = 8). eh Electropherograms of the endolysosomal DNA content of e xWt, f PLD3 KO, g xM6R, and h xV232M cells. Standard: the small molecular weight marker measures 15 bp. f The peak of 96 bp amounts to 0.81 ng/µl, while h the 37 and 46 bp peaks amount to 0.09 and 0.07 ng/µl, respectively. i, j EFQO analysis on 30 nucleotides long part of the i mATP-6 and j mND4L sequence, each of which contains three CpGs. Substrates’ original 3xCpG content was reduced by T substitution and the assay was run in triplicate. Statistical analysis was performed with two-tailed, unpaired t-tests. k, l Quantitative PCR levels of mitochondrial mtDNA genes (ATP6, CO2, D-Loop, and ND1) and nuclear UBC in total DNA extracts from endolysosomal isolates (k: n = 3, l: n for xV232M = 5 and n for xWt/PLD3 KO/xM6R = 6 biological repeats). Source data are provided as a Source Data file.
Fig. 2
Fig. 2. Mitochondrial fitness and clearance are disrupted by PLD3 dysfunction.
a Schematic representation of Mt-Keima, showing a pH-dependent shift in fluorescence excitation that can be imaged in two channels. b Representative confocal images of SH-SY5Y PLD3 cell models. Scale bar = 5 µm. c Tukey’s boxplot (first to third quartile box with the median as a horizontal line) showing the index of mitophagy, which was calculated as the parameter: high [543/458] ratio area/total mitochondrial area (n = 20–40). Two-tailed, unpaired t-tests were used for statistical testing. Differences with the wild-type rescue condition are indicated. d Mitochondrial bioenergetic profiles were obtained with the Seahorse XFp Cell Mito Stress test, including oxygen consumption rate (OCR) and extracellular acidification rate (ECAR). An ordinary one-way ANOVA with Bonferroni’s multiple comparisons test was used for statistical testing (n = 6; columns show mean values ± SEM). e Representative EM images of PLD3 KO and SNP variant-rescued SH-SY5Y cells showing an aberrant accumulation of degradative organelles, including MLBs and autophagosomes/autophagolysosomes, often with remnants of mitochondria. ELV electron-lucent vesicles, MLB multilamellar bodies. Scale bar is 1 µm. f Quantification of the number of MLB and ELV per cell in two PLD3 clonal knockout lines, of which results were pooled together. Statistical significance was tested in comparison to the wild-type rescue values using a two-tailed, unpaired t-test (n = 25–59). Source data are provided as a Source Data file.
Fig. 3
Fig. 3. PINK1-linked mitophagy delivers PLD3 substrates to lysosomes that cause a DNA build-up upon PLD3 dysfunction.
a Protein levels of PINK1, quantified in (b). PINK1 knockdown (KD) reduced PINK1 levels to baseline 24 h after transfection (n = 3; mean values ± SEM). c Representative images of mitotracker (mitochondria, red) — picogreen (ds/mtDNA, green) co-localizations. d Min to max boxplots (median as the center, the box extends from the 25th to 75th percentiles, and whiskers range from the smallest to the greatest value) depict the fraction of picogreen overlapping with mitotracker signal (n = 20–27). e Representative images of lysotracker (acidic compartment, red) — picogreen (ds/mtDNA, green) co-localizations. Scale bar = 5 µm in all cases. f Min to max boxplots show the quantification of the fraction of overlap between the lysotracker and picogreen signal, using Manders’ coefficients (n = 23–33). g Intracellular flow cytometry of TLR9 levels. The stopping gate was set at 10,000 events (n = 4). All statistical differences were calculated using unpaired t-tests as indicated. h Gating strategy of panel g. Source data are provided as a Source Data file.
Fig. 4
Fig. 4. PLD3-linked mitophagic problems are routed in a dysfunctional EL catabolic activity and reinforced by less stable lysosome-mitochondria membrane contact-site interactions.
a Flow-cytometric analysis of the acidic compartment, stained with 50 nM LysoTracker green (Tukey’s boxplot—first to third quartile box with the median as a horizontal line, n = 11). b Lysosomal Ca2+ response elicited with 20 µM of TRPML1 activator ML-SA1 was measured in Fura-2-AM loaded cells. Main panel: mean lysosomal Ca2+ response with SD error bars. Inset: quantification of individual Ca2+ responses (10–90 percentile box, showing the median as center and whiskers at the tenth and ninetieth percentiles; n = 12–24; two-tailed, unpaired t-tests with xWt condition). c Flow-cytometric analysis of the acidic compartment, stained with 10 µg/ml DQ-Red BSA and 50 nM LysoTracker green (n = 3). Two-tailed, unpaired t-testing was used for statistical testing with the wild-type rescue condition as a baseline. d Representative images of LE-mitochondria co-localizations (upper panel) and track dynamics (lower panel). Scale bar is 5 µm. e Lysosome-mitochondria contact tethering. Airyscan time-lapse images of stable (white arrow) and more transient (blue arrow) contacts in live SH-SY5Y cells. f Bar graphs showing the mean percentage overlap between lysosomes and mitochondria and g Tukey’s boxplot (first to third quartile box with the median as a horizontal line) depicting their contact duration. f, g Two-tailed, unpaired t-tests were used for statistical testing (individual contacts analyzed in n = 15, 16, 17, and 16 cells —xWt, PLD3 KO, xM6R, and xV232M— over t = 125 s). h Characteristic electron microscopy images of close contacts between mitochondria (M) and degradative vesicles, i.e., lysosomes (L) and multilamellar bodies (MLB). Scale bar = 500 nm. Two independent sample preps from two PLD3 clonal lines were analyzed per genotype. i Quantification of the fraction of contacts with a specific length range (n = 25–55); the length of which was measured as indicated by the red arrows on the representative image. Scale bar = 200 nm. Source data are provided as a Source Data file.
Fig. 5
Fig. 5. The PLD3-linked affected DNA catabolism impacts lysosomal integrity with subsequent STING activation.
a STING’s activity-dependent clustering and relocalization to the Golgi complex was analyzed with the JaCoP2 Plugin of FIJI Image J and validated using a 5 h treatment with 1 µM H151 STING inhibitor. The scatter plots show Manders’ co-localization coefficients. Statistical significance was calculated using two-tailed, unpaired t-tests (n = 16–29). Scale bar = 5 µm. b Western blot analysis of STING signaling markers; i.e., TBK1 autophosphorylation at Ser172 and TBK1-induced STING phosphorylation of Ser366 of the STING C-terminal tail, which provides the docking site for IRF3 (n = 6). Two-tailed, unpaired t-testing was used for statistical testing with the wild-type rescue condition as a baseline. c Flow-cytometric analysis of the lysosomal permeability propensity, induced by the membrane destabilizing agent LLOMe (1 mM, 10 min). The stopping gate was set at 10,000 events (n = 3). Two-tailed, unpaired t-tests were used for statistical testing. d Quantification of Gal3 levels on confocal images (n = 12–39). Scale bar = 10 µm. Statistical significance was calculated using two-tailed, unpaired t-tests. e Quantitative PCR levels of mitochondrial mtDNA genes (ATP6, CO2, D-Loop, and ND1) in cytosolic extracts (mean of n = 9 biological repeats; unpaired t-testing shown to the xWt level), of which the purity was checked on f western blot. Source data are provided as a Source Data file.
Fig. 6
Fig. 6. cGAS-STING activation-linked autophagy connects PLD3 dysfunction with APP metabolism.
a Western blot analysis showing the rescue of 5 h H151-STING inhibition on PLD3-linked endolysosomal pathology. Statistical significance on boxplots (min to max; median as the center, the box extends from the 25th to 75th percentiles, and whiskers range from the smallest to the greatest value) was calculated using two-tailed, unpaired t-tests (n = 6). b Representative airyscan images of autophagosome/-lysosome puncta, using mCherry-GFP-LC3 in untreated SH-SY5Y or treated 5 h with 1 µM H151 STING inhibitor, 2 µg/mL cGAMP STING-ligand, 1 µM TBK1/IKKε inhibitor, or 2.5 µM TLR9-ligand or -inhibitor. Scale bar = 5 µm. c Quantification of b. Activation and inhibition are indicated as + and −, respectively. Two-tailed, unpaired t-tests with the xWt untreated baseline condition are indicated for both autophagosome and –lysosome counts (specific n-values are listed on the graph). d Up: representative images of PLD3 SH-SY5Y models stained for LC3 (cyan) and APP-CTF (82E1 antibody, magenta). Scale bar = 10 µm. Down: Colocalization analysis using line intensity profiles. eg Quantification of d using Manders’ coefficient and area volume (n = 5–37). Statistical differences were calculated using two-tailed, unpaired t-tests. h Western blot showing APP fragment build-up. Statistical deviation from WT-rescue was calculated with unpaired t-tests (n = 6). i Secreted Aβ40 and −42 in 72-h-conditioned medium from SH-SY5Y (n = 3). Two-tailed, unpaired t-tests were used for statistical testing. j Left: a representative blot on the rescue effect of 5 h of STING inhibition on APP-CTF levels. Right: statistical significance was calculated using two-tailed, unpaired t-tests (n = 6). k STING activation induces APP-CTF increases in xWt cells, while its inhibition as well as of downstream TBK1, rescues PLD3-linked APP-CTF increases in PLD3 KO cells. l Quantifications of k (n cGAMP = 3, n H151 and TBK1 inh = 4). Source data are provided as a Source Data file.
Fig. 7
Fig. 7. APP depletion and STING inhibition ameliorate endolysosomal pathology upon PLD3 dysfunction.
a Representative airyscan images of autophagosome/-lysosome puncta as in Fig. 6b, using SH-SY5Y knocked out for APP. These show LC3 puncta levels indistinguishable from xWt levels. Scale bar = 5 µm. Statistical significance was calculated using two-tailed, unpaired t-tests (specific n-values are listed on the graph). b The index of mitophagy in APP KO cells was calculated using mt-Keima (scale bar = 5 µm). The graph shows a high [543/458] ratio area/total mitochondrial area. An ordinary one-way ANOVA with Bonferroni’s multiple comparisons test was used (n = 11–25). c Representative transmission electron microscopy (TEM) images showing a rescue effect of an APP KO in a PLD3 dysfunction background. Counts of d electron-lucent vesicles (ELV) and e multilamellar bodies (MLB) per cell as identified on TEM images (n = 25–36). Scale bar = 1 µm. Two-tailed, unpaired t-tests were used for statistical testing. f APP knockout double transgenics were analyzed on western blot for STING activation (n = 6) and TBK1 autophosphorylation at Ser172 (n = 8). Statistical differences were calculated using two-tailed, unpaired t-tests and depicted on boxplots (min to max; median as the center, the box extends from the 25th to 75th percentiles, and whiskers range from the smallest to the greatest value). g Quantification of Gal3 levels on confocal images (n = 6–34). Statistical significance was calculated using an ordinary one-way ANOVA with Bonferroni’s multiple comparisons test. h Beneficial effect on cholesterol levels in total cell lysates (TCL; n = 3 in untreated and H151 conditions, n = 6 in the APP KO conditions) after 5 h H151 treatment or after an APP KO, using the Cholesterol Glo Assay. Statistical differences were calculated using two-tailed, unpaired t-tests. i Top: representative confocal images of untreated and APP knockout SH-SY5Y cells, stained with the D4H-cholesterol probe (magenta) and CatD (green). Images were taken in confocal mode on a ZEISS LSM 900. Scale bar = 10 µm. Bottom: Co-localization analysis using line intensity profiles. Quantification of IF images using j Manders’ coefficient and k integrated densities per cellular area (n = 23–35). Statistical differences were calculated using two-tailed, unpaired t-tests as indicated. Source data are provided as a Source Data file.
Fig. 8
Fig. 8. PLD3 exonuclease dysfunction impacts CpG-rich mtDNA catabolism that promotes a more broadly lysosome-centered pathology.
PLD3 depletion and exonuclease dysfunction-causing SNPs promote lysosomal mtDNA build-up. This is accompanied by a lysosomal catabolic impairment and an increased leakiness propensity, leading to TLR9 and STING pathway activation that further promotes autophagy. This results in the accumulation of APP-CTF in autolysosomes, providing additional crosstalk with STING activation, while upregulating SREBP2, and activating de novo cholesterol synthesis. Overall, we identify several feed-forward loops that further confound the degradative capacity of lysosomes, resulting in the accumulation of autolysosomes. A decreased lysosomal Ca2+ storage/release and a significantly altered lipid composition likely impact as well mitochondria-lysosome MCSs, further propagating the lysosome-centered defects to other organelles, notably mitochondria. Created with BioRender.com.

References

    1. Small SA, Petsko GA. Endosomal recycling reconciles the Alzheimer’s disease paradox. Sci. Transl. Med. 2020;12:eabb1717. doi: 10.1126/scitranslmed.abb1717. - DOI - PMC - PubMed
    1. Peric A, Annaert W. Early etiology of Alzheimer’s disease: tipping the balance toward autophagy or endosomal dysfunction? Acta Neuropathol. 2015;129:363–381. doi: 10.1007/s00401-014-1379-7. - DOI - PMC - PubMed
    1. Knopman DS, et al. Alzheimer disease. Nat. Rev. Dis. Prim. 2021;7:33. doi: 10.1038/s41572-021-00269-y. - DOI - PMC - PubMed
    1. Van Acker ZP, Bretou M, Annaert W. Endo-lysosomal dysregulations and late-onset Alzheimer’s disease: impact of genetic risk factors. Mol. Neurodegener. 2019;14:20. doi: 10.1186/s13024-019-0323-7. - DOI - PMC - PubMed
    1. Sannerud R, Annaert W. Trafficking, a key player in regulated intramembrane proteolysis. Semin. Cell Dev. Biol. 2009;20:183–190. doi: 10.1016/j.semcdb.2008.11.004. - DOI - PubMed

Publication types