. 2023 May;617(7962):711-716.
doi: 10.1038/s41586-023-05925-9. Epub 2023 May 24.

Ångström-resolution fluorescence microscopy

Affiliations

Ångström-resolution fluorescence microscopy

Susanne C M Reinhardt et al. Nature. 2023 May.

Abstract

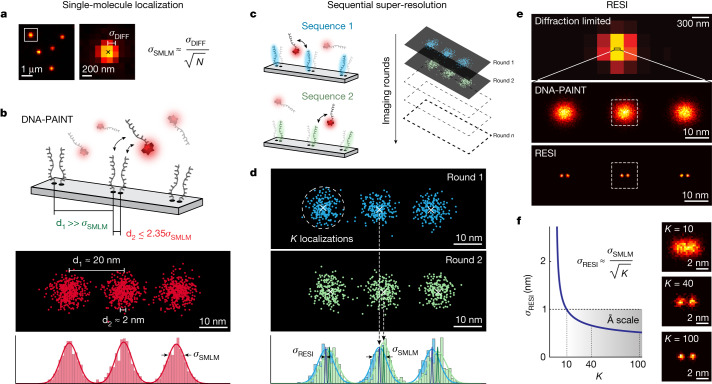
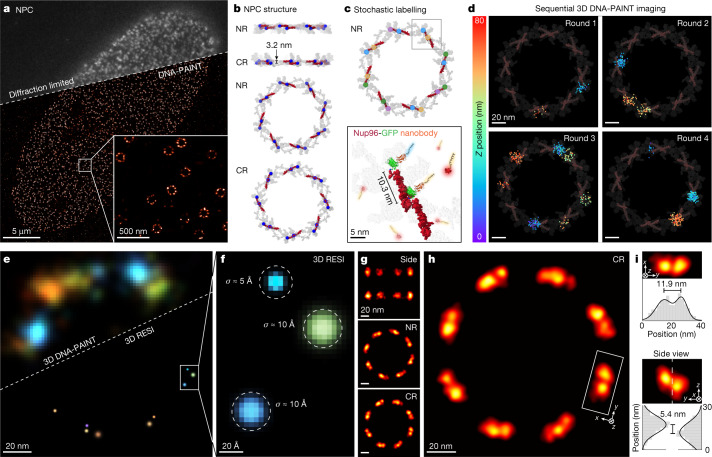
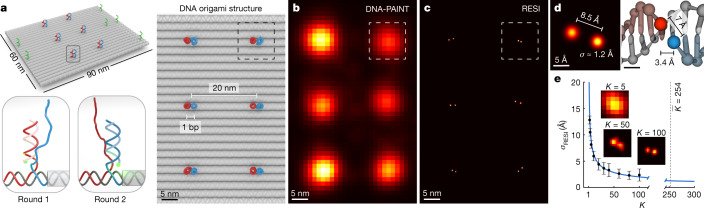
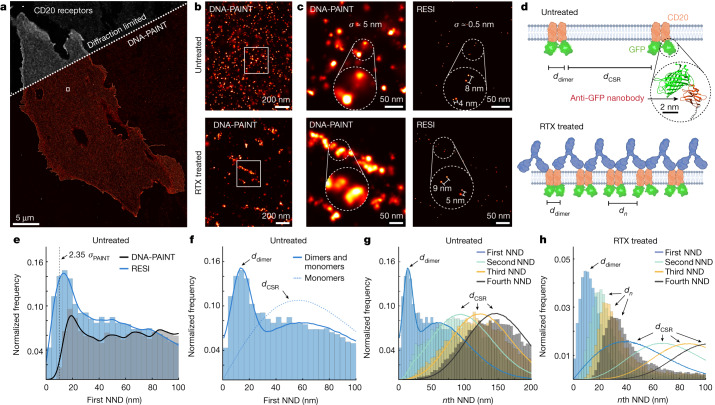
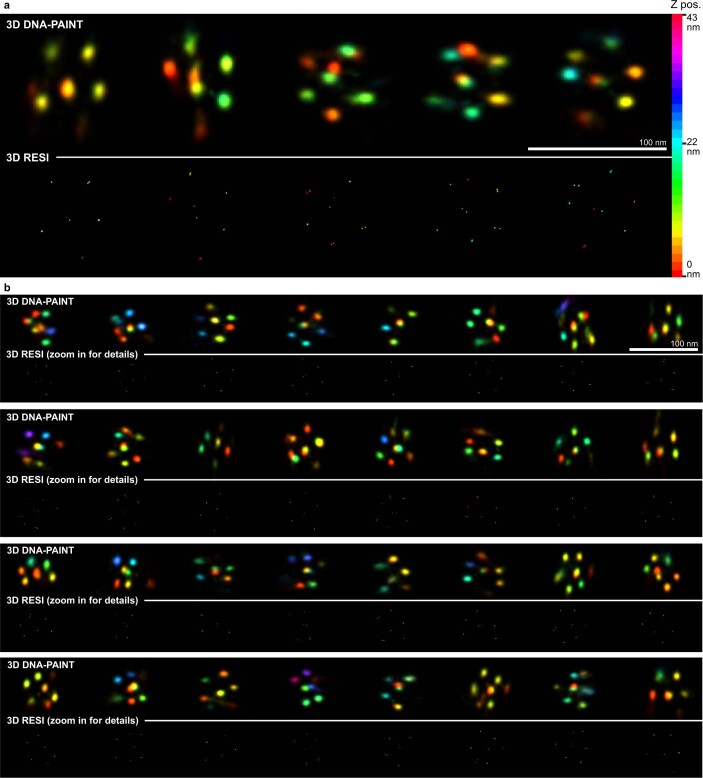
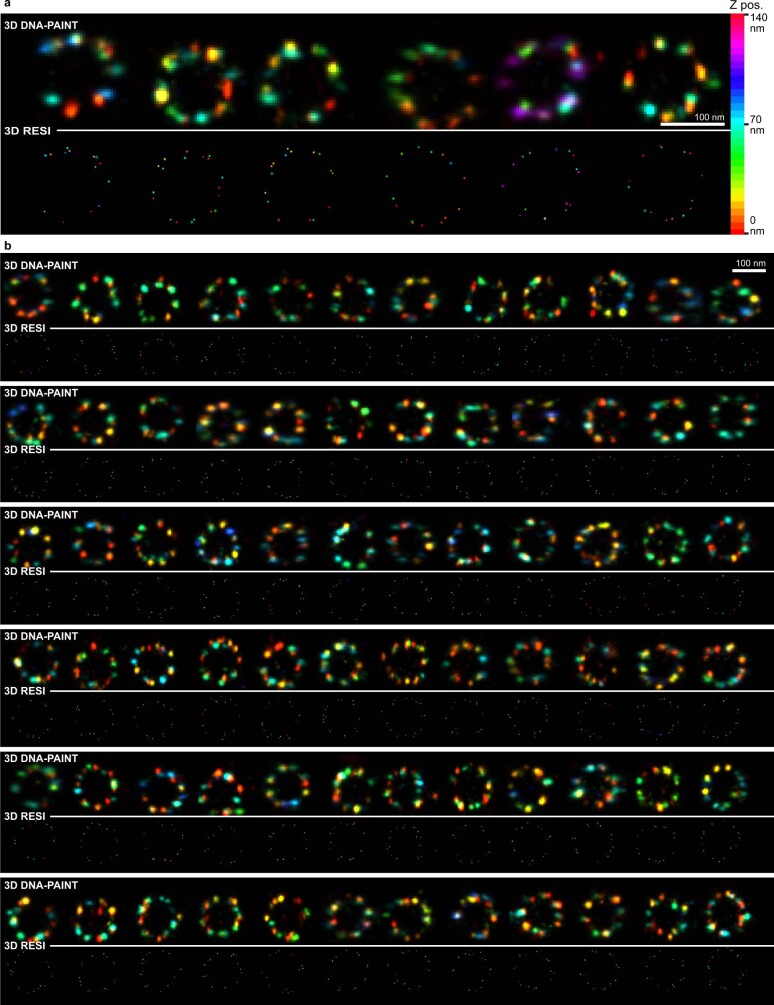
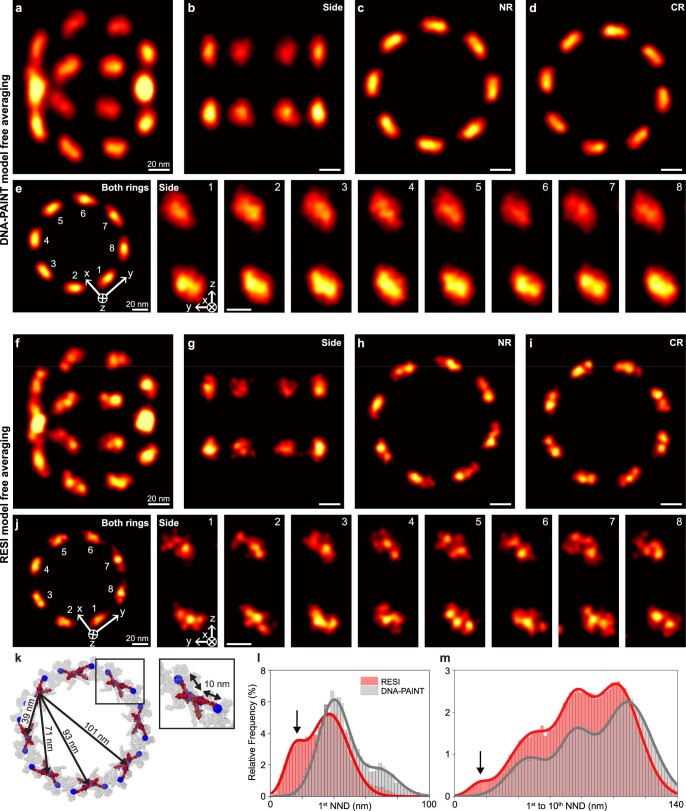
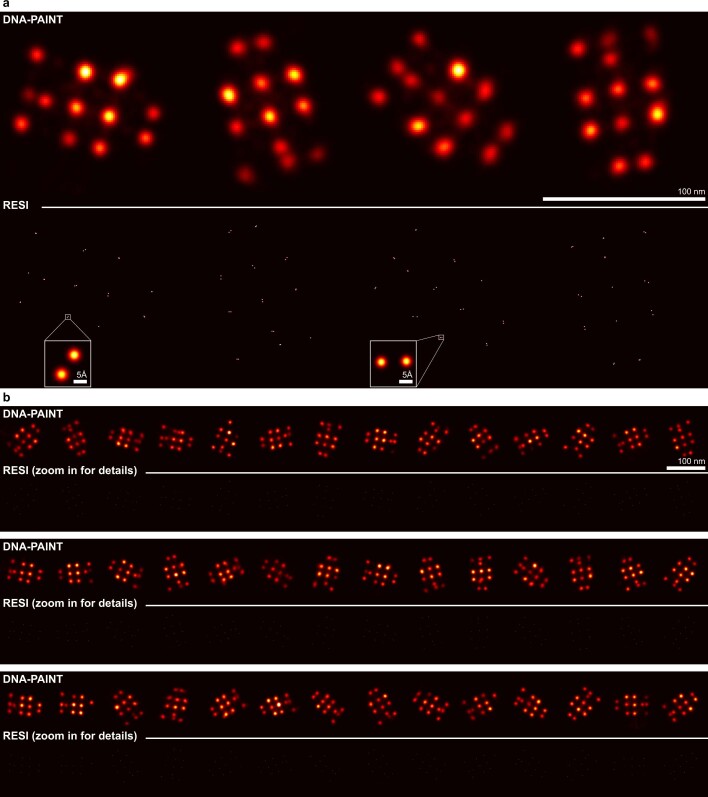
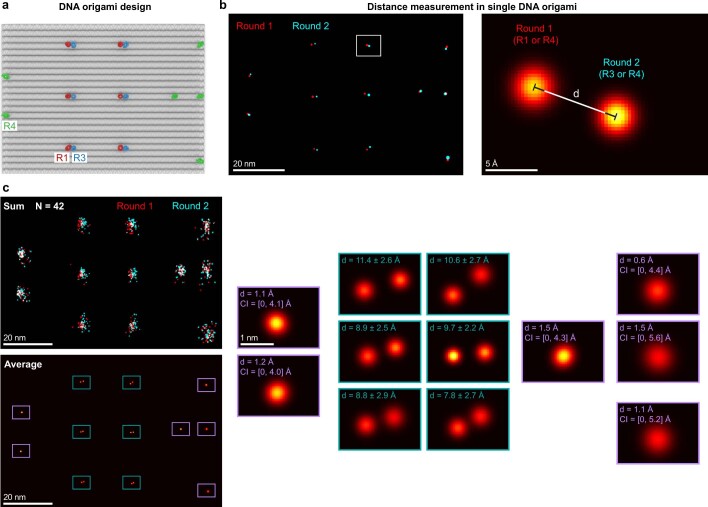
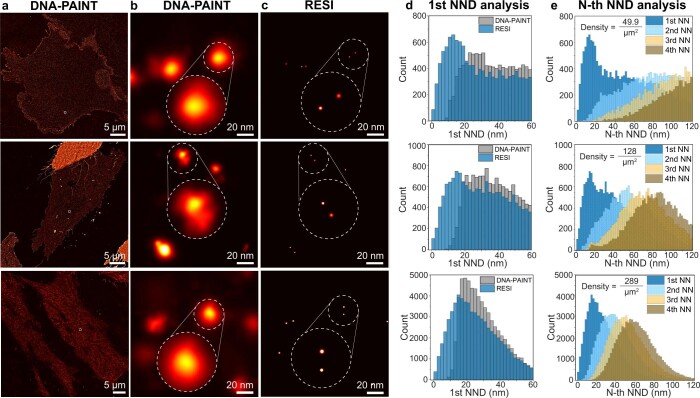
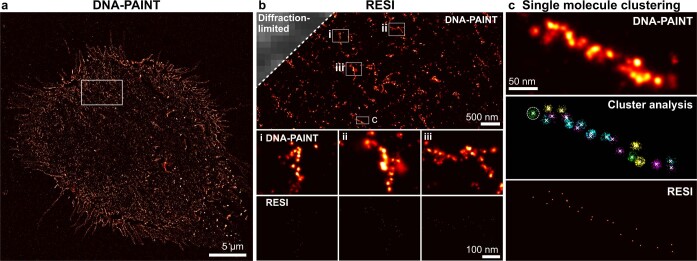
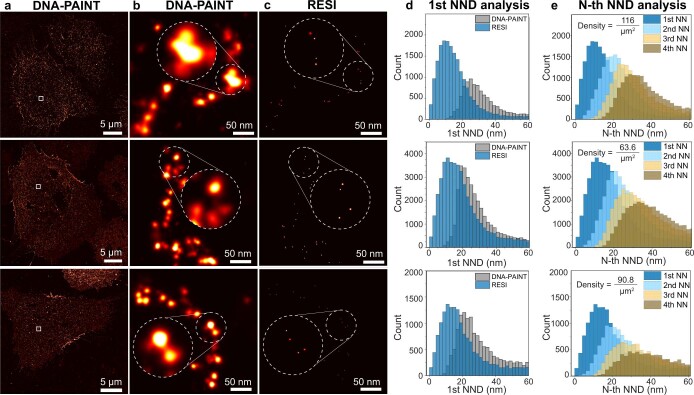
Fluorescence microscopy, with its molecular specificity, is one of the major characterization methods used in the life sciences to understand complex biological systems. Super-resolution approaches1-6 can achieve resolution in cells in the range of 15 to 20 nm, but interactions between individual biomolecules occur at length scales below 10 nm and characterization of intramolecular structure requires Ångström resolution. State-of-the-art super-resolution implementations7-14 have demonstrated spatial resolutions down to 5 nm and localization precisions of 1 nm under certain in vitro conditions. However, such resolutions do not directly translate to experiments in cells, and Ångström resolution has not been demonstrated to date. Here we introdue a DNA-barcoding method, resolution enhancement by sequential imaging (RESI), that improves the resolution of fluorescence microscopy down to the Ångström scale using off-the-shelf fluorescence microscopy hardware and reagents. By sequentially imaging sparse target subsets at moderate spatial resolutions of >15 nm, we demonstrate that single-protein resolution can be achieved for biomolecules in whole intact cells. Furthermore, we experimentally resolve the DNA backbone distance of single bases in DNA origami with Ångström resolution. We use our method in a proof-of-principle demonstration to map the molecular arrangement of the immunotherapy target CD20 in situ in untreated and drug-treated cells, which opens possibilities for assessing the molecular mechanisms of targeted immunotherapy. These observations demonstrate that, by enabling intramolecular imaging under ambient conditions in whole intact cells, RESI closes the gap between super-resolution microscopy and structural biology studies and thus delivers information key to understanding complex biological systems.


Conflict of interest statement

C.K. declares employment, patents (unrelated to this work) and stock ownership with Roche.

Figures

Fig. 1
Fig. 1. RESI concept.
a, In SMLM, σSMLM of a single dye scales with σDIFFN, ultimately limiting the achievable spatial resolution. b, SMLM approaches such as DNA-PAINT feature approximately 10 nm spatial resolution (resolution approximated as full-width at half-maximum ≈ 2.35 σSMLM). Whereas targets separated by 20 nm (d1) can thus be routinely resolved, objects spaced 2 nm apart (d2) are unresolvable because the resulting distributions of localizations overlap. c, Using orthogonal DNA sequences (blue and green) and sequential acquisition as in Exchange-PAINT, localizations from targets spaced more closely than the SMLM resolution limit can be unambiguously assigned for each target. d, Combining all localizations per target (K) for each imaging round improves localization precision from s.d. (σSMLM) to s.e.m. (σRESI). e, As super-resolution revolutionized fluorescence microscopy, RESI results in another paradigm shift by reapplying the concept of localization to super-resolution data. f, Localization precision in RESI scales with 1K, and thus resolution improvement in RESI is independent of σSMLM, reaching localization precision on the Ångström scale.
Fig. 2
Fig. 2. NPC proteins in whole cells resolved with Ångström precision by RESI.
a, Diffraction-limited and DNA-PAINT overview image of Nup96-mEGFP labelled with DNA-conjugated anti-GFP nanobodies. Zoomed-in view (bottom right) shows high labelling efficiency and image quality for standard DNA-PAINT conditions, recapitulating the eight-fold symmetry of the NPC. b, Cryo-EM structure representation of the location of Nup96 proteins (red; C-terminal mEGFP position marked in blue) as part of the Y-complex in nuclear and cytoplasmic rings (NR and CR, respectively). Adapted from PDB 7PEQ. Nup96 is present in 32 copies per NPC. c, To enable RESI, Nup96-mEGFP proteins were stochastically labelled with orthogonal DNA sequences by incubation of the sample with anti-GFP nanobodies, each conjugated with one of four orthogonal sequences (represented by blue, yellow, magenta and green dots). d, Sequential 3D imaging (colour represents z position) of the four labels yielded sufficiently spaced localization distributions. The average number of localizations per target is Kaverage = 38 (background represents cryo-EM structure from b for context). e, Comparison of 3D DNA-PAINT (top left) and 3D RESI (bottom right) for the same NPC illustrating improvement in spatial resolution by RESI. Localizations are rendered as gaussians with σDNA-PAINT and σRESI, respectively. f, Localization precision (σRESI) as good as 5 Å was achieved by combining K localizations for each target, unambiguously resolving single Nup96 proteins. g, The 3D NPC cryo-EM structure was recapitulated using optical microscopy by applying a model-free average of 1,217 NPCs from a single nucleus. h, RESI resolved adjacent Nup96 in a structural average by optical microscopy. i, Consistent with the cryo-EM structure (taking into account linkage error arising from label size), adjacent Nup96 proteins were spaced 11.9 ± 1.2 nm apart laterally (top) and 5.4 ± 0.4 nm axially (bottom).
Fig. 3
Fig. 3. RESI resolves the distance of single DNA base pairs at Ångström resolution.
a, DNA origami with docking strands spaced by a single base pair (bp; red and blue strands, with alignment markers in green) provided a platform to demonstrate the highest resolution achievable by RESI. b, DNA-PAINT resolved 20 nm spacing but the resolution was insufficient to distinguish individual docking sites, spaced one base apart. c, RESI resolves the adjacent docking strands. d, A Euclidean distance of 8.5 ± 1.7 Å was calculated from individual localizations with an average precision of 1.2 Å (left) for the single-base-pair backbone distance, which is within 1 s.d. of the expected value of roughly 7 Å (right). e, Experimental localization precision in RESI is in good agreement with σSMLMK (blue line, K), yielding an average localization precision of 1.3 Å for the experimental data from all n = 42 DNA origami (insets correspond to exemplary point pair in d). Error bars represent mean ± 1 s.d.
Fig. 4
Fig. 4. RESI shows CD20 receptor (re)organization at subnanometre precision following drug treatment.
a, Diffraction-limited and DNA-PAINT overview image of CHO cells expressing mEGFP-CD20 labelled with anti-GFP nanobodies. b, Zoomed-in DNA-PAINT image showing apparently randomly distributed CD20 receptors for untreated cells (top) and clustered receptor arrangement for RTX-treated cells (bottom). c, Comparison of DNA-PAINT and RESI for both untreated and RTX-treated cells showing sub-10-nm-spaced receptor pairs in the RESI images, which are unresolvable with DNA-PAINT. d, RESI data suggest that CD20 proteins occur in dimers (spaced at ddimer), which are in turn distributed according to complete spatial randomness (CSR; distances between dimers, dCSR) in untreated cells. Chains of dimers were observed following administration of RTX. e, Whole-cell analysis of first NNDs of CD20 receptors (histograms of distances and kernel density estimation are shown). Only RESI, but not DNA-PAINT, allows the routine detection of sub-10-nm distances between proteins. Whereas DNA-PAINT overestimates dimer distance, RESI shows a label-limited distance of 13.5 nm (see main text for discussion). f, Fitting RESI NND data from e to a numerical model reveals CD20 dimers and monomers. g, CD20 receptors in untreated cells showed second to fourth NNDs consistent with CSR, thus excluding the presence of higher-order protein complexes. h, CD20 receptors in RTX-treated cells, however, showed first to fourth NNDs, inconsistent with complete spatial randomness.
Extended Data Fig. 1
Extended Data Fig. 1. RESI resolution estimation.
a, A grid of defined positions of binding sites is generated (top left), SMLM (DNA-PAINT) localizations are simulated as samples from a gaussian distribution (top right). Localizations for only one binding site were plotted for clarity. For each binding site, subsets of K localizations are randomly selected (bottom left) and averaged (bottom right). One exemplary subset and its average is highlighted. b, Resulting RESI-localizations are histogrammed to produce images at different resolutions (K values). c, RESI-localization precision σRESI vs K. Analytical dependence on K (blue line) and numerical results (black dots). A total of 1200 SMLM localizations per site are simulated. Error bars represent mean ± 1 s.d.
Extended Data Fig. 2
Extended Data Fig. 2. RESI in 2D DNA origami.
a, DNA origami design featuring six 5 nm-spaced orthogonal docking strand pairs (red R1, blue R3) and six alignment docking strands (green R4). See Methods for sequence details. b, DNA-PAINT acquisition parameters were tuned such that 5 nm were not consistently resolvable. c, First imaging round conducted with R1 (target) and R4 imagers (alignment, sites circled). d, Second imaging round conducted with R3 (target) and alignment imagers (R4, sites circled). The alignment sites were used for translational and rotational alignment between rounds. e, RESI resolves the 5 nm distances. f, The distance and orientation between R1 and R3 docking strands are consistent with the design. g, An average of 90 DNA origami structures reveals consistent results and excellent alignment performance. The numbers indicate the distance between rounds.
Extended Data Fig. 3
Extended Data Fig. 3. 2D DNA origami.
Representative DNA origami from across the field of view of the measurement. a, Four DNA origami, shown at DNA-PAINT resolution (upper row) and RESI resolution (lower row). The insert depicts a pair of docking strands spaced at approx. 5 nm. b, 40 additional DNA origami, shown at DNA-PAINT resolution (upper rows) and RESI resolution (lower rows).
Extended Data Fig. 4
Extended Data Fig. 4. RESI in 3D DNA origami.
a, DNA origami design featuring one pair of orthogonal docking strands (red R1, blue R3) as well as six alignment docking strands (green R4). Docking strands extend from both the top and bottom surface of the DNA origami (insert). b, The design ensures that all but the R1/R3 docking strand pair are spaced sufficiently to be resolved by DNA-PAINT. c, 3D DNA-PAINT imaging resolves R4 alignment sites, barely resolves R1/R3 axially and does not resolve R1/R3 laterally. d, Sequential 3D DNA-PAINT imaging with R4 sites used for alignment. e, RESI resolves R1/R3 both axially and laterally. f, An overlay of 88 DNA origami reveals overall good alignment despite structural heterogeneity. g, Average of 88 DNA origamis. h, The particle average recovers the structure with an alignment uncertainty of 0.7 nm CI = [0, 1.6] nm, showing a distance between the average R1/R3 positions of 11.6 ± 0.8 nm (xy-distance: 2.5 ± 0.4 nm, z-distance: 11.3 ± 0.8 nm), matching the designed distances. Same scale applies to all magnification panels. CI describes 68% confidence interval.
Extended Data Fig. 5
Extended Data Fig. 5. 3D DNA origami.
Representative 3D DNA origami from across the field of view of the measurement. a, Five DNA origami, shown at DNA-PAINT resolution (upper row) and RESI resolution (lower row). The color scale to the right represents the z position of localizations. The measured z coordinates for each DNA origami have been shifted by a constant such that the lowest localization for a given structure is defined to be at z = 0. This ensures full use of the color range. b, 32 additional DNA origami, shown at DNA-PAINT resolution (upper rows) and RESI resolution (lower rows). The z positions are colored according to the color scale in panel a.
Extended Data Fig. 6
Extended Data Fig. 6. U2OS Nup96-mEGFP.
Representative NPCs from across the field of view of the measurement. a, Six NPCs, measured using DNA-PAINT (upper row) and RESI (lower row). The color scale to the right represents the z position of localizations. The measured z coordinates for each NPC have been shifted by a constant such that the lowest localization for a given structure is defined to be at z = 0. This ensures full use of the color range. b, 72 additional NPCs, measured using DNA-PAINT (upper rows) and RESI (lower rows). The z positions are colored according to the color scale in panel a.
Extended Data Fig. 7
Extended Data Fig. 7. Averaging of Nup96 proteins.
a, Model-free averaging for DNA-PAINT measurements of Nup96 (N = 1045 NPCs). An angled isometric view is shown. bd, DNA-PAINT resolves nucleoplasmic and cytoplasmic rings and recapitulates their eight-fold symmetry, but fails to resolve individual Nup96 proteins. e, Side views of all Nup96 pairs in both rings reveal the angled orientation but do not resolve individual Nup96 proteins. f, Model-free averaging for RESI measurements of Nup96 (N = 1190 NPCs). gi, RESI recapitulates nucleoplasmic and cytoplasmic rings as well as their eight-fold symmetry and resolves individual adjacent Nup96 proteins in the majority of cases. j, Side views of all eight Nup96 pairs in both rings reveal the angled orientation as well as, in some cases, adjacent individual Nup96 proteins. k, The Cryo-EM structure of the nuclear pore complex indicates that a given Nup96 protein will have neighbors spaced at 11 nm, 39 nm, 71 nm, 93 nm and 101 nm. l, Performing clustering and nearest neighbor analysis for DNA-PAINT data reveals a peak at approx. 40 nm, corresponding to the distance between two Nup96 pairs, but not below that. RESI, on the other hand, features a first peak at approx. 15 nm, corresponding to the distance between adjacent Nup96 while taking linkage error (label size) into account. m, Analysis of first to tenth nearest neighbor distances for RESI and DNA-PAINT recapitulates the distances from (k), but only RESI resolves the smallest distance. All scale bars: 20 nm.
Extended Data Fig. 8
Extended Data Fig. 8. Sub-nm DNA origami.
Representative DNA origami from across the field of view of the measurement. a, Four DNA origami, shown at DNA-PAINT resolution (upper row) and RESI resolution (lower row). The inserts show pairs of directly adjacent docking strands resolved by RESI. b, 42 additional DNA origami, shown at DNA-PAINT resolution (upper rows) and RESI resolution (lower rows).
Extended Data Fig. 9
Extended Data Fig. 9. Sub-nm RESI measurements.
a, DNA origami featuring six alignment strands (green R4) and six pairs of orthogonal docking strands (red R1, blue R3) spaced one base pair apart. b, RESI representation with RESI-localizations from round 1 in red and round 2 in blue illustrates excellent alignment. The distances between RESI-localizations from round 1 and 2 are defined as illustrated. c, Overlaying 42 DNA origami and performing a particle average recovers the structure with an alignment uncertainty of 1.2 Å CI = [0, 4.6] Å, showing distances between the average positions of the sites at 9.5 ± 2.6 Å (mean over six distances in the average ± mean over the error-propagated uncertainties of the six distances). Same scale applies to all magnification panels. CI describes 68% confidence interval.
Extended Data Fig. 10
Extended Data Fig. 10. RESI resolves CD20 dimers in untreated CHO cells for different expression levels.
a, DNA-PAINT imaging of whole mEGFP-CD20-expressing CHO cells, labeled with anti-GFP-nanobodies, shows homogeneously distributed molecules for three independent experiments. b, Zoom-in regions of DNA-PAINT show cases in which dimers could not be resolved. c, RESI reveals sub-10-nm spaced receptor pairs, which are unresolvable in the DNA-PAINT cases. d, Whole-cell analysis of first nearest neighbor distances (1st NNDs) of CD20 receptors (histograms of the distances are displayed). Only RESI, but not DNA-PAINT, allows the routine detection of sub-10-nm distances between proteins. e, RESI-localization precision below 1 nm allows for routine detection of sub-10-nm distances, resulting in an accurate assessment of the first NND.
Extended Data Fig. 11
Extended Data Fig. 11. RESI resolves the substructure in RTX-induced chain-like arrangements of CD20 receptors with sub-nanometer precision.
a, DNA-PAINT overview image of mEGFP-CD20 expressing CHO cells treated with RTX. b, Labeling with DNA-conjugated anti-GFP-nanobodies and imaging with DNA-PAINT reveals higher-order organization after RTX-treatment. RESI (insets i–iii) achieves molecular resolution and thereby resolves the molecular arrangement of mEGFP-CD20. c, DNA-PAINT imaging shows clustered CD20 molecules. Performing RESI with sequences R1, R2, R3 and R4 in four separate imaging rounds (color-coded) allows for clustering of localizations originating from a single target. From the clustered localizations, RESI-localizations were calculated, enabling true single-protein resolution.
Extended Data Fig. 12
Extended Data Fig. 12. RESI reveals higher order arrangement of CD20 dimers in Rituximab-treated CHO cells.
a, DNA-PAINT imaging of whole mEGFP-CD20-expressing CHO cells, labeled with anti-GFP-nanobodies, shows clustered CD20- molecules in Rituximab-treated cells for three independent experiments. b, Zoom-in regions of DNA-PAINT show mEGFP- CD20 clustered into chain-like arrangements. c, RESI reveals sub-10-nm spaced receptor pairs within the clusters, unresolvable by DNA-PAINT. d, Whole-cell analysis of first nearest neighbor distances (1st NNDs) of CD20 receptors bound to Rituximab (histograms of the distances are displayed). Only RESI, but not DNA-PAINT, allows the routine detection of sub-10-nm distances between proteins. e, Routine detection of sub-10-nm distances by RESI recapitulates the first NND measured in the untreated case. Notably the NND peaks measured in the three repeats are consistent, independently of the protein density.
Extended Data Fig. 13
Extended Data Fig. 13. Comparison of Rituximab treated CD20 data to simulated CD20 hexamer arrangements.
a, Example of ground truth simulated CD20 hexamers (light blue circles, simulated as triangles of dimers with intra-dimer distances of 13.5 nm as measured experimentally) with random distribution and orientation on a 2D surface at the experimentally determined density. b, Label uncertainty and labeling efficiency (black circles indicate labeled molecules) are taken into account in the simulation for a realistic comparison. c, Simulated proteins in hexameric arrangements represented as gaussians. d, Hexamers after DBSCAN cluster analysis (colors indicate clusters). e, RESI image of CD20 data after RTX-treatment. f, RESI-localizations of CD20 data after DBSCAN cluster analysis (colors indicate clusters). g, Number of molecules per detected cluster for the experimental data and the simulated hexamers. h, Circularity metric of experimental data and the simulated hexamers after convex hull analysis of the clusters. We note that the sharp drop at 0.605 stems from the maximum circularity metric for clusters where the convex hull is defined by three molecules. Notably, the absence of a circularity peak at ~0.7 in the experimental data suggests that CD20 molecules are not arranged in isolated ring-like hexameric structures.
Extended Data Fig. 14
Extended Data Fig. 14. Stochastic labeling.
a, Exemplary simulation of proteins with a Complete Spatial Random (CSR) distribution of a given density. b, Histogram of Nearest Neighbor Distances (NNDs). The red line indicates the smallest distance (d) that can be resolved by DNA-PAINT for a given set of imaging parameters. The fraction of molecules with a NN below this distance threshold (blue, shaded) can be computed for a given density and a given DNA-PAINT resolution. c, 2D map of the fraction of non-resolvable molecules as a function of density and resolution. d, 1D cuts of c at different resolutions (color-coded) can be used as a user guide to estimate the number of multiplexing rounds needed to perform RESI efficiently given a certain target fraction of non-resolvable distances.

Comment in

References

    1. Hell SW, Wichmann J. Breaking the diffraction resolution limit by stimulated emission: stimulated-emission-depletion fluorescence microscopy. Opt. Lett. 1994;19:780–782. doi: 10.1364/OL.19.000780. - DOI - PubMed
    1. Betzig E. Proposed method for molecular optical imaging. Opt. Lett. 1995;20:237–239. doi: 10.1364/OL.20.000237. - DOI - PubMed
    1. Klar TA, Jakobs S, Dyba M, Egner A, Hell SW. Fluorescence microscopy with diffraction resolution barrier broken by stimulated emission. Proc. Natl Acad. Sci. USA. 2000;97:8206–8210. doi: 10.1073/pnas.97.15.8206. - DOI - PMC - PubMed
    1. Betzig E, et al. Imaging intracellular fluorescent proteins at nanometer resolution. Science. 2006;313:1642–1645. doi: 10.1126/science.1127344. - DOI - PubMed
    1. Rust MJ, Bates M, Zhuang X. Sub-diffraction-limit imaging by stochastic optical reconstruction microscopy (STORM). Nat. Methods. 2006;3:793–795. doi: 10.1038/nmeth929. - DOI - PMC - PubMed

Publication types

MeSH terms

LinkOut - more resources