. 2023 Jun;618(7963):159-168.
doi: 10.1038/s41586-023-05972-2. Epub 2023 May 24.

A small-molecule PI3Kα activator for cardioprotection and neuroregeneration

Affiliations

A small-molecule PI3Kα activator for cardioprotection and neuroregeneration

Grace Q Gong et al. Nature. 2023 Jun.

Abstract

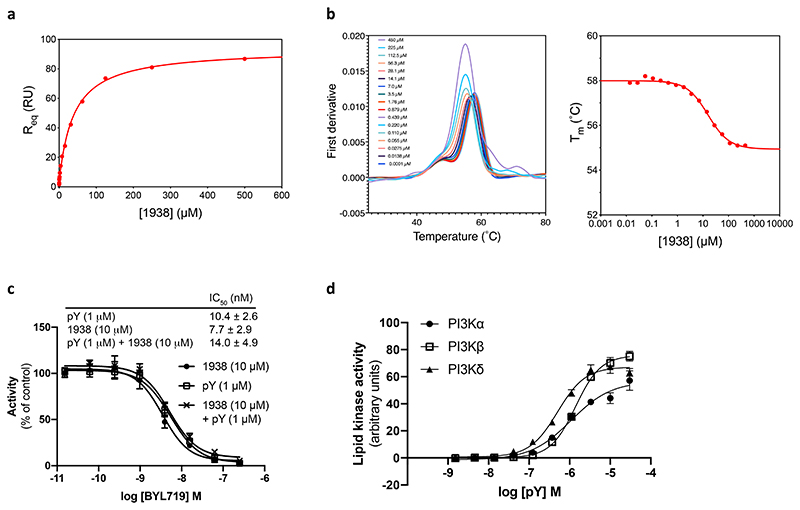
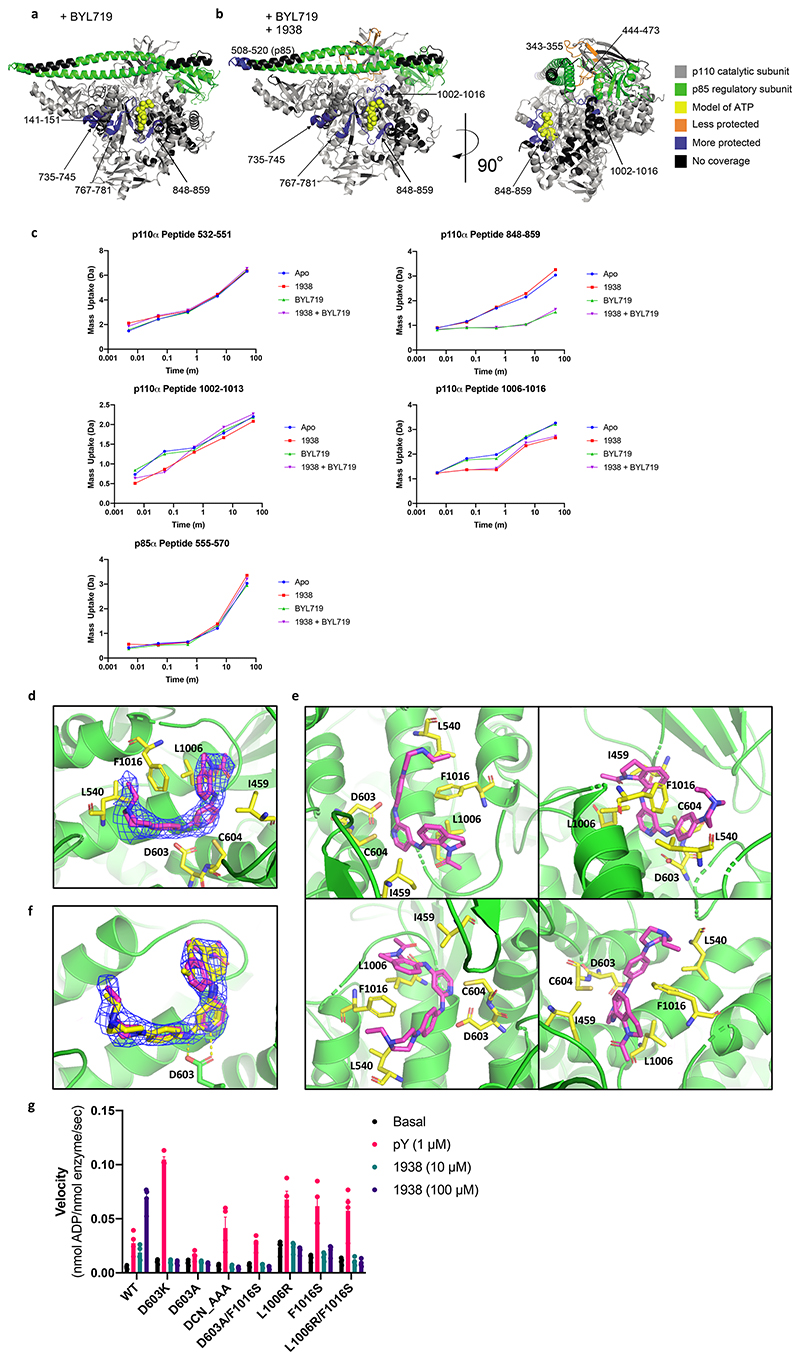
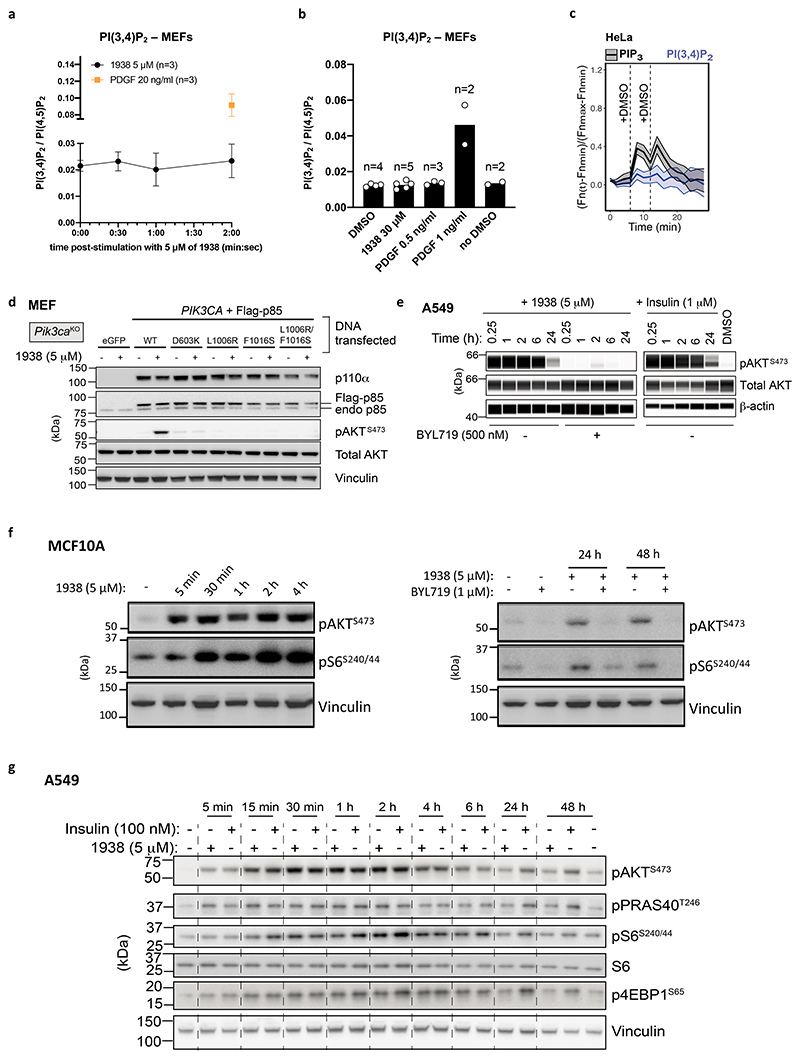
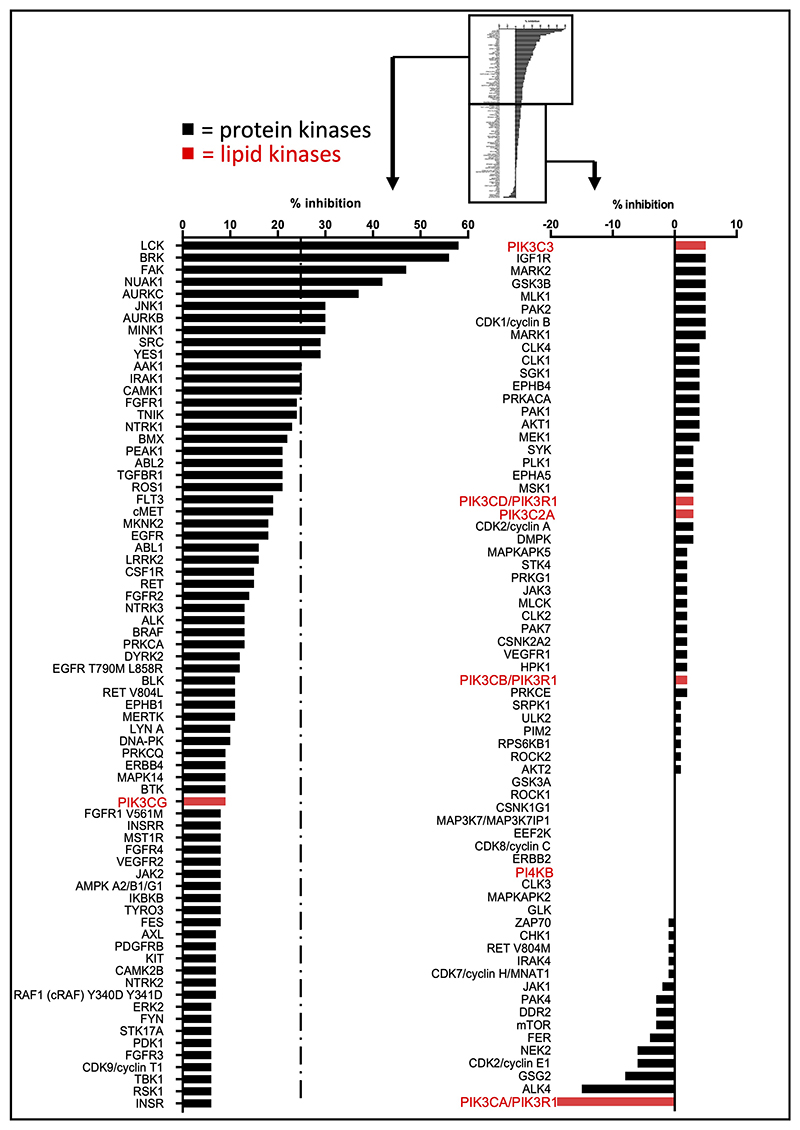
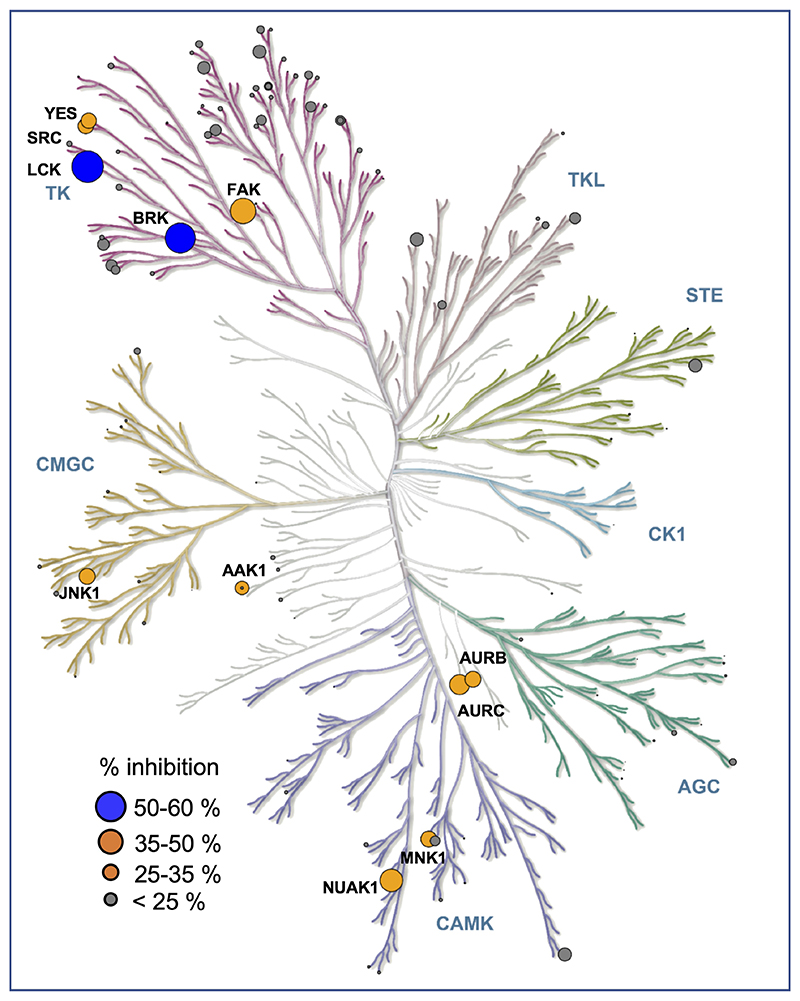
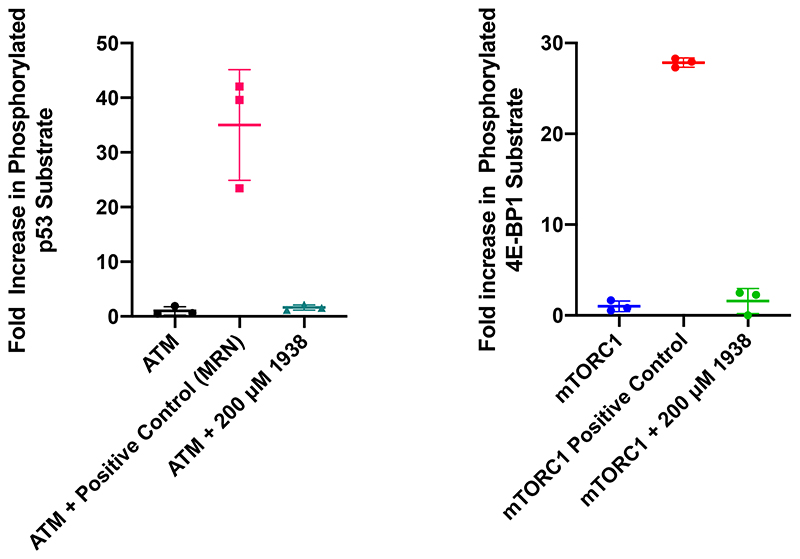
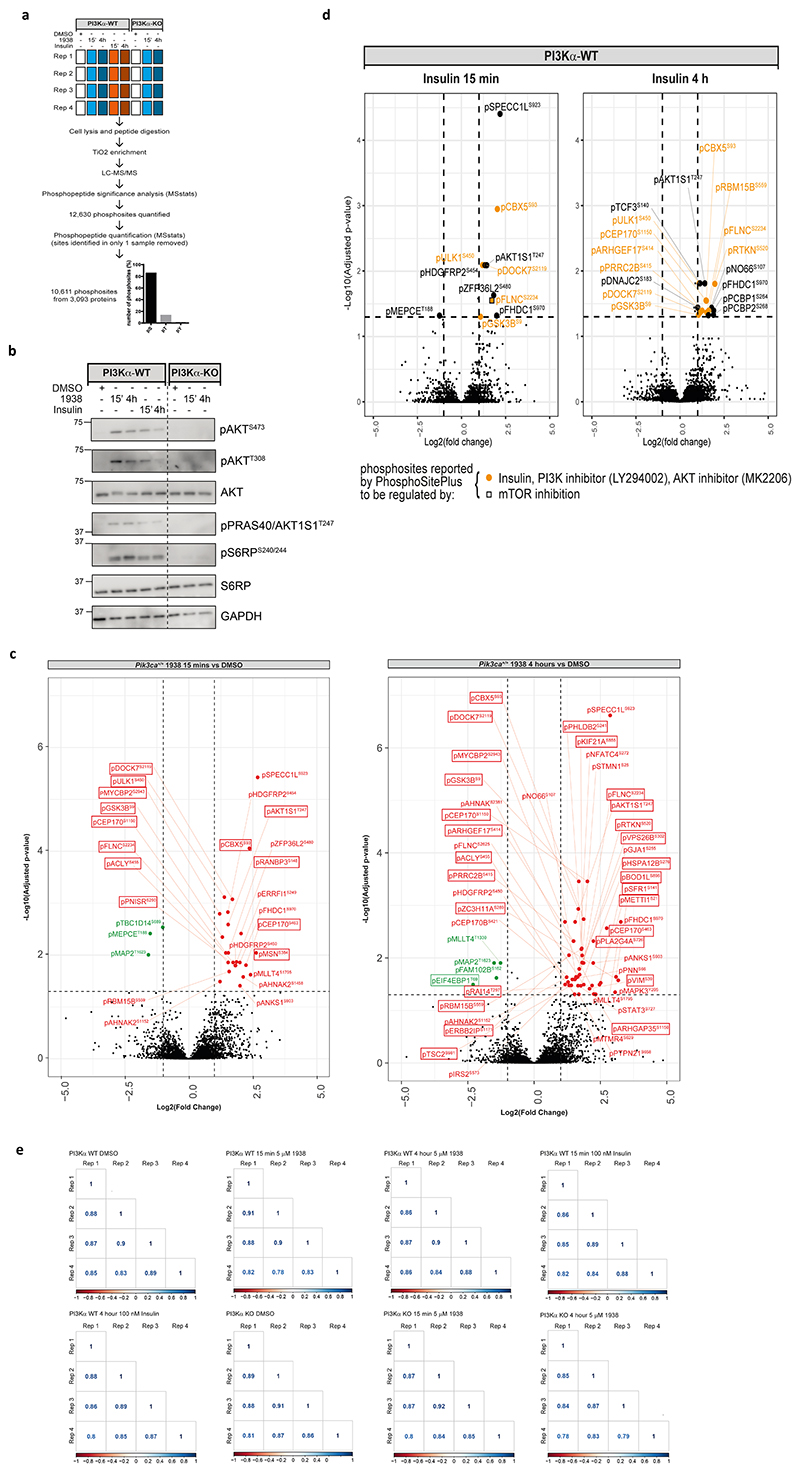
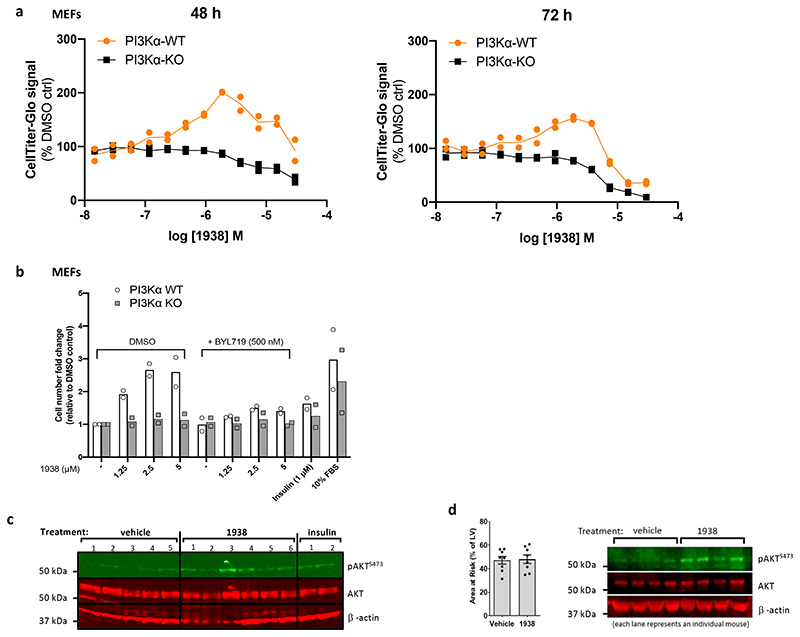
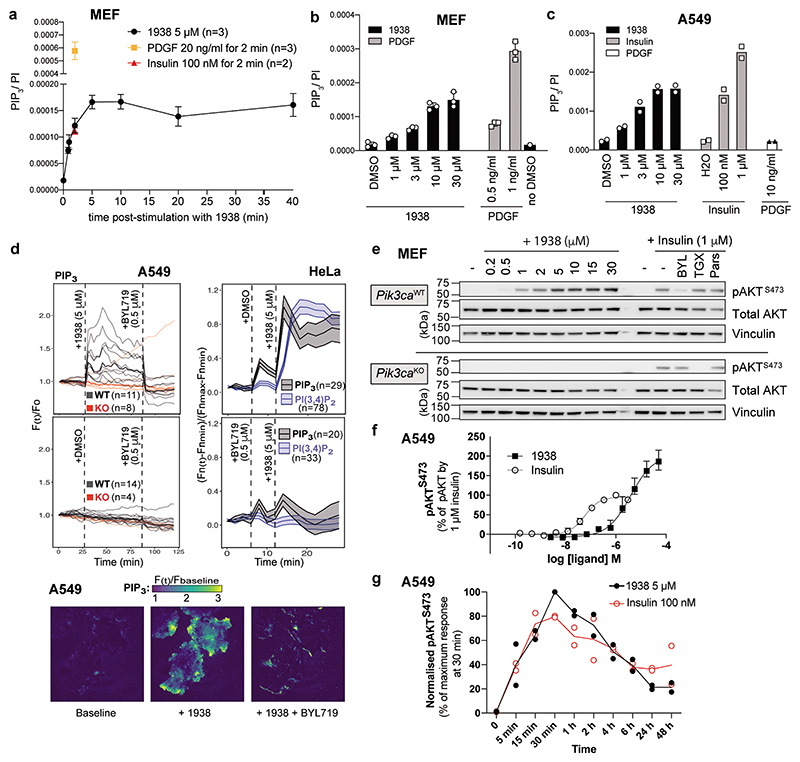
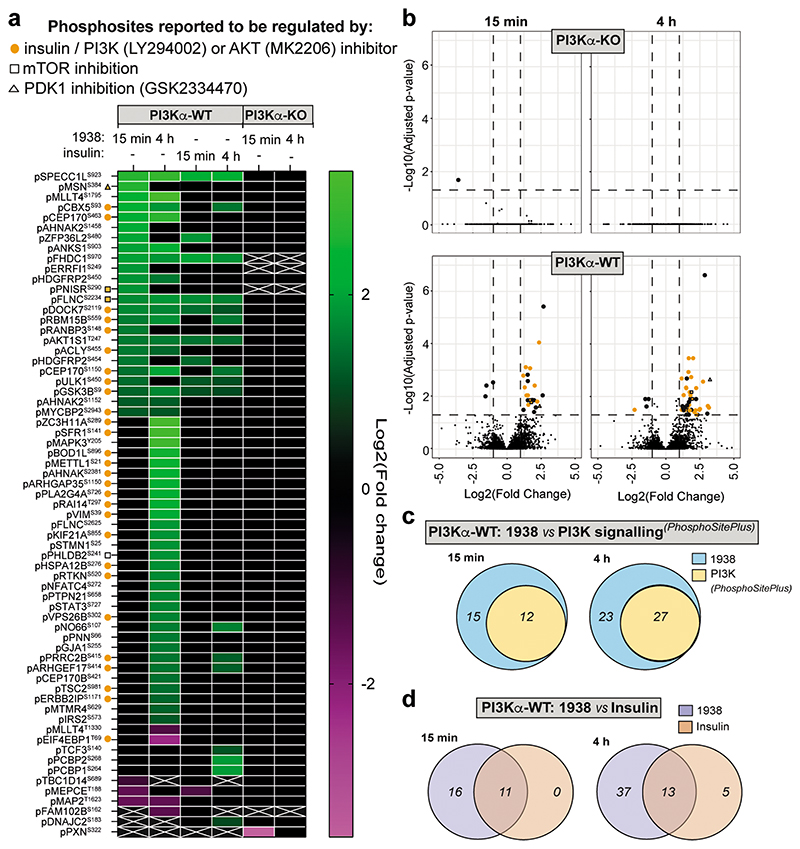
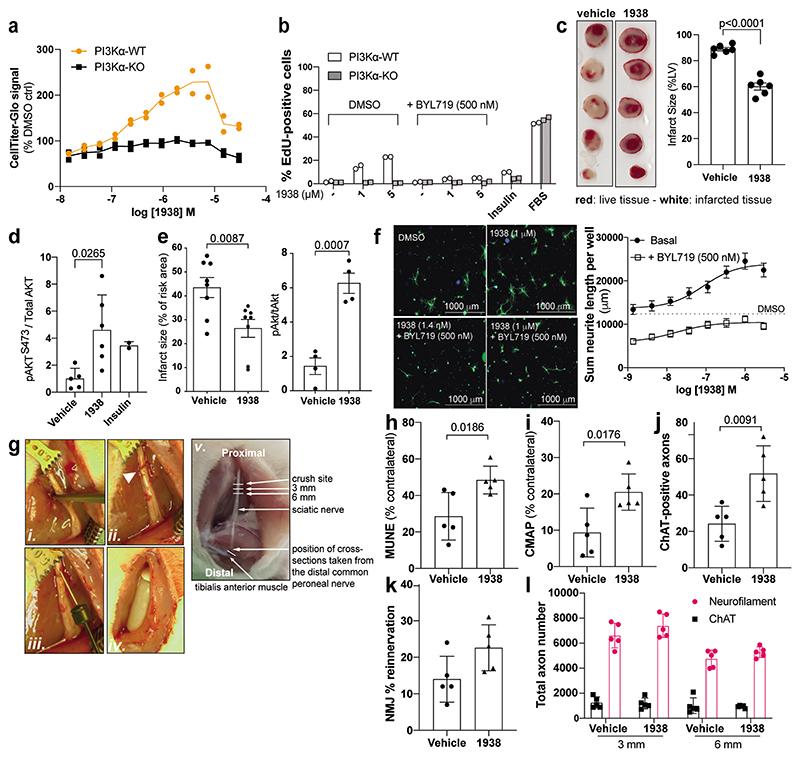
Harnessing the potential beneficial effects of kinase signalling through the generation of direct kinase activators remains an underexplored area of drug development1-5. This also applies to the PI3K signalling pathway, which has been extensively targeted by inhibitors for conditions with PI3K overactivation, such as cancer and immune dysregulation. Here we report the discovery of UCL-TRO-1938 (referred to as 1938 hereon), a small-molecule activator of the PI3Kα isoform, a crucial effector of growth factor signalling. 1938 allosterically activates PI3Kα through a distinct mechanism by enhancing multiple steps of the PI3Kα catalytic cycle and causes both local and global conformational changes in the PI3Kα structure. This compound is selective for PI3Kα over other PI3K isoforms and multiple protein and lipid kinases. It transiently activates PI3K signalling in all rodent and human cells tested, resulting in cellular responses such as proliferation and neurite outgrowth. In rodent models, acute treatment with 1938 provides cardioprotection from ischaemia-reperfusion injury and, after local administration, enhances nerve regeneration following nerve crush. This study identifies a chemical tool to directly probe the PI3Kα signalling pathway and a new approach to modulate PI3K activity, widening the therapeutic potential of targeting these enzymes through short-term activation for tissue protection and regeneration. Our findings illustrate the potential of activating kinases for therapeutic benefit, a currently largely untapped area of drug development.


Conflict of interest statement

Competing interests

B.V. is a consultant for iOnctura (Geneva, Switzerland), Venthera (Palo Alto, US), Pharming (Leiden, the Netherlands) and Olema Pharmaceuticals (San Francisco, US), and has received speaker fees from Gilead (Foster City, US). M.F., M.C., I.F., A.M. and D.M.S. are or were employees and shareholders in AstraZeneca at the time of the work done. J.B.P. is co-Founder and Chief Scientific Officer of the UCL spinout company Glialign Ltd. The other authors do not have competing interests to disclose. A patent application GB 2113079.4, with relevance to this work has been filed by UCL Business and we want to declare our relationship with this patent application.

Figures

Extended data Fig. 1
Extended data Fig. 1. Additional biochemical data on 1938.
a, Determination of Kd for the dissociation of 1938 from p110α/p85α by surface plasmon resonance (SPR). SPR equilibrium response titration of 1938 binding to immobilized p110α/p85α, yielding a dissociation constant Kd = 36 ± 5 μM. b, Determination of Kd for the dissociation of 1938 from p110α/p85α by differential scanning fluorimetry (DSF). The first derivatives of the fluorescence change of p110α/p85α upon thermal denaturation at the stated 1938 concentrations (left panel) were used to plot the melting temperature (Tm) (right panel). Fits to data gave a Kd = 16 ± 2 μM. Kd shown as mean ± SD (n=3 independent experiments). Representative experiment is shown. c, Effect of 1938 on the IC50 of BYL719 for PI3Kα. Data shown as mean ± SEM (n=3 independent experiments). d, Activation of class IA PI3K isoforms by a concentration range of pY using the ADP-Glo assay. Data shown as mean ± SEM (n=3 independent experiments).
Extended data Fig. 2
Extended data Fig. 2. Additional data on HDX-MS and crystallography.
Structural changes induced by BYL719 (a), or 1938 in combination with BYL719 (b), assessed by HDX-MS in full-length p110α/p85α, highlighted on the structure of p110α (gray)/niSH2-p85α (green) (PDB:4ZOP). Selection threshhold for significant peptides: a-b difference ≥2.5%, Da difference ≥0.25, p-value <0.05 (unpaired t-test). c, Peptide uptake from HDX-MS. A selection of peptides (peptides 848-859, 532-551, 1002-1013 and 1006-1016 are from p110α, peptide 555-570 is from p85α) exhibiting significant differences in solvent exchange rates on the addition of 1938 (red), BYL719 (green), both (purple) or neither (blue). Data presented here is from one of three biological replicates Five time points were measured in triplicate. Each point is the mean of one biological repeat. d, Omit map of ligand 1938 (mFo-DFc) calculated at +/- 3σ using phenix.polder. e, 1938 bound to p110α shown in multiple orientations. f, Two possible orientations shown for the 1938 ligand (magenta and yellow sticks) in the p110α crystal structure, both fit the Sigma-weighted density map (blue, 2mFo-DFc) equally well.Yellow dashes show predicted hydrogen bonds. g, Effect of 1938 on catalytic activity of p110α proteins with mutations in the 1938-binding pocket. Data shown as mean ± SEM (n=4 independent experiments).
Extended Data Fig. 3
Extended Data Fig. 3. Additional data on 1938-driven signalling.
a, MEFs were stimulated at different time points with 1938 (5 μM) or for 2 min with PDGF (20 ng/ml), followed by lipid extraction and PI(3,4)P2 measurement by mass spectrometry. b, MEFs were stimulated for 2 min with 1938 (30 μM) or PDGF (0.5 or 1 ng/ml), followed by lipid extraction and PI(3,4)P2 measurement by mass spectrometry. (a,b) n=independent experiments, shown in figure. Error bars represent SD. c, Control TIRF microscopy data from DMSO-treated HeLa cells expressing the PIP3 or the PI(3,4)P2 reporter. HeLa cells expressing the EGFP-tagged PIP3 reporter PH-ARNO-I303Ex2 (ARNO) (black lines) or the PI(3,4)P2 reporter mCherry-cPH-TAPP1x3 (blue lines) were stimulated with DMSO as indicated. Overlay plots (mean ± SEM) were generated by scaling to minimum and maximum values of the normalised fluorescence intensity for each time point (Fn(t)). PIP3 reporter data are representative of 2 experiments and 16 single cells. PI(3,4)P2 reporter data are representative of 4 experiments and 28 single cells. Individual measurements were acquired every 2 min. d, pAKTS473 induction by 1938 in PI3Kα-KO MEFs transiently transfected with p110α-WT or p110α-mutants. Blot representative of n=2 experiments. e, Time course analysis of 1938-induced pAKTS473 in A549 by 1938+BYL719 or a saturating insulin concentration. Blot representative of n=3 experiments. f, Time course analysis of 1938-induced pAKTS473 and pS6S240/244 in MCF10A cells in the presence or absence of BYL719. Shown is a representative blot of n=2 independent experiments. g, Time course analysis of insulin- or 1938-induced PI3K/AKT/mTORC1 signalling in A549, n=2 experiments.
Extended data Fig. 4
Extended data Fig. 4. In vitro selectivity profile of 1938 (1 μM) on 133 protein kinases and 7 lipid kinases visualised as a waterfall plot.
In the waterfall plot, the protein and lipid kinases are labeled in black and red, respectively, with the dashed line delineating 25% of kinase inhibition.
Extended data Fig. 5
Extended data Fig. 5. In vitro selectivity profile of 1938 (1 μM) on 133 protein kinases and 7 lipid kinases.
Visualised as a kinome tree using KinMap.
Extended Data Fig. 6
Extended Data Fig. 6. Effect of 1938 on in vitro kinase activity of the PI3K-related kinases ATM and mTORC1 (mTOR/RAPTOR/LST8 complex).
The kinases were incubated at 30°C for 30 min (ATM) or 3 h (mTORC1), with or without 200 μM 1938 in the presence of their respective substrates (GST-p53 for ATM and 4E-BP1 for mTORC1), followed by analysis and quantification as described in Methods. The positive control for ATM was inclusion of the MRN complex (Mre11-Rad50-Nbs1), known to activate ATM, in the kinase reaction. The positive control for mTORC1 was the use of a triple amount of mTORC1 complex in the kinase reaction. Data show individual experiments (n=3), error bars represent mean ± SD.
Extended Data Fig. 7
Extended Data Fig. 7. Phosphoproteomics experimental set-up and control data.
a, Experimental design and workflow of phosphoproteomics experiment. PI3Kα-WT and PI3Kα-KO MEFs were serum-starved overnight, stimulated with DMSO, 1938 (5 μM) or insulin (100 nM) for 15 min or 4 h and processed for phosphoproteomics analysis. 10,611 phosphosites fom 3,093 proteins were analysed by MSstats, the majority of which were pSer and pThr residues. b, Validation of phosphoproteomics conditions. PI3Kα-WT and PI3Kα-KO MEFs were serum-starved overnight and stimulated with DMSO, 1938 (5 μM) or insulin (100 nM) for 15 min or 4 h as indicated. Lysates were immunoblotted with antibodies to pAKTS473, pAKTT308, total AKT, pPRAS40/AKT1S1T247, pS6RPS240/244, S6RP or GAPDH. Samples were from a representative phosphoproteomics experiment. Representative of n=2 independent experiments. c, Volcano plot of phosphosites differentially regulated by 1938 (5 μM) relative to DMSO in PI3Kα-WT MEFs. Note, these data are reproduced, enlarged and labelled from Fig. 4b. Red, upregulated phosphosites, Green, downregulated phospho-sites. Boxed phosphosites have been previously reported to be regulated by PI3K signalling (PhosphoSitePlus). d, Insulin stimulation induces phosphorylation of expected PI3K targets in PI3Kα-WT MEFs. Volcano plot of Log2(fold change) versus -log10(adjusted p-value) for phosphosites differentially regulated by (right) 15 min or (left) 4 h 100 nM insulin treatment in PI3Kα-WT MEFs relative to DMSO-treated cells. e, High experimental reproducibility of phosphoproteomics experiment. Quantified phosphopeptides were analysed within the model-based statistical framework MSstats. Data were log2 transformed, quantile normalised, and a linear mixed-effects model was fitted to the data. The group comparison function was employed to test for differential abundance between conditions. p-values were adjusted to control the FDR using the Benjamini-Hochberg procedure. Multi-scatter plot of the Log2(intensity) of signals obtained from each replicate against the Log2(intensity) of the same sample from all other replicates. Numbers indicate the Pearson correlation coefficient for each pair.
Extended Data Fig. 8
Extended Data Fig. 8. Additional data related to the functional activities of 1938 in cultured cells, tissues and organisms.
a, Time-dependent dose-response of MEFs to 1938 as measured by CellTiter-Glo®. PI3Kα-WT and PI3Kα-KO MEFs were serum starved for 4 h, followed by stimulation with a dose range of 1938 in serum-free media for the indicated time points. Cellular metabolic activity was assessed by measurement of cellular ATP content by CellTiter-Glo®. Luminescence normalised to DMSO-only as 100%. Data shown from 2 individual experiments. b, MEFs were serum-starved overnight, followed by 24h stimulation in serum-free medium with 1938±BYL719, insulin, or culture medium containing 10% FBS, followed by measurement of cell number (crystal violet staining). Data show 2 independent experiments. c, Ex vivo perfused Langendorff rat heart model. Generation of pAKTS473 in ischaemic hearts treated with vehicle, 1938 or insulin upon reperfusion. Rat hearts were perfused for 10 min for stabilization, followed by 45 min global ischaemia and then reperfused for 2 h. During the first 15 min of reperfusion, the buffer contained either vehicle (0.1% DMSO), 1938 (5 μM) or insulin (1 μM). After 2 h, all hearts were freeze-clamped and frozen in liquid nitrogen followed by tissue extraction in RIPA buffer, SDS-PAGE and immunoblotting with the indicated antibodies. The quantification for this blot is shown in Fig. 5d. Statistics: 1-way ANOVA with Tukey’s post test. Each lane contains the extract of an individual heart: vehicle (n=5), 1938 (n=6) or insulin (n=2). d, In vivo perfused mouse heart model. Left panel, area at risk in vehicle- and 1938-treated hearts. Mice were subjected to 40 min coronary artery ligation followed by 2 h reperfusion. 15 min prior to reperfusion, 50 μl of DMSO or 10 mg/kg 1938 in DMSO was administered i.v. Following reperfusion, the hearts were then excised, perfused with Evans Blue, sliced and stained with tetrazolium chloride, prior to blinded assessment of infarct size as a percentage of the total ischaemic “area at risk” (AAR) (this is shown in Fig. 5e).The AAR in each heart is indicated as a % of the total area of the left ventricular (LV) myocardium. Since there was no significant difference in AAR between the two groups (P=0.86), this control measurement demonstrates experimental consistency in suture positioning etc. Statistics: Student’s unpaired 2-sided t-test, data shown as mean±SEM. Right panel, generation of pAKTS473 in ischaemic hearts treated with vehicle or 1938 upon reperfusion. 50 μl of DMSO vehicle or 10 mg/kg 1938 in DMSO was injected i.v. into anaesthetized and intubated mice. After 15 min, the chest was opened, the heart removed and immediately freeze-clamped in liquid nitrogen followed by tissue extraction in RIPA buffer, SDS-PAGE and immunoblotting with the indicated antibodies. Each lane contains the extract of an individual heart of mice treated with vehicle (n=4) or 1938 (n=4). The quantification for this blot is shown in Fig. 5e, right panel.
Extended Data Fig. 9
Extended Data Fig. 9. Additional and control studies for neuro-regeneration experiments.
a, Top panel; Control experiment to test the biological activity of 1938 post-freezing. An aliquot of 100 μM 1938 stock solution in dH2O and vehicle was defrosted and tested for induction of pAKTS473 by 15 min treatment of A549 cells, using insulin (1 μM) or 1938 (10 μM from control stocks in DMSO) as positive controls. Bottom panel; pAKTS473 induction in exposed sciatic nerves, injected with vehicle (autoclaved H2O) or 1938 (from stocks in autoclaved H2O) or bathed in a solution of vehicle or 1938. After 30 min, the nerves were washed and processed for analysis as described in Materials and Methods. Cell extracts of MCF7 breast cancer cells stimulated for 15 min with 5 μM 1938 or vehicle (DMSO) were loaded on the gels as positive controls. n=1 experiment. b, Representative immunohistochemistry images of a transverse section through the distal common peroneal rat nerve, showing ChAT- and neurofilament-positive axons with tissue architecture typical of normal tissue. Scale bar = 50 μm. c, Representative immunohistochemistry images of rat TA muscle, showing a α-BTX-stained post-synaptic neuromuscular structure with associated neurofilament-positive neurons. Scale bar = 20 μm. n=5 animals.
Extended Data Fig. 10
Extended Data Fig. 10. Additional data for methodology.
Left panel, Sanger sequencing of the genomic PIK3CA locus of A549 cell clones subjected to CRISPR/Cas9 gene-targeting. Lower traces: reference genomic PIK3CA sequence (wild-type), with the crispr RNA sequence underlined. Top traces: DNA sequence of CRISPR/Cas9 gene-targeted or control-edited A549 clones. The PIK3CA-KO clone 12 shows a +1 bp insertion (arrow), leading to frameshift and the generation of 2 consecutive premature stop-codons (asterisk) immediately downstream of the +1 bp insertion. Note that the first stop-codon occurs 80 bp upstream from the 3’ exon-exon junction and will therefore result in nonsense-mediated decay of the mRNA. The PIK3CA-WT clone 9 shows wild-type genomic DNA sequence. Right panel, Western blot for p110α using antibody CST#4255.
Fig. 1
Fig. 1. Biochemical mechanism of PI3Kα activation by 1938.
a, Structure of UCL-TRO-1938 (referred to in the text as 1938). b, Effect of the PI3Kα-selective inhibitor BYL719 (500 nM) on 1938-activated PI3K. Enzyme activity in the presence of 1938 only was considered 100%. c, Selectivity of 1938 for PI3Kα over PI3Kβ and PI3Kδ. d, Enzyme kinetics (calculated using kcat function in Prism 8) upon ATP titration on PI3Kα with or without 1938 and pY. e, Membrane binding of PI3Kα shown as FRET signal (I-I0). I, fluorescence intensity at 520 nm, I0, fluorescence intensity at 520 nm in the absence of enzyme. f, Effect of 1938 on PI3Kα catalytic activity in the presence of a saturating dose of pY. g, Effect of 1938 on the catalytic activity of oncogenic mutants of PI3Kα. Data shown as n=2 independent experiments (b,e). Data shown as mean ± SEM, n=6 (c, top), n=4 (c, bottom), n=3. (d,f,g) experiments. Kinetic values in d shown as mean ± SD. Statistical analysis performed with two way ANOVA, Tukey’s multiple comparisons test (c) or Dunnett’s multiple comparisons test (g); one way ANOVA, Dunnett’s multiple comparisons test (f). ****P<0.0001.
Fig. 2
Fig. 2. Structural mechanism of PI3Kα activation by 1938.
a, Structural changes induced by 1938 as assessed by HDX-MS in full-length p110α/p85α, highlighted on the structure of p110α (gray)/niSH2-p85α (green) (pdb:4ZOP). Selection threshhold for significant peptides: a-b difference ≥2.5%, Da difference ≥0.25, p-value <0.05 (unpaired t-test). b, Sigma-weighted density map in blue (2mFo-DFc) for the 1938 ligand (magenta) in the p110α crystal structure. Yellow dashes show predicted H-bonds. c, Crystal structure of 1938 bound to p110α; 1938 (magenta), activation loop (yellow), loop 1002-1016 (kinase/activator interface, slate), predicted H-bonds (yellow dashes). d, Comparison of the 1938-bound p110α with apo-p110α. The 1938-bound structure is shown in cartoon representation, while the apo-model is shown as a superimposed red Cα trace. 1938 shown as magenta blob, PRD-like helix shown in purple. Yellow spheres mark the sites of cancer-associated mutations from the COSMIC database that are near the 1938-binding site (only mutations with >10 reports are shown). Regions showing decreased HDX-MS protection for the common helical domain mutations are colored orange. PIP2 substrate (slate) has been modelled in the active based on 4OVV. A region of the activation loop (thick worm representation, slate) has been taken from 7PG5 since it is disordered in the 1938-bound structure. Slate spheres represent residues important for PIP2 recognition (K942 and R949). Chocolate spheres represent residues essential for phosphate transfer (K776, H917 and H936). A bound ATP (blue) has been modelled based on PDB ID 1E8X. The ATP binding loop is coloured yellow. Phosphates in PIP2 and ATP are shown in red. e, Comparison of 1938-binding pocket in p110α with homologous regions in p110β and p110δ.
Fig. 3
Fig. 3. 1938 activates PI3Kα signalling in cells.
All cells were serum-starved overnight. a, Time-dependent PIP3 generation in MEFs stimulated with 1938, PDGF or insulin. Data shown as mean±SD, n=number of experiments. b, Dose-dependent PIP3 generation by 2 min stimulation with the indicated agonists in MEFs (mean±SD, n=3 experiments except no DMSO (n=1)) and c, A549 cells (n=2 experiments). d, Total internal fluorescence (TIRF) microscopy of 3-phosphoinositide reporter-expressing A549 or HeLa cells treated with DMSO, 1938 and BYL719. Thick lines specify medians; n=number of single cells. A549: PIP3 reporter-expressing PI3Kα-WT or PI3Kα-KO cells, with data from one experiment. HeLa: PIP3- or PI(3,4)P2-reporter cells, with PIP3 and PI(3,4)P2 data representative of 2 and 4 experiments, respectively. Shown below is a representative TIRF image of a PI3Kα-WT A549 cell, imaged 3 min before 1938 addition; 3 min after 1938 addition at t=27 min, and 3 min after BYL719 addition at t=87 min. Scale bar: 11 μm. e, pAKTS473 induction by 15 min treatment with different doses of 1938 in PI3Kα-WT and PI3Kα-KO MEFs. BYL719 (BYL), TGX-221 (TGX) and Parsaclisib (Pars) were used at 0.5 μM, 0.2 μM and 0.05 μM, respectively. Blot representative of n=3 experiments. f, pAKTS473 induction (measured by ELISA) in A549 by a 1938 dose titration or insulin. Data shown as mean ± SEM (n=3 experiments). g, Time course analysis of insulin- or 1938-induced PI3K/AKT/mTORC1 signalling in A549, n=2 experiments. Quantification of pAKTS473/vinculin signal ratio, expressed relative to treatment with DMSO only.
Fig. 4
Fig. 4. Phosphoproteomic analysis of PI3Kα-WT and PI3Kα-KO MEFs
stimulated with 1938 (5 μM) or insulin (100 nM) for 15 min or 4h (n=4 independent experiments). a, Heat map: phosphosites significantly altered by stimulation relative to DMSO treatment. Green boxes, significantly upregulated phosphosites; magenta boxes, significantly downregulated phosphosites; white crosses: phosphosites not detected in a comparison. b, Volcano plot of phosphosites differentially regulated by 1938 (5 μM) in PI3Kα-WT or PI3Kα-KO MEFs, relative to DMSO-treated cells of the same genotype. Note that the PI3Kα-WT volcano plots have been reproduced in enlarged format with labeling of individual proteins and phosphosities in Extended Data Fig. 7c. c, Venn diagram showing overlap of the number of phosphosites significantly regulated by 1938 in PI3Kα-WT MEFs with sites that have been identified previously and are annotated in PhosphoSitePlus as regulated by insulin, IGF-1, LY294002 (pan-PI3K inhibitor) or MK2206 (AKT inhibitor). d, Venn diagrams showing the overlapping number of phosphosites regulated by 1938 and insulin in PI3Kα-WT MEFs.
Fig. 5
Fig. 5. 1938 induces biological responses in cultured cells, explanted tissues and model organisms.
a,b, MEFs were serum-starved overnight, followed by 24h stimulation in serum-free medium with 1938±BYL719, insulin, or culture medium containing 10% FBS, followed by measurement of: a, metabolic activity (ATP content assessed by CellTiter-Glo®), b, cell cycle progression (EdU incorporation). (a,b) show 2 independent experiments. Gating strategies for (b) shown in Supplementary Fig. 2. c, Left, Representative tetrazolium-stained slices of isolated rat hearts (Langendorff model) subjected to 45 min global ischaemia, followed by 2h reperfusion, with administration of DMSO (0.1%) or 1938 (5 μM) during the first 15 min of perfusion. Right, infarct size measured at the end of the 2h reperfusion, in ex vivo hearts administered DMSO (n=6) or 1938 (n=6). Unpaired Student’s t-test. d, pAKTS473 in ex vivo hearts administered DMSO (n=5), 1938 (n=6) or insulin (n=2). 1-way ANOVA with Tukey post-test. e, Impact of 1938 on in vivo heart IRI in mice. Left, infarct size measured following 40 min ischaemia and 2h reperfusion, with DMSO (n=8) or 1938 (n=8) administered 15 min prior to reperfusion. Unpaired Student’s t-test. Right, pAKTS473 in hearts administered DMSO (n=4) or 1938 (n=4). Unpaired Student’s t-test. Data in c-e shown as mean±SEM (n=independent experiments). f, Neurite length in DRG cultures stimulated with 1938±BYL719 for 72h, with representative images of neurons stained with anti-β-III tubulin at 72h. Data represent mean±SEM of n=3 independent experiments. g, Sciatic nerve crush injury (i), arrowhead in (ii) shows resulting lesion. Injury was followed by (iii) direct injection proximal to the injury, of a single dose of dH2O or 1938 (5 μM in sterile H2O) and (iv) minipump implantation for continuous delivery of dH2O or 1938 (100 μM in sterile H2O) for 21 days. h, Motor unit number estimation (MUNE) recordings from the tibialis anterior (TA) muscle. i, Compound muscle action potential (CMAP) recordings in the TA muscle following nerve stimulation proximal to the crush site (percentage of the contralateral side). j, Total number of choline acetyltransferase (ChAT)-positive motor axons in distal common peroneal nerve cross-sections. k, Proportion of neuromuscular junctions (NMJs) re-innervated by axons at the target TA muscle, revealed by α-bungarotoxin (α-BTX) and neurofilament (NF) staining. l, Quantification of total axons (neurofilament) and motor axons (ChAT) in the sciatic nerve at 3 and 6 mm distal to the injury site. For all experiments in h-l: n=5 animals per group, error bars are SD. Two-tailed Student’s t-tests. All data are from the 21 day endpoint.

Comment in

References

    1. Cowan-Jacob SW, Jahnke W, Knapp S. Novel approaches for targeting kinases: allosteric inhibition, allosteric activation and pseudokinases. Future medicinal chemistry. 2014;6:541–561. doi: 10.4155/fmc.13.216. - DOI - PubMed
    1. Astl L, Tse A, Verkhivker GM. Interrogating Regulatory Mechanisms in Signaling Proteins by Allosteric Inhibitors and Activators: A Dynamic View Through the Lens of Residue Interaction Networks. Adv Exp Med Biol. 2019;1163:187–223. doi: 10.1007/978-981-13-8719-79. - DOI - PubMed
    1. Simpson GL, Hughes JA, Washio Y, Bertrand SM. Direct small-molecule kinase activation: Novel approaches for a new era of drug discovery. Curr Opin Drug Discov Devel. 2009;12:585–596. - PubMed
    1. Fang Z, Grutter C, Rauh D. Strategies for the selective regulation of kinases with allosteric modulators: exploiting exclusive structural features. ACS Chem Biol. 2013;8:58–70. doi: 10.1021/cb300663j. - DOI - PubMed
    1. Mobitz H, Jahnke W, Cowan-Jacob SW. Expanding the Opportunities for Modulating Kinase Targets with Allosteric Approaches. Curr Top Med Chem. 2017;17:59–70. doi: 10.2174/1568026616666160719165314. - DOI - PubMed

Publication types

MeSH terms