. 2023 Jun;618(7963):169-179.
doi: 10.1038/s41586-023-06091-8. Epub 2023 May 24.

Programming inactive RNA-binding small molecules into bioactive degraders

Affiliations

Programming inactive RNA-binding small molecules into bioactive degraders

Yuquan Tong et al. Nature. 2023 Jun.

Abstract

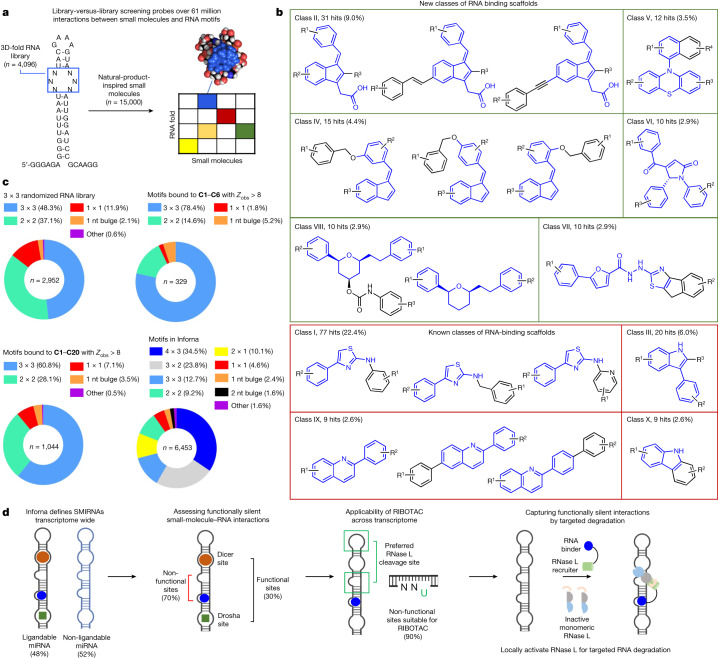
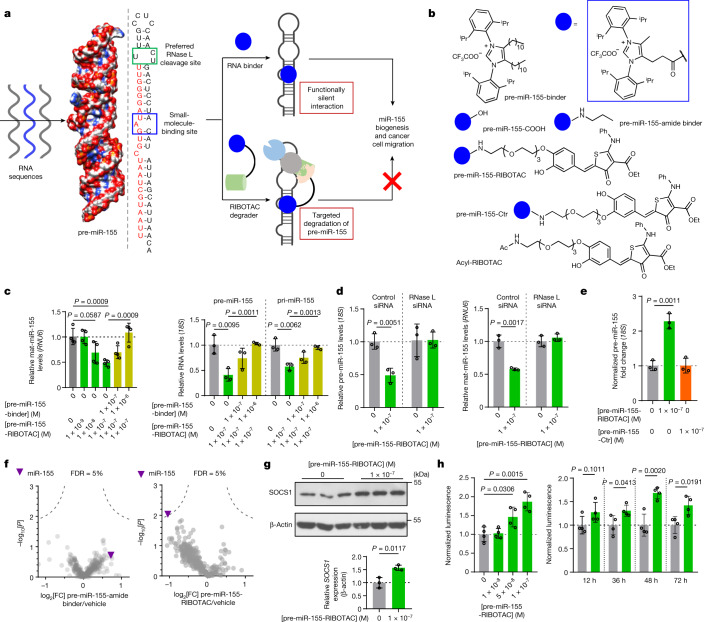
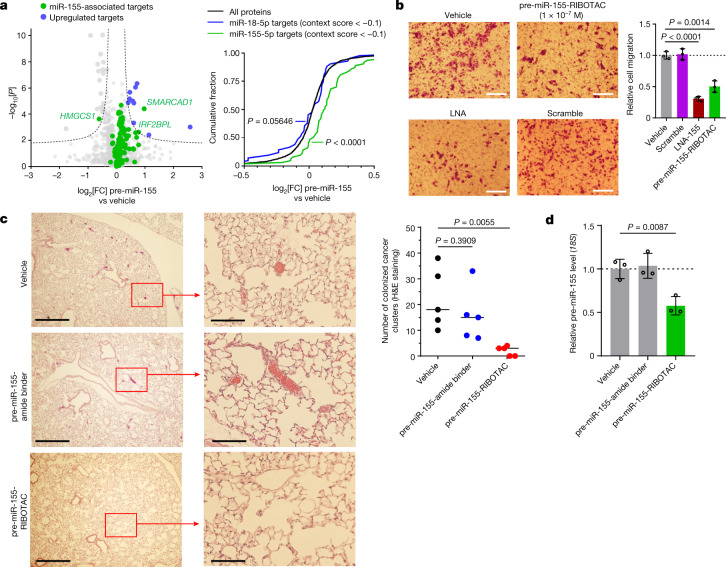
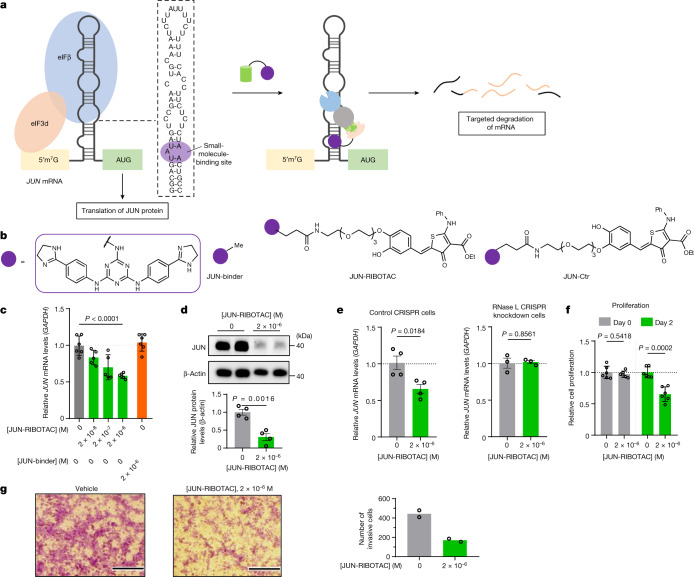
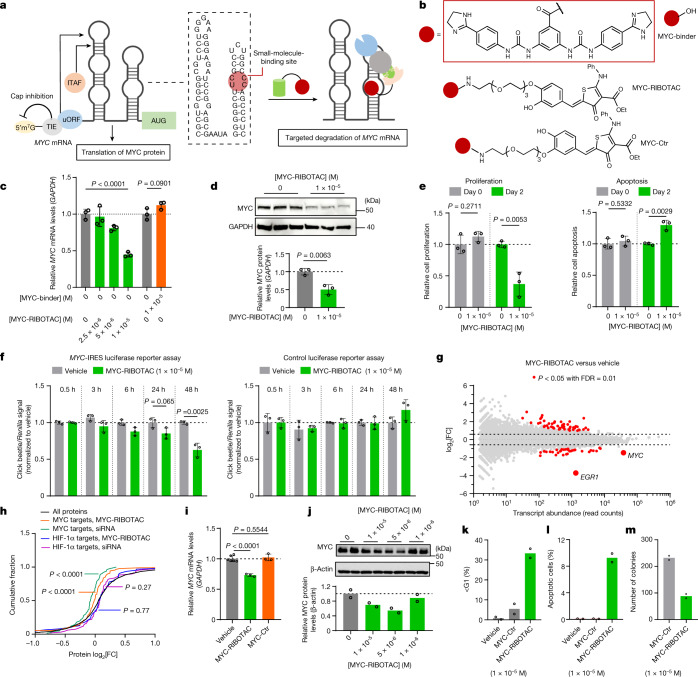
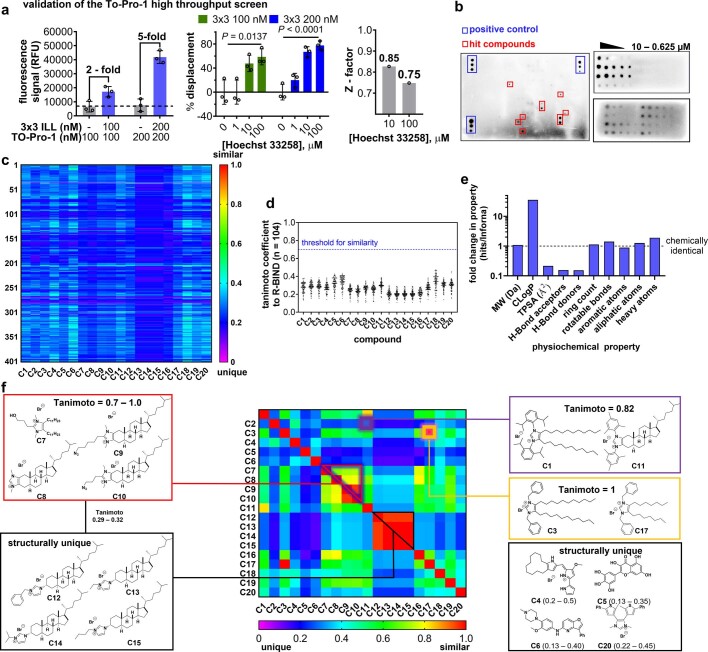
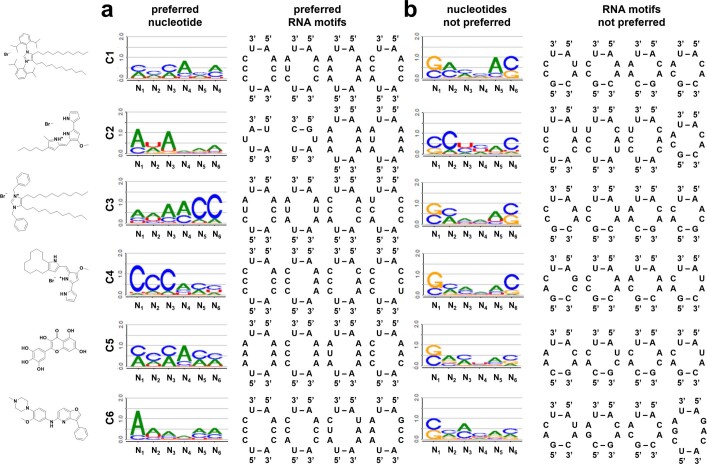
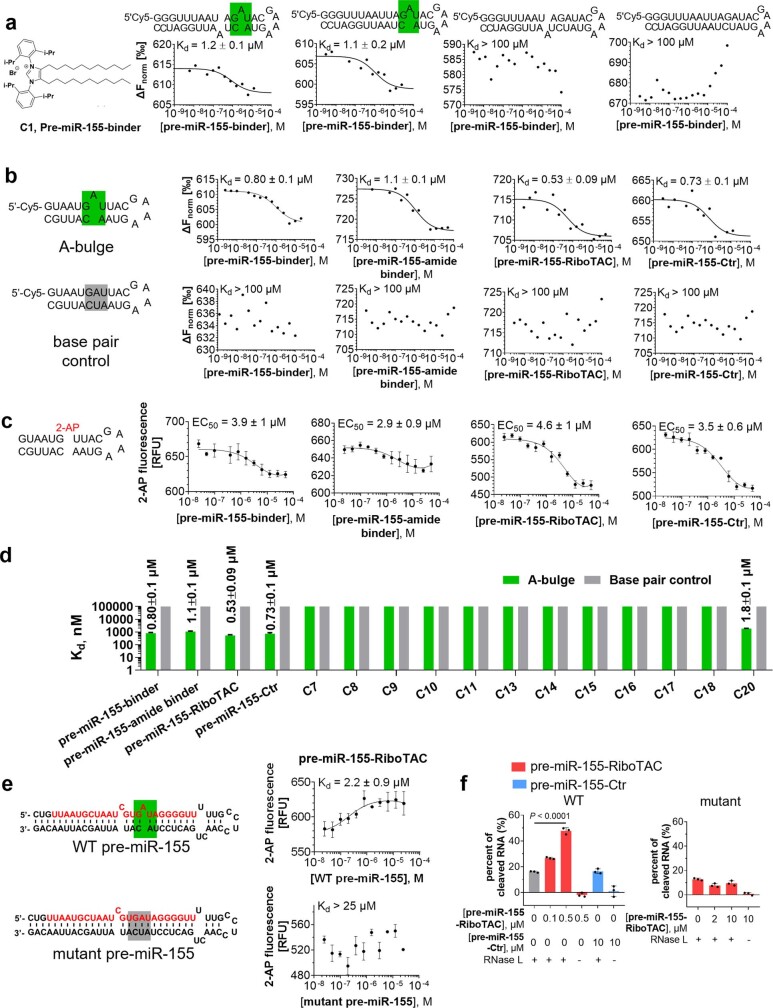
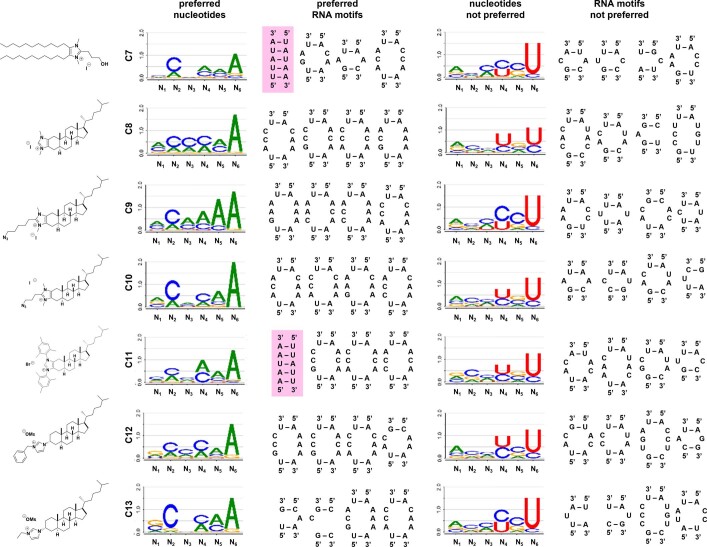
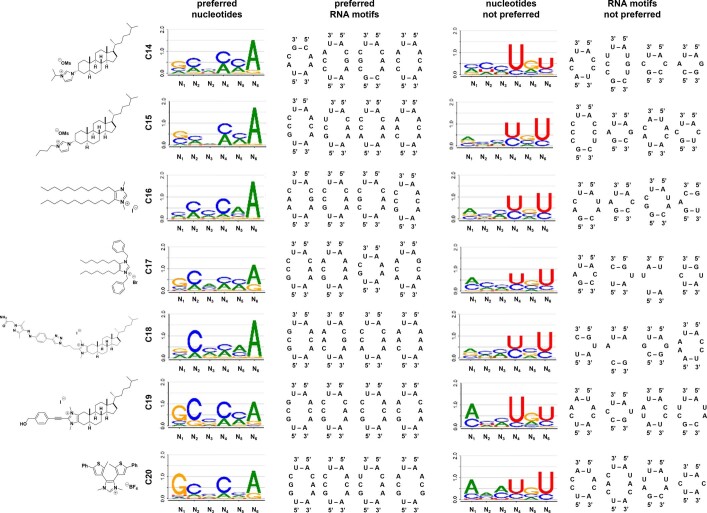
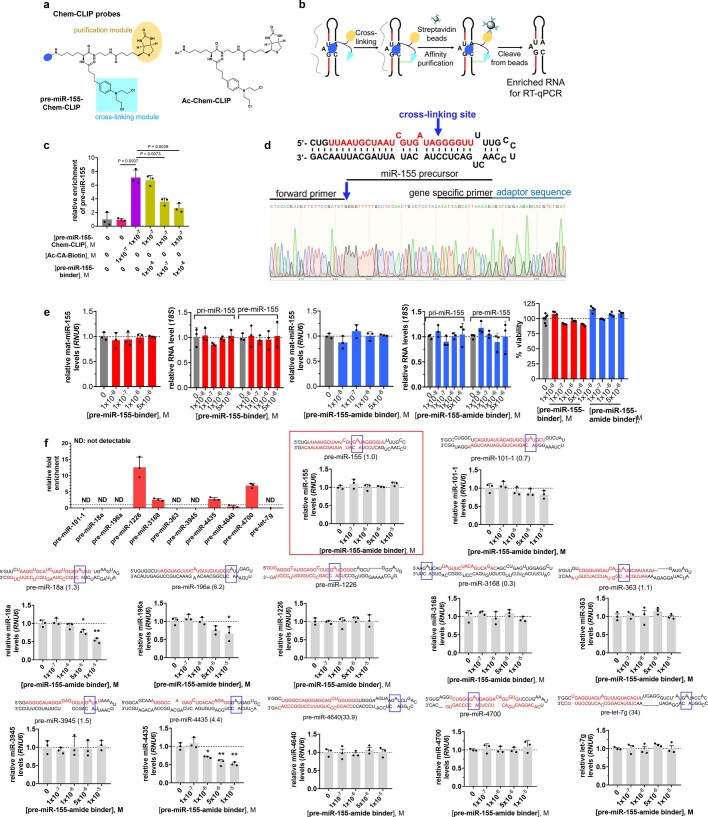
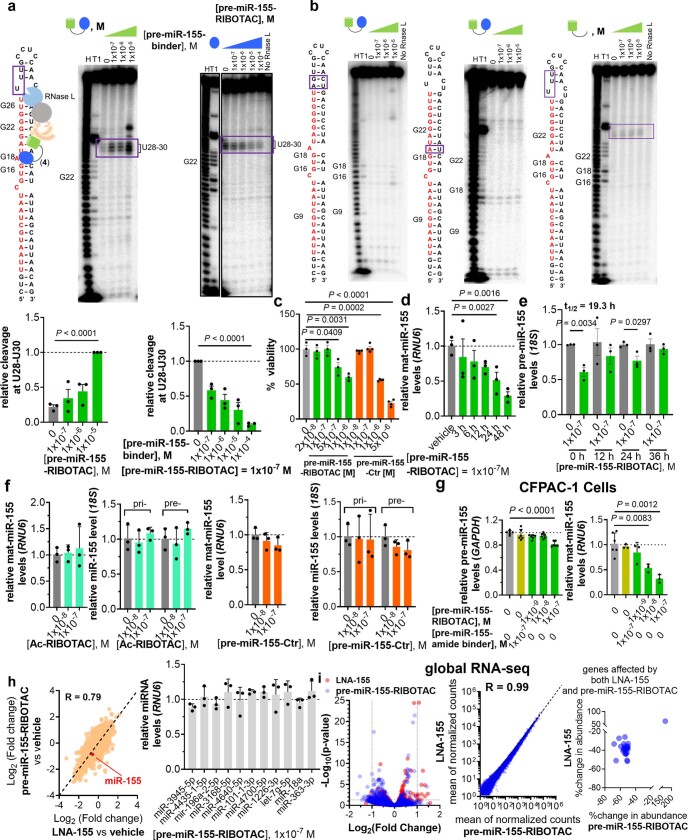
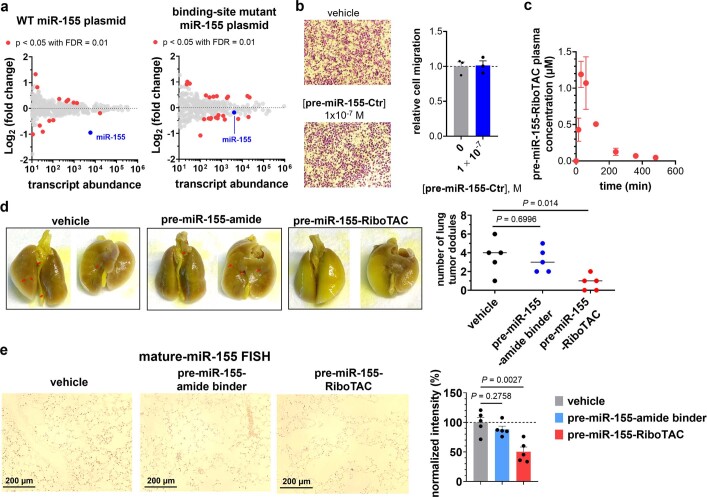
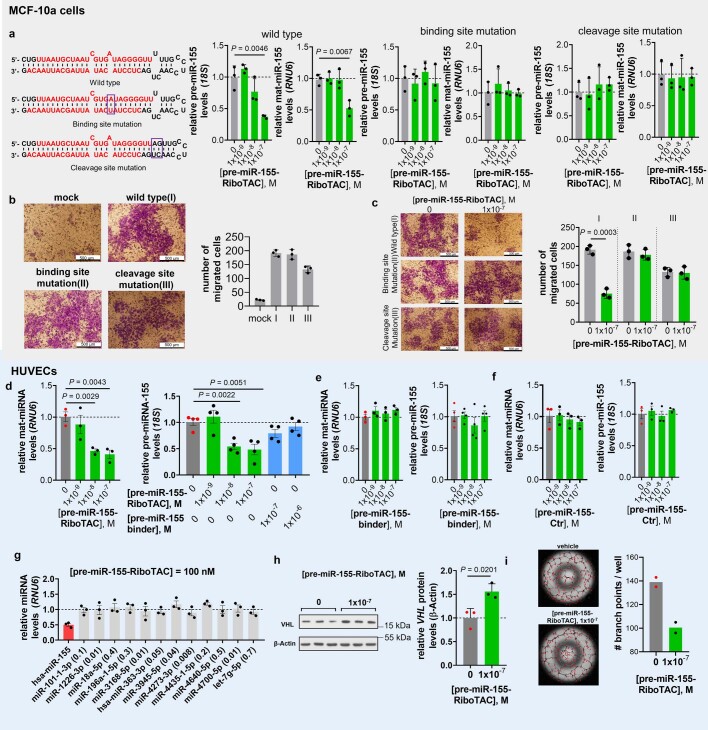
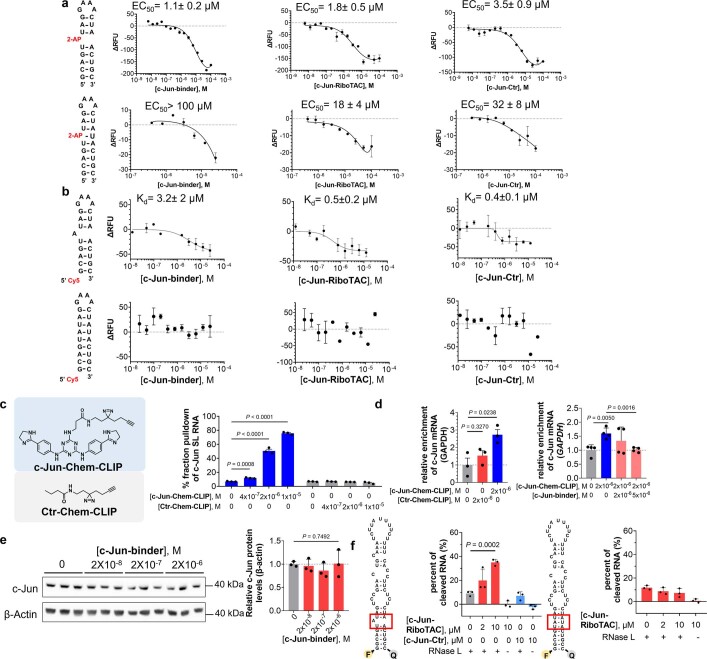
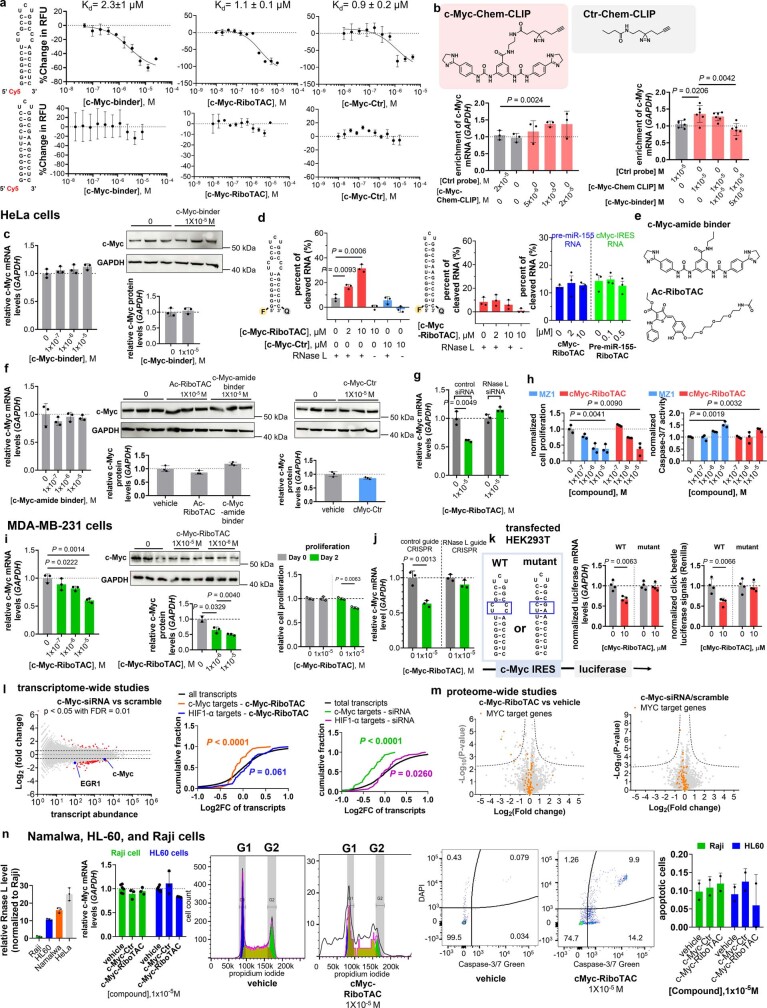
Target occupancy is often insufficient to elicit biological activity, particularly for RNA, compounded by the longstanding challenges surrounding the molecular recognition of RNA structures by small molecules. Here we studied molecular recognition patterns between a natural-product-inspired small-molecule collection and three-dimensionally folded RNA structures. Mapping these interaction landscapes across the human transcriptome defined structure-activity relationships. Although RNA-binding compounds that bind to functional sites were expected to elicit a biological response, most identified interactions were predicted to be biologically inert as they bind elsewhere. We reasoned that, for such cases, an alternative strategy to modulate RNA biology is to cleave the target through a ribonuclease-targeting chimera, where an RNA-binding molecule is appended to a heterocycle that binds to and locally activates RNase L1. Overlay of the substrate specificity for RNase L with the binding landscape of small molecules revealed many favourable candidate binders that might be bioactive when converted into degraders. We provide a proof of concept, designing selective degraders for the precursor to the disease-associated microRNA-155 (pre-miR-155), JUN mRNA and MYC mRNA. Thus, small-molecule RNA-targeted degradation can be leveraged to convert strong, yet inactive, binding interactions into potent and specific modulators of RNA function.


Conflict of interest statement

M.D.D. is a founder of and consultant for Expansion Therapeutics. M.D.D. and J.L.C.-D. are founders of Ribonaut Therapeutics. Various aspects of these studies are the subject of a patent including US20160188791/WO2015021415 and US20220073910/WO2020167811 as well as disclosure numbers S-T00010US003 and S-T00014US002.

Figures

Fig. 1
Fig. 1. Library-versus-library screening defines new RNA-binding small molecules and druggable targets.
a, 2DCS analysis of more than 61 million theoretical interactions, identifying new interactions between small molecules and RNA motifs. b, The newly identified small-molecule RNA binders (n = 344) included 156 different scaffolds that fall into 79 major classes based on scaffold similarities. Among the top 10 most abundant classes (collectively covering 59.6% of all hits), six are new classes (green). c, Motif distribution from a 3 × 3 randomized RNA library used for 2DCS screening. As expected, 3 × 3 and 2 × 2 internal loops comprise the majority (85.4% total) of the library. Motifs that bound to C1C6 showed a significant enrichment for 3 × 3 internal loops (P < 0.001) and one-nucleotide bulges (P < 0.001). A total of 1,044 motifs bound to C1C20 with Zobs > 8. Preference for 3 × 3 internal loops and one-nucleotide bulges was collectively observed for these compounds. Of these 1,044 motifs, only 23 (2.2%) are present in highly expressed human transcripts (n = 2,712 total motifs), and 375 are new motifs with no previously known small-molecule binder. Inforna contains over 100,000 RNA–small molecule interactions and 6,453 unique RNA motifs of various types. d, Although around 6% of all miRNAs can be bound by C1C6, only about 30% of targetable sites within them are functional (Drosha or Dicer processing site) and are therefore predicted to induce a biological effect. The other approximately 70% are unproductive interactions that are predicted to be biologically silent. We identified that 48% of miRNAs that have ligandable non-functional sites are potential substrates for RNase L, which could be targeted by RIBOTACs. Thus, biologically inert binders can be converted into bioactive RIBOTACs that provoke targeted degradation. Statistical significance referred to in c was calculated using two-tailed Student’s t-tests.
Fig. 2
Fig. 2. Pre-miR-155-RIBOTAC selectively degrades pre-miR-155 in an RNase-L-dependent manner in breast cancer cells.
a, Schematic of converting an inert binder engaging pre-miR-155 into an active RIBOTAC degrader. b, Structures of the compounds used to target pre-miR-155. c, The effects of pre-miR-155-RIBOTAC on mature (mat) (n = 4 biological replicates), pre- (n = 3 biological replicates) and pri- (n = 3 biological replicates) miR-155 levels, competed by increasing concentrations of pre-miR-155-binder in MDA-MB-231 cells. d, The effect of siRNA knockdown of RNase L on pre-miR-155-RIBOTAC-mediated cleavage of pre-miR-155 in MDA-MB-231 cells, as determined using RT–qPCR. n = 3 biological replicates. e, Immunoprecipitation of pre-miR-155 using an anti-RNase L antibody in the presence of pre-miR-155-RIBOTAC in MDA-MB-231 cells (n = 3 biological replicates). f, The effect of pre-miR-155-amide-binder (left; 100 nM; n = 4 biological replicates) and pre-miR-155-RIBOTAC (right; 100 nM; n = 3 biological replicates) on the levels of the 373 miRNAs expressed in MDA-MB-231 cells. FC, fold change. g, Western blot analysis of SOCS1, a direct target of miR-155, after treatment of MDA-MB-231 cells with pre-miR-155-RIBOTAC (n = 3 biological replicates). h, The effect of pre-miR-155-RIBOTAC on the activity of a SOCS1 3′ UTR-luciferase reporter transfected into HEK293T cells, establishing both dose (left) and time dependence (right; n = 4 biological replicates). Data are mean ± s.d. (ce, g and h). Statistical significance was determined using two-tailed Student’s t-tests (ce, g and h) or a Wald’s test (f). Source data
Fig. 3
Fig. 3. Pre-miR-155-RIBOTAC selectively degrades pre-miR-155 and reduces lung colonization in vivo.
a, Left, proteome-wide changes in MDA-MB-231 cells treated with pre-miR-155-RIBOTAC (100 nM) versus vehicle (n = 3 biological replicates). Right, pre-miR-155-RIBOTAC significantly upregulated miR-155 related proteins (n = 98 proteins), as indicated by a Kolmogorov–Smirnov analysis (right) of their levels versus all proteins (n = 3 biological replicates). b, The effect of pre-miR-155-RIBOTAC on MDA-MB-231 cell migration (n = 3 biological replicates); 2 fields of view were quantified per replicate. Scale bars, 0.5 mm. c, pre-miR-155-RIBOTAC suppresses lung colonization in vivo, as determined by counting lung nodules (n = 5 mice) and by haematoxylin and eosin (H&E) staining (n = 5 mice; 2 fields of view were quantified per replicate). Scale bars, 1 mm (left) and 0.2 mm (right). d, The effect of pre-miR-155-amide-binder and pre-miR-155-RIBOTAC on pre-miR-155 levels in vivo, as determined by RT–qPCR using primers selective for human pre-miR-155 (n = 3 mice). Data are mean ± s.d. (b and d). Statistical significance was determined using a Wald’s test (a) or two-tailed Student’s t-tests (bd). Source data
Fig. 4
Fig. 4. JUN-RIBOTAC impairs pancreatic tumour cell proliferation and migration by selectively degrading JUN mRNA.
a, Schematic of JUN degradation by targeting the JUN IRES. b, The structures of compounds used to target JUN mRNA. c, The effect of JUN-RIBOTAC and JUN-binder on JUN mRNA levels in MIA PaCa-2 cells after treatment for 72 h, as determined using RT–qPCR (n = 6 biological replicates). d, The effect of JUN-RIBOTAC on JUN protein levels in MIA PaCa-2 cells (n = 4 biological replicates). e, The effect of JUN-RIBOTAC on JUN mRNA levels in MIA PaCa-2 cells in which RNase L was knocked down by CRISPR (n = 3 biological replicates) and in the corresponding MIA PaCa-2 control cell line in which CRISPR editing was performed using a scrambled guide RNA (n = 4 biological replicates), as determined using RT–qPCR. f, The effect of JUN-RIBOTAC on the proliferation of MIA PaCa-2 cells (n = 6 biological replicates). g, The effect of JUN-RIBOTAC on the invasiveness of MIA PaCa-2 cells, as determined using a Boyden chamber assay (n = 2 biological replicates; 2 fields of view were quantified per replicate). Data are mean ± s.d. (cf). Statistical significance was determined using two-tailed Student’s t-tests (df) and one-way analysis of variance (ANOVA) adjusted for multiple comparisons (c). Source data
Fig. 5
Fig. 5. MYC-RIBOTAC selectively targets MYC in an RNase-L-dependent manner.
a, Schematic of the targeted degradation of the MYC IRES. b, Compound structures. c, The effect of MYC-binder and MYC-RIBOTAC on MYC mRNA levels in HeLa cells, as determined using RT–qPCR. n = 3 biological replicates. d, The effect of MYC-RIBOTAC on MYC protein levels in HeLa cells (n = 3 biological replicates). e, The effect of MYC-RIBOTAC on the proliferation (left) and apoptosis (right) of HeLa cells (n = 3 biological replicates). f, The effect of MYC-RIBOTAC on MYC IRES luciferase reporter in HEK293T cells (left) or on a control reporter lacking the IRES (right)(n = 3 biological replicates). g, Transcriptome-wide changes in HeLa cells treated with MYC-RIBOTAC (10 μM) after treatment for 48 h (n = 3 biological replicates). EGR1 is a well-known downstream target of MYC. h, Cumulative distribution analysis of the effect of MYC-RIBOTAC and a MYC-selective siRNA on 87 well-validated downstream targets of MYC, or on the downstream targets of HIF-1α, as indicated by a Kolmogorov–Smirnov analysis of their levels relative to all proteins (n = 3 biological replicates). i, The effect of MYC-Ctr and MYC-RIBOTAC on MYC mRNA levels in Namalwa Burkitt lymphoma cells (n = 3 biological replicates) compared with the vehicle (n = 6 biological replicates). j, The effect of MYC-RIBOTAC on MYC protein levels in Namalwa cells (n = 2 biological replicates). k, The effect of MYC-RIBOTAC on the cell cycle of Namalwa cells. n = 2 biological replicates. l, The ability of MYC-RIBOTAC or MYC-Ctr to induce apoptosis of Namalwa cells (n = 2 biological replicates). m, The effect of MYC-RIBOTAC on colony formation of Namalwa cells (n = 2 biological replicates). Data are mean ± s.d. (cf and i). Statistical significance was determined using a one-way ANOVA adjusted for multiple comparisons (c), two-tailed Student’s t-tests (di), Wald’s test (g), or Kolmogorov–Smirnov test (h). Source data
Extended Data Fig. 1
Extended Data Fig. 1. To-Pro-1 dye displacement assay validation and newly identified small molecules that bind RNA are chemically dissimilar from previously known RNA binders.
a, To-Pro assay optimization and validation. Optimization of the signal to noise ratio of To-Pro-1 dye displacement from an RNA 3×3 internal loop library (3×3 ILL) by altering the concentration of the dye and the RNA (left; n = 3 independent replicates). Validation using Hoechst 33258 as a positive control to displace To-Pro-1 (middle; n = 3 independent replicates). Z-factor analysis of the screening conditions using 10 and 100 µM Hoechst 33258 (right). For each concentration, n = 690 in a single independent experiment. Data are reported as the mean ± SD. b, AbsorbArray screening with a 5’-32P-labelled 3×3 ILL. Compounds were delivered to the array surface in dose response (200 nL of 10 – 0.625 mM, log2 dilutions). c, Heat map of the Tanimoto analysis of 404 molecules found within Inforna show that C1–C20 are chemically dissimilar to known RNA-binding matter. d, Average chemical similarity of C1C20 to compounds within the R-BIND database (n = 104 unique compounds). e, Comparison of the physicochemical properties of C1–C20 and molecules housed within Inforna. The compounds identified herein are chemically distinct, having ~35-fold higher CLogP, an ~20% reduction in polar surface area (TPSA), and an ~15% reduction in the number of both H-bond donors and acceptors,,. f, Unique chemical patterns indicate chemically similar compounds within the azolium scaffold. Compounds C7–C10 have a Tanimoto scores ranging from 0.7 to >0.995 and cluster together. Compounds C12C15 are nearly chemically identical as they share the cholesterol-derived azolium core, differing only by the other N-substituent. However, when compared to the remaining compounds (C1–C11 and C16–C20), their Tanimoto score ranges from 0.29–0.32, indicating they are unique among the hits obtained. C1 and C11 exhibit high similarity (Tanimoto coefficient = 0.82), although they appear very different structurally. This could be due to their similar spatial orientations, as both have alkyl substituted benzenes on their azolium cores. Compounds C4, C5, C6, and C20 are structurally unique compared to all other hits. Source data
Extended Data Fig. 2
Extended Data Fig. 2. LOGO analyses for C1 – C6, showing both preferred and discriminated sequences and structures.
a, LOGO analysis of the selected RNAs in the top 0.5% of Zobs and the secondary structures of the selected RNAs with the four highest Zobs values. b, LOGO analysis of RNAs discriminated against by each small molecule, i.e., in the bottom 0.5% of Zobs, and the secondary structures of the RNAs discriminated against with the four lowest Zobs values. Interestingly, many have GC closing base pairs and are 2×2 nucleotide internal loops. Similarities and differences were found amongst the small molecules. For example, within the azolium scaffold, C1 prefers C at positions one and three and A at positions four and six (that is, internal loops with two Cs opposite two As), while C3, which differs by the substituents on the azolium core, prefers A at positions one, three and four, but C at positions six. Interestingly, C1C6, despite their chemical differences in scaffolds, all discriminate against a 5’ GC closing base pair (G and C at positions one and six, respectively).
Extended Data Fig. 3
Extended Data Fig. 3. In vitro characterization of pre-miR-155-binder and its derivatives for pre-miR-155’s A bulge.
a, Representative binding curves of pre-miR-155-binder and two A bulges identified from the 2DCS selection and a fully based paired control, as determined by microscale thermophoresis (MST). The bulge found in pre-miR-155 is highlighted in green. b, Representative binding curves for pre-miR-155-binder and its derivatives for a minimized A bulge construct or fully paired mutant, as determined by MST. c, Representative binding curves for pre-miR-155-binder and its derivatives and pre-miR-155’s A bulge labelled with 2-aminopurine (2AP) or a fully base paired control (n = 2 independent experiments). d, Summary of Kds of pre-miR-155-binder analogues and other imidazolium salts identified by 2DCS. The affinity of C19 for the A bulge was undetermined due to its aggregation under assay conditions. e, Wild type pre-miR-155 but not the AU based paired mutant RNA can compete the binding of pre-miR-155-RiboTAC (5 µM) to 2AP labelled RNA (1 µM) with a Kd of 2.2 ± 0.9 μM (n = 2 independent experiments). f, pre-miR-155-RiboTAC induces in vitro RNA cleavage with wild-type (WT) pre-miR-155 construct (left), while no cleavage with mutated base pair control (right) (n = 3 independent experiments). All data are reported as the mean ± S.D. of independent replicates. All p-values were calculated using a two-tailed Student’s t-test. Source data
Extended Data Fig. 4
Extended Data Fig. 4. LOGO analyses for preferred and discriminated sequences for C7–C13.
Interestingly, ten of the 14 azoliums share a tetradecahydro-1H-cyclopenta[a]phenanthrene substituent, six of which are fused to the azolium (Supplementary Table 1). In general, all 7 compounds prefer loops with Cs and As, with a strong preference for A in the sixth position, with degree of preference at each position unique to each compound. Likewise, all 7 compounds discriminate against loops with Us, particularly in the sixth position. Left, LOGO analysis of the selected RNAs in the top 0.5% of Zobs and the secondary structures of the selected RNAs with the four highest Zobs values for compounds C7C13. Generally, these compounds prefer motifs rich in C and A residues, with position 6 almost exclusively A. Similar to C1C6, 3×3 internal loops predominate for C7C20 (75%) (p < 0.001, as compared to its distribution in 3×3 ILL), with single nucleotide bulges and 1×1 and 2×2 internal loops comprising 14%. Interestingly, C7 and C11 prefer to bind AU base pairs (pink box). Right, LOGO analysis of RNAs discriminated against by each small molecule, i.e., in the bottom 0.5% of Zobs, and the secondary structures of the RNAs discriminated against with the four lowest Zobs values for compounds C7C13. Motifs that are discriminated against for binding are significantly enriched for single nucleotide bulges (18%) (p < 0.001, as compared to its distribution in 3×3 ILL) and 1×1 nucleotide internal loops (29%) (p < 0.001, as compared to its distribution in 3×3 ILL), with position 6 predominately U. Notably, C1 lacks the strong preference for A at position 6.
Extended Data Fig. 5
Extended Data Fig. 5. LOGO analyses for preferred and discriminated sequences for C14 – C20.
Left, LOGO analysis of the selected RNAs in the top 0.5% of Zobs and the secondary structures of the selected RNAs with the four highest Zobs values for compounds C14C20. Generally, these compounds prefer motifs rich in C and A residues, with position 6 almost exclusively A. Similar to C1C6, 3×3 internal loops predominate for C7C20 (75%) (p < 0.001, as compared to its distribution in 3×3 ILL), with single nucleotide bulges and 1×1 and 2×2 internal loops comprising 14%. Right, LOGO analysis of RNAs discriminated against by each small molecule, i.e., in the bottom 0.5% of Zobs, and the secondary structures of the RNAs discriminated against with the four lowest Zobs values for compounds C1–C20. Preferred sequences for C14–C20 are rich in C and A, with positions 1 and 6 preferred as G and A, respectively. Two of the azoliums, C16 and C17, are the most similar to C1; in C16, the substituted phenyls in C1 are replaced with methyl groups, while in C17, the alkyl chains have been shortened from C15 to C7 and the 1,3-diisopropyl-2-methyphenyl groups have been replaced with benzyl groups. Like the other azolium salts, LOGO analyses of these three compounds revealed a preference for C and A nucleotides, with positional differences for all three molecules.
Extended Data Fig. 6
Extended Data Fig. 6. pre-miR-155-binder and derivatives directly engage pre-miR-155 and other A bulge containing miRNA precursors in MDA-MB-231 cells and in vitro.
a, The Chem-CLIP probe for target validation studies (pre-miR-155-Chem-CLIP) was synthesized by conjugating pre-miR-155-COOH to chlorambucil (CA; cross-linking module; blue triangle) and biotin (pull-down module; yellow circle). A control Chem-CLIP probe, Ac-CA-biotin, comprises the cross-linking and pull-down module but lacks the RNA-binding module and accounts for non-selective reaction of the CA module. b, Chem-CLIP is a proximity-based reaction driven by the RNA-binding module. Following treatment, total RNA is isolated and purified with streptavidin beads and analysed by RT-qPCR. c, Results of target validation studies in MDA-MB-231 breast cancer cells. Cells were treated with either Ac-CA-Biotin (100 nM) or pre-miR-155-Chem-CLIP (100 nM). Enrichment of pre-miR-155 in the pulled-down fraction, as compared to the starting cell lysate, was quantified by RT-qPCR (left). Co-treatment with pre-miR-155-Chem-CLIP and pre-miR-155-binder resulted in dose dependent depletion of pre-miR-155 in the pull-down fraction, indicating that the Chem-CLIP probe and the simple binding compound pre-miR-155-binder occupy the same site (n = 3 biological replicates). d, pre-miR-155-Chem-CLIP cross-links to pre-miR-155 at a nucleotide 5 bp from the A bulge binding site (indicated with a blue arrow in the secondary structure), identified by in vitro Chem-CLIP-Map-Seq. e, Effect of pre-miR-155-binder (red; left) and pre-miR-155-amide-binder (blue; middle) (n = 3 biological replicates) on pri-, pre-, and mature miR-155 levels as well as the two compounds’ effects on cellular viability (right) (n = 4 biological replicates). f, Chem-CLIP analysis (100 nM pre-miR-155-Chem-CLIP) of miRNA precursors that have the same bulge as pre-miR-155 bound by pre-miR-155-binder (n = 3 biological replicates) where ND indicates that the miRNA was not detectable in the pulled down fraction. Effect of pre-miR-155-amide-binder (0.1 to 10 μM) on the levels of miRNAs that contain the A bulge in miR-155, as determined by RT-qPCR (n = 3 biological replicates). Pre-miR-155-RiboTAC (100 nM) has no effect on the levels of mature RNAs that share C1’s A bulge in miR-155 (Extended Data Fig. 6h). All data are reported as the mean ± S.D. All p-values were calculated using a two-tailed Student’s t-test. Source data
Extended Data Fig. 7
Extended Data Fig. 7. In vitro and cellular activities of pre-miR-155-RiboTAC and its derivatives.
a, left: Representative gel autoradiogram of the cleavage of 5′-[32P]-pre-miR-155 by RNase L induced by pre-miR-155-RiboTAC and quantification thereof (IC50 = ~100 nM; n = 3 independent replicates); right: Representative gel autoradiogram of the pre-miR-155-RiboTAC-induced cleavage of pre-miR-155 as a function of pre-miR-155-binder concentration (IC50 = 1.9 ± 0.5 µM), demonstrating pre-miR-155-binder and pre-miR-155-RiboTAC bind the same site, and the corresponding quantification thereof (n = 3 independent replicates). b, Representative gel autoradiogram of (left to right): RNase L cleavage of cleavage site mutant of pre-miR-155 induced by pre-miR-155-RiboTAC; RNase L cleavage of the binding site mutant pre-miR-155 induced by pre-miR-155-RiboTAC; and RNase L cleavage of WT pre-miR-155 induced by Ac-RiboTAC, which lacks the RNA-binding module (n = 3 independent replicates). For panels a and b, “H” indicates a hydrolysis ladder while “T1” indicates treatment with RNase T1, which cleaves guanosine nucleotides. c, Effect of pre-miR-155-RiboTAC (n = 3 biological replicates) or pre-miR-155-Ctr (n = 4 biological replicates) on the viability of MDA-MB-231 cells following a 48 h treatment, as assessed by WST-1 assay. d, pre-miR-155-RiboTAC (single dose) reduces mature miR-155 levels in MDA-MB-231 cells in a time-dependent manner (n = 3 biological replicates). e, Duration of pre-miR-155-RiboTAC’s effect on pre-miR-155’s levels after a 48 h treatment (wash out experiment; n = 3 biological replicates). The compound-containing medium was removed after the treatment period, and total RNA was harvested at the indicated times post-treatment, affording a t1/2 = 19.3 h. The observed half-life is in accord with reported half-lives of miR-155, which range from 12.4–28 h. f, Effect of Ac-RiboTAC (green), the RNase L recruiter lacking the RNA-binding module, and pre-miR-155-Ctr (red), a chimera with the less active regioisomer of the RNase L recruiter, on miR-155 biogenesis after a 48 h treatment as determined by RT-qPCR (n = 3 biological replicates). g, Effect of pre-miR-155-RiboTAC and pre-miR-155-binder on pre-miR-155 (left; n = 6 biological replicates) and mature miR-155 (right; n = 3 biological replicates for compound-treated cells; n = 6 biological replicates for vehicle-treated) levels in CFPAC-1 (pancreatic ductal adenocarcinoma) cells, as determined by RT-qPCR. h, Correlation of miRNome-wide changes of MDA-MB-231 cells treated with pre-miR-155-RiboTAC (100 nM) or LNA-155 (50 nM) (n = 3 biological replicates). Comparison of normalized read counts for each miRNA between pre-miR-155-RiboTAC and LNA-155 treatment (left). Effect of pre-miR-155-RiboTAC (100 nM, n = 3 biological replicates) on other miRNAs sharing the targeted A bulge (right). i, Correlation of transcriptome-wide changes of MDA-MB-231 cells treated with pre-miR-155-RiboTAC (100 nM) or LNA-155 (50 nM) (n = 3 biological replicates). From left to right: (i) Volcano plot of transcriptome-wide changes of MDA-MB-231 cells treated with pre-miR-155-RiboTAC (100 nM) vs. vehicle and LNA-155 (50 nM) vs. vehicle after a 48 h treatment period; (ii) comparison of normalized read counts for each gene between pre-miR-155-RiboTAC and LNA-155 treatment; (iii) comparison of normalized % change for genes commonly affected by both pre-miR-155-RiboTAC and LNA-155 treatment (n = 26 genes, right). All data are reported as the mean ± S.D. All p-values were calculated using a two-tailed Student’s t-test. Source data
Extended Data Fig. 8
Extended Data Fig. 8. Cellular and in vivo activity of pre-miR-155-RiboTAC and its derivatives.
a, Effect of pre-miR-155-RiboTAC (100 nM) on the miRNome of MDA-MB-231 cells forced to express WT pre-miR-155 (left; n = 3 biological replicates); and effect of pre-miR-155-RiboTAC (100 nM) on the miRNome of MDA-MB-231 cells forced to express the binding site mutant of pre-miR-155 (right; n = 3 biological replicates). b, Effect of pre-miR-155-Ctr on the migration of MDA-MB-231 cells (n = 3 biological replicates). c, Drug Metabolism and Pharmacokinetics (DMPK) analysis of pre-miR-155-RiboTAC in C57BL/6 mice (n = 3 mice per time point). d, In vivo treatment of pre-miR-155-RiboTAC (1 mg/kg, q.o.d., 30 days) decreased the number of lung nodules (nodules indicated in red) stained with Bouin’s solution (n = 5 mice). e, Lung tissue treated with pre-miR-155-RiboTAC, but not pre-miR-155-amide binder, exhibited decreased mature miR-155 levels, as determined by FISH (n = 5 mice). All data are reported as the mean ± S.D. Statistical significance was indicated by a Walds test (a) or two-tailed Student’s t-test (b-e). Source data
Extended Data Fig. 9
Extended Data Fig. 9. Cellular activity of pre-miR-155-RiboTAC in MCF-10a cells overexpressing miR-155 and in HUVECs.
a, Effect of pre-miR-155-RiboTAC on pre- and mature miR-155 in MCF-10a cells forced to express wild-type pre-miR-155, a binding site mutant of pre-miR-155 (A bulge to AU base pair), or a RNase L cleavage site mutant (pyrimidine-rich asymmetric loop mutated to base pairs) (n = 3 biological replicates). b, Forced expression of pre-miR-155, a mutant pre-miR-155 in which pre-miR-155-binder’s binding site has been mutated, or a mutant pre-miR-155 in which the RNase L cleavage site has been abolished enhances the migratory nature of MCF-10a cells, a model of healthy breast epithelium (n = 3 biological replicates). c, pre-miR-155-RiboTAC impairs the migration of MCF-10a cells forced to express WT pre-miR-155 but not those forced express the binding site or cleavage site mutants (n = 3 biological replicates). d, left: Effect of pre-miR-155-RiboTAC on mature miR-155 levels in HUVECs, as determined by RT-qPCR (n = 3 biological replicates). right: Effect of pre-miR-155-binder on the cleaving capacity of pre-miR-155-RiboTAC, as assessed by measuring pre-miR-155 levels by RT-qPCR (n = 4 biological replicates). e, Effect of pre-miR-155-binder on mature and pre-miR-155 levels in HUVECs, as determined by RT-qPCR (n = 3 biological replicates for mature miR-155; n = 4 biological replicates for pre-miR-155). f, Effect of control RiboTAC pre-miR-155-Ctr on mature and pre-miR-155 levels in HUVECs, as determined by RT-qPCR (n = 3 biological replicates). g, Effect of pre-miR-155-RiboTAC (100 nM) on the levels of mature miRNAs that harbour miR-155’s A bulge in their precursors in HUVECs, as determined by RT-qPCR (n = 3 biological replicates). h, Representative Western blot and quantification thereof of the effect of pre-miR-155-RiboTAC on pre-miR-155’s downstream target, Von-Hippel Lindau (VHL) (n = 3 biological replicates). i, Effect of pre-miR-155-RiboTAC on the angiogenic capacity of HUVECs (n = 2 biological replicates). All data are reported as the mean ± S.D. All p-values were calculated using a two-tailed Student’s t-test. Source data
Extended Data Fig. 10
Extended Data Fig. 10. In vitro and in cellular characterization of c-Jun-binder and its derivatives.
a, Representative binding curves to measure the affinity of c-Jun-binder, c-Jun-RiboTAC, and c-Jun-Ctr for a model of the c-Jun RNA where the A bulge has been replaced with the fluorescent adenine mimic, 2-aminopurine (2AP) (n = 2 independent experiments). b, Representative binding curves to measure the affinity of c-Jun-binder, c-Jun-RiboTAC and c-Jun-Ctr for a Cy5-labelled model of the c-Jun IRES and a fully paired RNA control (n = 2 independent experiments). The fully paired RNA was created by mutating the A bulge binding site to an AU pair. c, Chemical structure of c-Jun-Chem-CLIP probe and control probe. Pull-down of the c-Jun mRNA in vitro by c-Jun-Chem-CLIP or Ctr-Chem-CLIP (n = 3 replicates). d, left: Target engagement studies completed by Chem-CLIP in MIA PaCa-2 cells (n = 3 biological replicates). Quantification of the enrichment of c-Jun mRNA by c-Jun-Chem-CLIP or Ctr-Chem-CLIP in pulled-down fraction as compared to RNA not subjected to pull-down; right: Competitive Chem-CLIP experiments in which MIA PaCa-2 cells were co-treated with c-Jun-Chem-CLIP at a constant concentration and increasing concentrations of c-Jun-binder, which depletes c-Jun mRNA in the pull-down fractions in a dose dependent fashion (n = 4 biological replicates). e, Effect of c-Jun-binder on c-JUN protein levels in Mia-PaCa-2 cells (n = 3 biological replicates). f, c-Jun-RiboTAC induces in vitro RNA cleavage with WT c-Jun construct (left), while no cleavage of the mutated base pair control (right) was observed (n = 3). All data are reported as the mean ± S.D. All p-values were calculated using a two-tailed Student’s t-test. Source data
Extended Data Fig. 11
Extended Data Fig. 11. In vitro and cellular characterization of c-Myc-binder and its derivatives.
a, Representative binding curves to measure the affinity of c-Myc-binder, c-Myc-RiboTAC and c-Myc-Ctr for a Cy5-labelled model of the c-Myc IRES 5’UUCG/3’ACCC 2×2 internal loop or a fully paired RNA control (n = 2 independent experiments). b, Chemical structures of c-Myc-Chem-CLIP and Ctr-Chem-CLIP probes (top) and target validation studies in HeLa cells (bottom). c-Myc-Chem-CLIP dose dependently enriches MYC mRNA (lower left; n = 3 biological replicates), which is competed by c-Myc-binder (lower right; n = 6 biological replicates). c, Effect of c-Myc-binder on MYC mRNA and protein levels in HeLa cells (n = 3 biological replicates). d, c-Myc-RiboTAC induces in vitro cleavage of the WT MYC IRES (left), while no cleavage of a mutated base pair control was observed (middle). Pre-miR-155-RiboTAC and c-Myc-RiboTAC have no effect on the non-cognate RNA (right) (n = 3 biological replicates for all panels). Concentrations were selected based on the cellular activity for the cognate target. e, Chemical structures of c-Myc-amide-binder and Ac-RiboTAC. f, Effect of c-Myc-amide-binder, Ac-RiboTAC, and c-Myc-Ctr on MYC mRNA and protein levels in HeLa cells (n = 3 biological replicates). g, Effect of siRNA knock-down of RNase L (~85%) on the activity of c-Myc-RiboTAC in HeLa cells (n = 3 biological replicates). h, Effects of c-Myc-RiboTAC and BRD4 degrader MZ1 on the proliferation and apoptosis of HeLa cells upon 48 h treatment (n = 3 biological replicates). i, Effect of c-Myc-RiboTAC on MYC mRNA levels (left; n = 3 biological replicates), protein abundance (middle; (n = 2 biological replicates for vehicle (note that the third lane was excluded from quantification due to air bubble) and n = 3 biological replicates for compound-treated sampled), and proliferation (right; n = 3 biological replicates) in MDA-MB-231 cells. j, Effect of siRNA knockdown of RNase L on c-Myc-RiboTAC-mediated degradation of MYC mRNA in MDA-MB-231 cells (n = 3 biological replicates). k, Effect of c-Myc-RiboTAC on a c-Myc-IRES-luciferase reporter or a binding site mutant thereof in transfected HEK293T cells (n = 4 biological replicates). l, Transcriptome-wide changes observed in HeLa cells treated with vehicle, c-Myc-RiboTAC, scrambled siRNA, or MYC siRNA (n = 3 biological replicates). Volcano plots of transcriptome-wide changes of HeLa cells treated with MYC-siRNA (1 nM) vs. scrambled siRNA (1 nM) after a 48 h treatment period (left). Cumulative curves of MYC targets and HIF-1α targets in HeLa cells treated with c-Myc-RiboTAC (10 μM) vs. vehicle (middle) or c-Myc-siRNA (1 nM) vs. scrambled siRNA (1 nM) (right). m, Volcano plots of proteome-wide changes of HeLa cells treated with c-Myc-RiboTAC (10 μM) vs. vehicle (left) or MYC-siRNA (1 nM) vs. scrambled siRNA (1 nM) (right) after a 48 h treatment period (n = 3 biological replicates). n, Abundance of RNase L mRNA in various cell lines (left; n = 3 biological replicates). Effect of c-Myc-Ctr (10 μM) and c-Myc-RiboTAC (10 μM) on MYC mRNA levels in lymphoma or leukaemia cells, Raji, and HL-60 cells, respectively (middle left; n = 6 biological replicates for vehicle and n = 3 biological replicates for compound treatment) and on apoptosis (middle right and right; n = 2 biological replicates). Interestingly, these data suggest that RiboTAC activity is correlated with RNase L expression. All data are reported as the mean ± S.D. of biologically independent replicates. Statistical significance was calculated using a two-tailed Student’s t-test (b-h, n), Wald’s test (i, left and m), or Kolmogorov–Smirnov test (i, middle and right). Source data

Comment in

References

    1. Costales MG, et al. Small-molecule targeted recruitment of a nuclease to cleave an oncogenic RNA in a mouse model of metastatic cancer. Proc. Natl Acad. Sci. USA. 2020;117:2406–2411. doi: 10.1073/pnas.1914286117. - DOI - PMC - PubMed
    1. Cooper TA, Wan L, Dreyfuss G. RNA and disease. Cell. 2009;136:777–793. doi: 10.1016/j.cell.2009.02.011. - DOI - PMC - PubMed
    1. Frazier KS. Antisense oligonucleotide therapies: the promise and the challenges from a toxicologic pathologist’s perspective. Toxicol. Pathol. 2015;43:78–89. doi: 10.1177/0192623314551840. - DOI - PubMed
    1. Lenartowicz E, et al. Antisense oligonucleotides targeting influenza A segment 8 henomic RNA inhibit viral replication. Nucleic Acid Ther. 2016;26:277–285. doi: 10.1089/nat.2016.0619. - DOI - PMC - PubMed
    1. Mandal M, Breaker RR. Gene regulation by riboswitches. Nat. Rev. Mol. Cell Biol. 2004;5:451–463. doi: 10.1038/nrm1403. - DOI - PubMed

Publication types