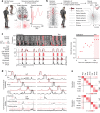
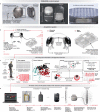
. 2023 Jun;618(7963):126-133.
doi: 10.1038/s41586-023-06094-5. Epub 2023 May 24.

Walking naturally after spinal cord injury using a brain-spine interface

Affiliations

Walking naturally after spinal cord injury using a brain-spine interface

Henri Lorach et al. Nature. 2023 Jun.

Abstract

A spinal cord injury interrupts the communication between the brain and the region of the spinal cord that produces walking, leading to paralysis1,2. Here, we restored this communication with a digital bridge between the brain and spinal cord that enabled an individual with chronic tetraplegia to stand and walk naturally in community settings. This brain-spine interface (BSI) consists of fully implanted recording and stimulation systems that establish a direct link between cortical signals3 and the analogue modulation of epidural electrical stimulation targeting the spinal cord regions involved in the production of walking4-6. A highly reliable BSI is calibrated within a few minutes. This reliability has remained stable over one year, including during independent use at home. The participant reports that the BSI enables natural control over the movements of his legs to stand, walk, climb stairs and even traverse complex terrains. Moreover, neurorehabilitation supported by the BSI improved neurological recovery. The participant regained the ability to walk with crutches overground even when the BSI was switched off. This digital bridge establishes a framework to restore natural control of movement after paralysis.


Conflict of interest statement

G.Courtine, J.B., H.L., R.D., L.A., T.A., F.M., G.Charvet and F.S.-S. hold various patents or applications in relation to the present work (EP4108289A1, EP2623025A1, EP2649936B1, EP3190480B1 and EP4088659A1). G.Courtine and J.B. are consultants for ONWARD medical. A.W. is an employee of ONWARD medical. G.Courtine and J.B. are minority shareholders of ONWARD, a company with potential commercial interest in the presented work. The remaining authors declare no competing interests.

Figures

Fig. 1
Fig. 1. Design, technology and implantation of the BSI.
a, Two cortical implants composed of 64 electrodes are positioned epidurally over the sensorimotor cortex to collect ECoG signals. A processing unit predicts motor intentions and translates these predictions into the modulation of epidural electrical stimulation programs targeting the dorsal root entry zones of the lumbosacral spinal cord. Stimulations are delivered by an implantable pulse generator connected to a 16-electrode paddle lead. b, Images reporting the pre-operative planning of cortical implant locations, and postoperative confirmation. L, left; R, right. c, Personalized computational model predicting the optimal localization of the paddle lead to target the dorsal root entry zones associated with lower limb muscles, and postoperative confirmation.
Fig. 2
Fig. 2. Calibration of the BSI.
a, Identification of the spatial and spectral distributions of ECoG feature weights related to attempted left hip flexions. b, Calibration of anode/cathode configurations and stimulation parameters (frequency, range of amplitudes) to elicit left hip flexions, including electromyographic signals from lower limb muscles. The polar plot reports the relative amplitude of muscle responses for the optimal configuration to target left hip flexors over the range of functional stimulation amplitudes (300 µs, 40 Hz, 14–16 mA). c, Online calibration of the BSI to enable volitional hip flexion in a seated position. Representative sequence reporting spectrogram, decoding probability and proportional modulation of stimulation amplitudes together with the resulting muscle activity and torque. The plot reports the convergence of the model over time, reaching 97 ± 0.4% after 90 s. d, Similar representations after the calibration of the BSI to enable the control over hip, knee and ankle joints of the lower limbs. e, Confusion matrices reporting the decoding accuracy for each joint (74 ± 7% s.e.m.) and the accuracy of the stimulation for each targeted muscle group (83 ±  6% s.e.m.).
Fig. 3
Fig. 3. The BSI restores natural control of walking.
a, Attempts to perform voluntary hip flexions without and with the BSI, including photographs, vertical elevation of the knee and hip flexor muscle activity. Bar plots report the mean values for these measurements. (n = 3 attempts per condition, unpaired one-tailed t-test, ***P < 0.001.) b, Chronophotography during walking with the BSI turned on, off and then on again. Note the two decoded attempts that do not lead to muscle activity nor the execution of steps. c, Range of stimulation amplitude during walking. d, Bar plots reporting mean values of kinematic and muscle activity parameters during walking with the BSI turned off and on, (n = 3 and 8 attempts for BSIOFF and BSION, respectively, unpaired one-tailed t-test, ***P < 0.001, P(iliopsoas activation) = 3.4 × 10−4, P(step height) = 5.1 × 10−10, P(hip angle) = 2.7 × 10−5, P(knee angle) = 1.6 × 10−9). e, Chronophotography of standing (voluntary pause) and walking with the BSI outdoors. The spectrogram, probabilities of left and right steps and modulation of stimulation amplitudes illustrate the robustness of the performance and absence of false-positive detections during the voluntary pause. f, Plots report the probability of right hip flexions over consecutive steps measured during the first session after the neurosurgical implantation (n = 13 steps, accuracy = 0.92 ± 0.1 s.d., w = 2.66 ± 0.6 s s.d.), and at 2 (n = 46 steps, accuracy = 0.93 ± 0.1 s.d., w = 2.64 ± 0.6 s s.d.), 6 (n = 41 steps, accuracy = 0.97 ± 0.1 s.d., w = 2.56 ± 0.9 s s.d.) and 11 months (n = 29 steps, accuracy = 0.97 ± 0.1 s.d., w = 1.71 ± 0.4 s s.d.) after the first activation of the BSI using updated models (Extended Data Fig. 5).
Fig. 4
Fig. 4. Neurological improvements following neurorehabilitation supported by the BSI in the absence of stimulation.
a, Chronophotography illustrating the walking ability of the participant without any stimulation before enroling in the STIMO clinical trial (pre-STIMO), after its completion (post-STIMO) and after completion of the STIMO-BSI clinical trial (post-BSI). b, Timeline of the two clinical trials, including a pie chart reporting the time during which the various types of neurorehabilitation exercises were practised, as well as the home use of the BSI. c, Photographs showing the maximal hip flexion and associated flexor muscle activity before and after neurorehabilitation. d, Changes in lower limb motor scores over the course of both clinical trials. e, Plots reporting improvements in WISCI II scores over the course of both clinical trials. Neurorehabilitation supported by the BSI restored the capacity to walk over 10 m with crutches without any assistance or stimulation. fh, Plots reporting quantifications of the 6 min walk test (f), weight-bearing capacity, time up and go, Berg Balance Scale (g) and observational gait analysis (h) (each dot refers to scores from a physiotherapist (n = 6, paired one-tailed t-test; **P = 0.002). N/A, not available.
Extended Data Fig. 1
Extended Data Fig. 1. Technological and computational design underlying the BSI.
a, Photographs reporting the geometry and features of the WIMAGINE implant, including 64 platinum-iridium (90:10) electrodes with 4 mm x 4.5 mm pitch (in antero-posterior and medio-lateral axes respectively). Two external antennas are embedded within the implant. The first antenna powers the implanted electronics through inductive coupling at high frequency (HF, 13.56 MHz) while the second ultrahigh frequency antenna (UHF, 402-405 MHz) transfers the recorded signals outside the body. b, Two external antennas embedded in a personalized 3D-printed headset power the implant and recover the streamed signals that are then transferred to a base station. This base station manages the powering of the implants, synchronization and conditioning of the raw data. c, A decoding pipeline computes temporal, spectral and spatial features embedded in the ECoG signals related to the intention to move. These features are then uploaded into the decoding algorithm that decodes the attempts to move the lower limbs based on a tailored, recursive exponentially weighted Markov-switching multi-linear model algorithm. This algorithm is a mixture of multilinear experts’ algorithm integrating a Hidden Markov Model (HMM) classifier, called gating, and a set of independent regression models, called experts. The gating classifier predicts the joint that is intended to be mobilized (i.e. hip, knee or ankle on each side) as well as resting state, while each expert is dedicated to predicting the direction and relative amplitude of the intended movement. When updating is allowed, every 15 s, the coefficients of both linear regressions (βgate, bgate, βexpert, bexpert) are updated through recursive partial least square along with the coefficients of the transition matrix T corresponding to the number of transitions between each states during this 15s period (i.e. 150 new transitions). To support the production of standing and walking, the outputs of the model are encoded into updates of joint-specific stimulation programs that are constrained within pre-established functional ranges of amplitudes. d, A tailored, medical-grade software sends these updates to the implanted pulse generator through a chain of wireless communication systems, eventually delivering the stimulation through a paddle array implanted epidurally over the lumbosacral spinal cord.
Extended Data Fig. 2
Extended Data Fig. 2. Calibration of the BSI.
a, Post-operative localization of the cortical implants over the segmented brain of the participant that confirms the appropriate positioning of the 64-electrode grids over the activated regions of the primary motor cortex responding to attempted lower limb movements, as measured during functional magnetoencephalographic recordings. b, Post-operative localization of the paddle lead over the lumbosacral spinal cord to target lower limb muscles. c, Projection of linear regression weights associated with different lower limb movements (depicted on body schemes) onto the location of the implants, revealing the spatial segregation of movement-specific features. d, Electromyographic activity recorded from several lower limb muscles following a burst of epidural electrical stimulation using the more selective electrode configurations (schemes) and parameters (reported) translated into polar plots reporting the amplitude of muscle responses. e, Spatial distribution of linear regression weights associated with upper versus lower limb movements over the grid of 64 electrodes from each cortical implant. The firmware enabled the selection of 32 electrodes within the 64 electrodes of each implant. The red dots indicate the 32 selected electrodes from each implant based on the amount of identified movement-related information for each of the 64 electrodes. f, Spectral distribution of linear regression weights associated with upper versus lower limb movements, highlighting the importance of high sampling density in low frequencies compared to high frequencies. This ensemble of features guided the parameterization of the decoders. g, Detailed representation of the spatial and spectral repartition of weights associated with decoding of the 6 different lower limb joint movements.
Extended Data Fig. 3
Extended Data Fig. 3. Stability of the decoder enables safe utilization of BSI.
a, Chronophotography and associated spectrogram, probabilities of left and right steps, modulation of muscle activity, ankle height, and peak probability of step cycles during a sequence involving walking, a voluntary pause (30 s, instructed), and resuming walking. The absence of false positive detections illustrates the robustness of the BSI. b, The bar plot reports the peak probability of walk (active) versus idle state, together with the confusion matrices reporting the detected rest versus left and right swing states (n = 31 and n = 49 samples for idle and active states respectively, unpaired one-tailed t-test ***, P < 0.001). c, Photographs illustrating sit to stand capacities without and with the BSI, including bar plots reporting balance capacities (scores) measured using the Berg Balance Scale.
Extended Data Fig. 4
Extended Data Fig. 4. The BSI normalizes gait parameters and supports walking on complex terrains.
a, Principal component (PC) analysis applied on kinematic and muscle activity parameters during walking on a treadmill with stimulation alone versus BSI. During stimulation alone conditions, a closed-loop controller based on motion sensors attached to the lower limbs determine the parameters of stimulation. Each dot represents a gait cycle. The bar plot reports the Euclidean distance in the PC space between each sample and the centroid of the healthy steps. (n = 119, n = 30 and n = 61 steps for healthy, EES only and BSI respectively, unpaired one-tailed t-test ***, P < 0.001). Compared to stimulation alone, the BSI enabled walking with gait features that were closer to those quantified in healthy individuals. This similitude is highlighted in the bar plots, which report the mean values of kinematic parameters with a high factor loading on PC1. b, Quantitative measure of step length while walking with crutches. Steps below 10 cm are considered failed as illustrated in the stick plot diagram. EES only condition showed significantly shorter step length due to increase of failed steps (n = 26, n = 43 for EES only and BSI respectively, Mann-Whitney U test one-tailed t-test **, P < 0.01). c, Photographs illustrating walking capacities, together with bar plots that report quantifications of performance during the execution of various walking paradigms, including walking up and down a ramp, climbing stairs, and walking with crutches overground. d) Walking on changing terrains with obstacles and different textures (6 surfaces), as illustrated in the scheme on the left. Conventions are the same as in previous figures. Decoding stability is shown by overlayed probability curves of right hip flexions over consecutive steps (n = 13 steps, Left accuracy = 0.89 +/− 0.1 std, w = 2.06 s +/− 0.6 s std), and Left accuracy (n = 13 steps, accuracy = 0.91 +/− 0.1 std, w = 2.06 s +/− 0.4 s std).
Extended Data Fig. 5
Extended Data Fig. 5. Long term stability of the BSI supporting walking.
a, Recordings of the resting state were acquired regularly to evaluate the evolution of signal quality over time. Raw traces and power spectrum of an ECoG signal measured from a selected electrode are shown to illustrate the stability of the recorded signals. The plot reports the mean values of the power spectrum quantified over 2 min of resting state recorded at regular intervals over a period of nearly one year, showing a steady yet negligible decrease in signal quality over time (−0.03 dB/day). b, Plots reporting principal component analysis of gating coefficients from all the models used for supporting walking over the entire duration of the study. The size of each data point captures the relative time during which each model was used. c, Plots reporting the range of stimulation amplitudes and frequencies used over the entire course of the neurorehabilitation program, highlighting the robustness of the BSI over nearly six months of use. d, Spectrograms and decoding performance together with modulation of stimulation amplitude (relative) during self-paced walking enabled by the BSI. Plots report the probability of left and right hip flexion events (swing) measured over consecutive steps, and repeated at regular intervals over the entire time course of the clinical trial. e, Median spectrograms around the right hip flexion attempts during different time periods along training (n = 100 attempts in each period). The average rectified modulations show a significant increase with time (n = 64 electrodes, R2 = 0.68, P < 0.001).
Extended Data Fig. 6
Extended Data Fig. 6. BSI supporting control over isolated lower limb movements.
The same model was used to enable the participant to exert control over 6 joints from both sides during two sessions apart from 2 months. Conventions are the same as in previous figures.
Extended Data Fig. 7
Extended Data Fig. 7. Design and configuration of the BSI for independent use at home.
a, An integrated walker was designed and fabricated to incorporate the different hardware composing the BSI, thereby maximizing the practicability of the technological platform for use at home. The system is battery-powered and can operate autonomously for approximately 2 h without any supervision. b, Sequence showing the different steps to configure the BSI, including the positioning of the communication headset, uploading of a BSI program, monitoring of signal quality to ensure appropriate placement of the antennas, and adjusting the minimum and maximum amplitudes of the stimulation. The participant has been using the BSI independently to support neurorehabilitation and daily life activities over nearly one year. Positioning the hardware and configuring the BSI require approximately 5 min. c, Usage log and performance quantification of the participant after the main phase of the study as a cumulative number of decoded steps and cumulative time of use over a period of 181 day, i.e. since the participant returned to his home.

References

    1. Bickenbach, J. et al. International Perspectives on Spinal Cord Injury: Summary (WHO, 2013); https://apps.who.int/iris/handle/10665/94192. - PubMed
    1. Ahuja, C. S. et al. Traumatic spinal cord injury. Nat. Rev. Dis. Primer3, 17018 (2017). - PubMed
    1. Benabid, A. L. et al. An exoskeleton controlled by an epidural wireless brain–machine interface in a tetraplegic patient: a proof-of-concept demonstration. Lancet Neurol. 10.1016/S1474-4422(19)30321-7 (2019). - PubMed
    1. Wagner, F. B. et al. Targeted neurotechnology restores walking in humans with spinal cord injury. Nature563, 65–71 (2018). - PubMed
    1. Rowald, A. et al. Activity-dependent spinal cord neuromodulation rapidly restores trunk and leg motor functions after complete paralysis. Nat. Med.28, 260–271 (2022). - PubMed

Publication types

MeSH terms