. 2023 Jun;618(7964):374-382.
doi: 10.1038/s41586-023-06114-4. Epub 2023 May 24.

Tumour extracellular vesicles and particles induce liver metabolic dysfunction

Affiliations

Tumour extracellular vesicles and particles induce liver metabolic dysfunction

Gang Wang et al. Nature. 2023 Jun.

Abstract

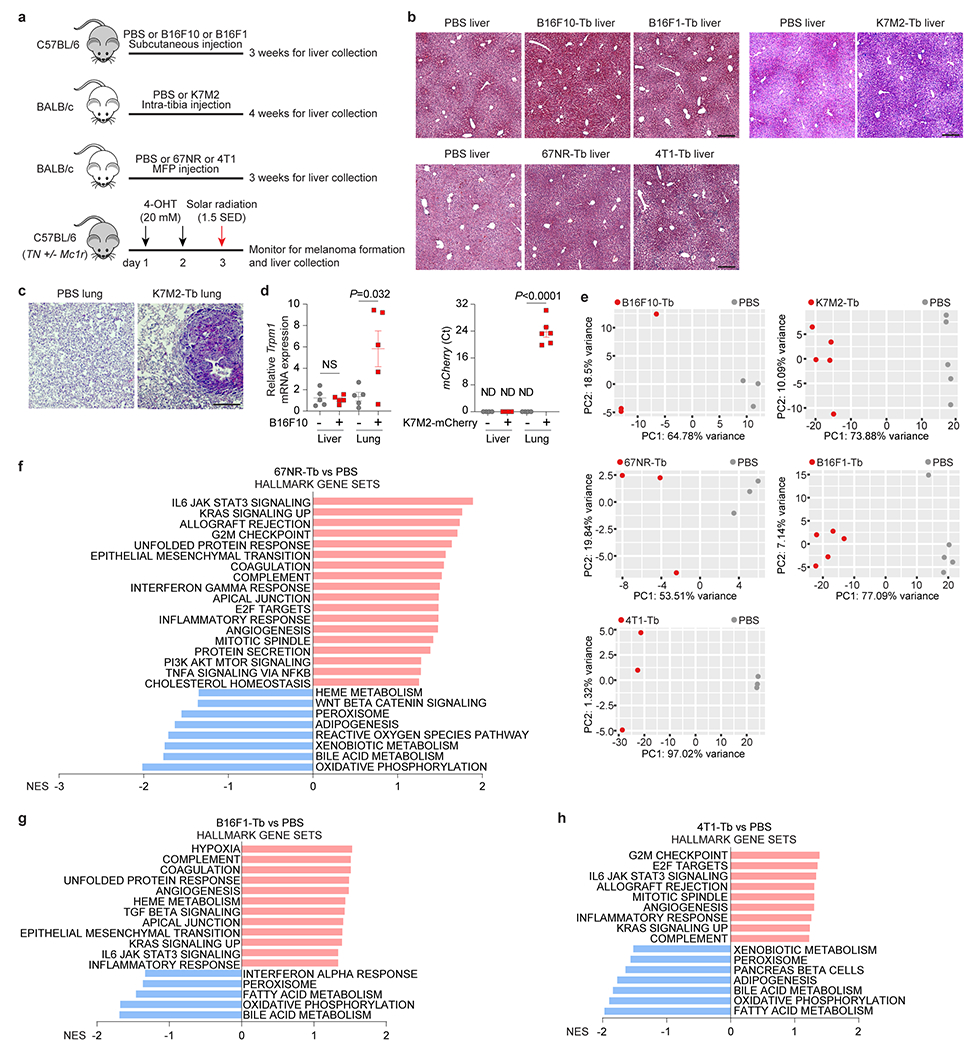
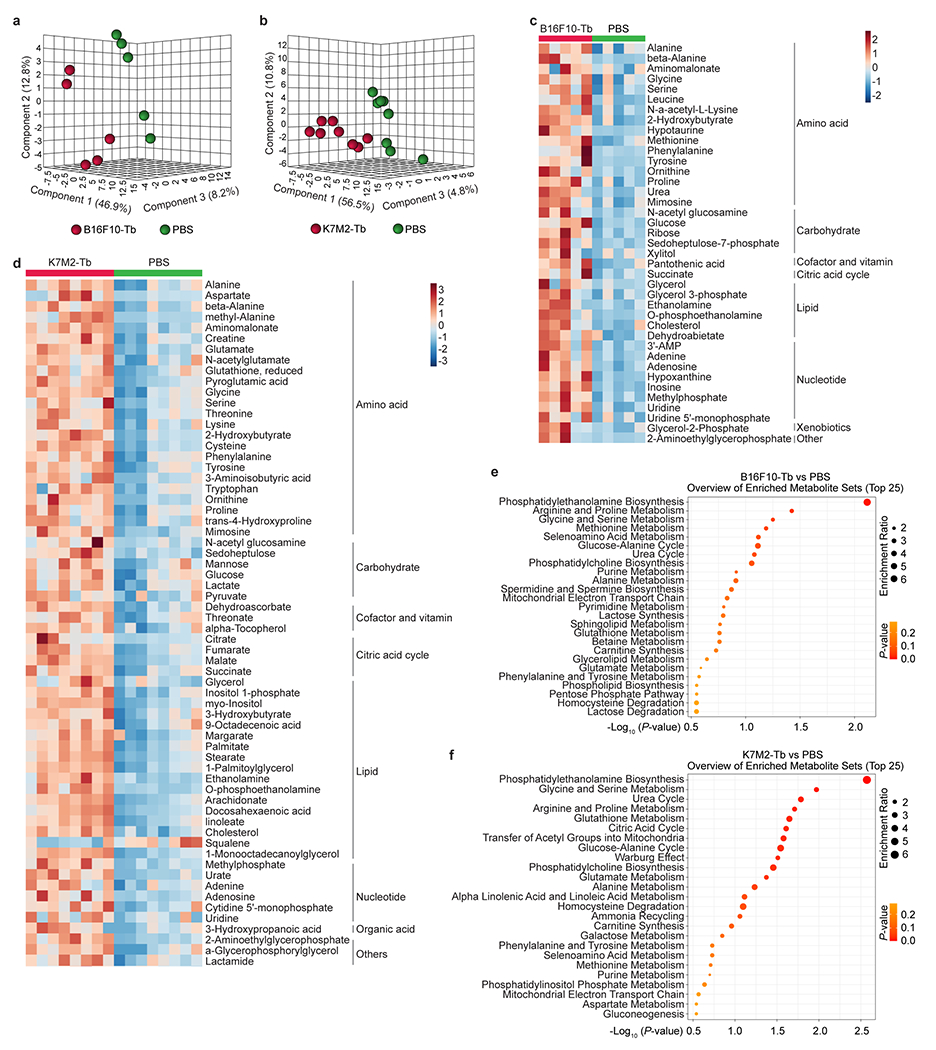
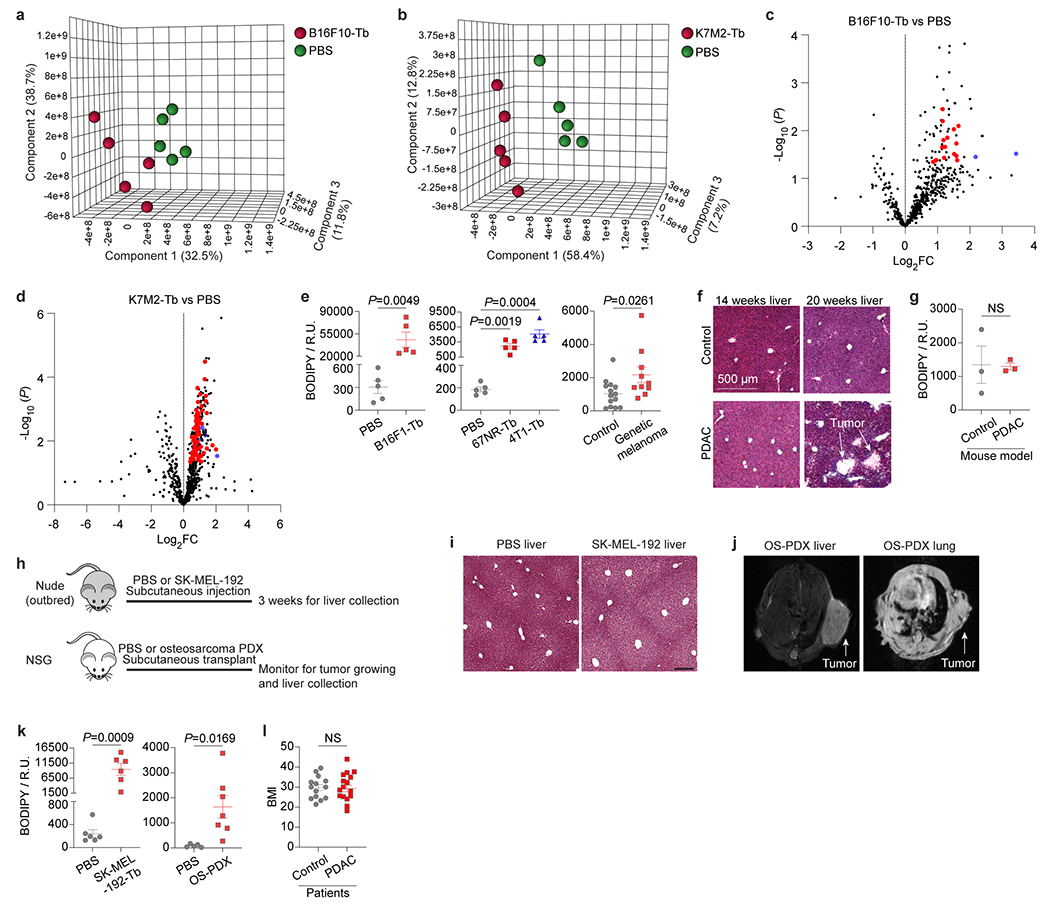
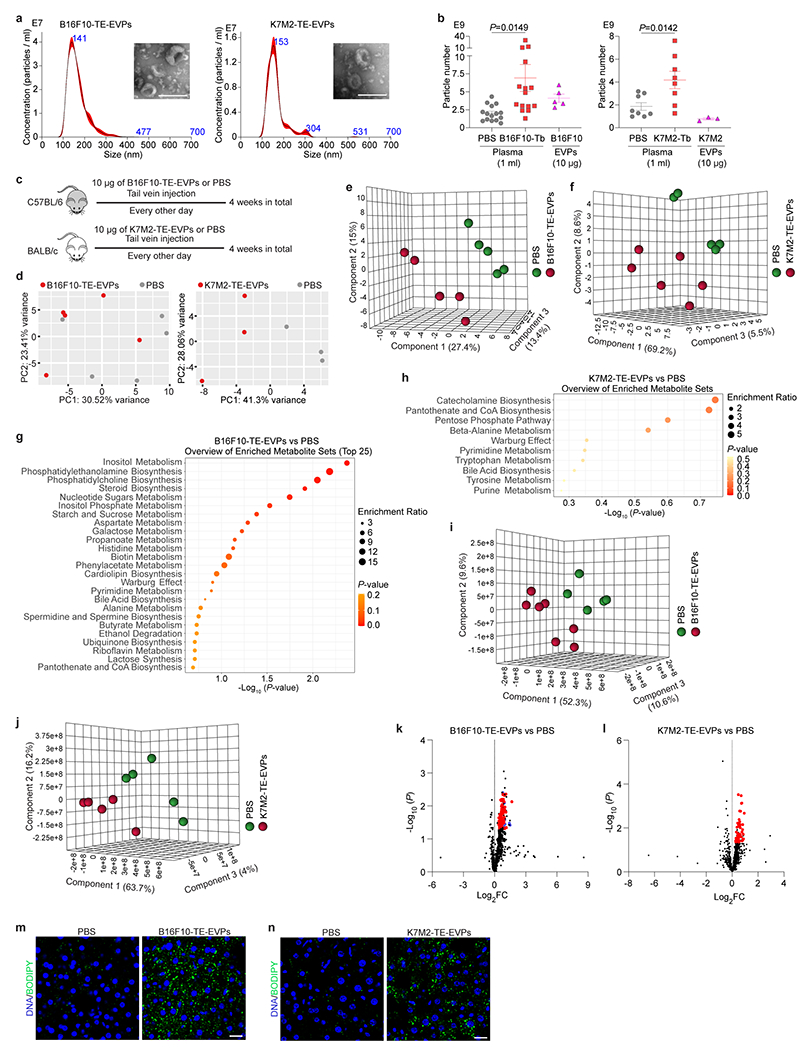
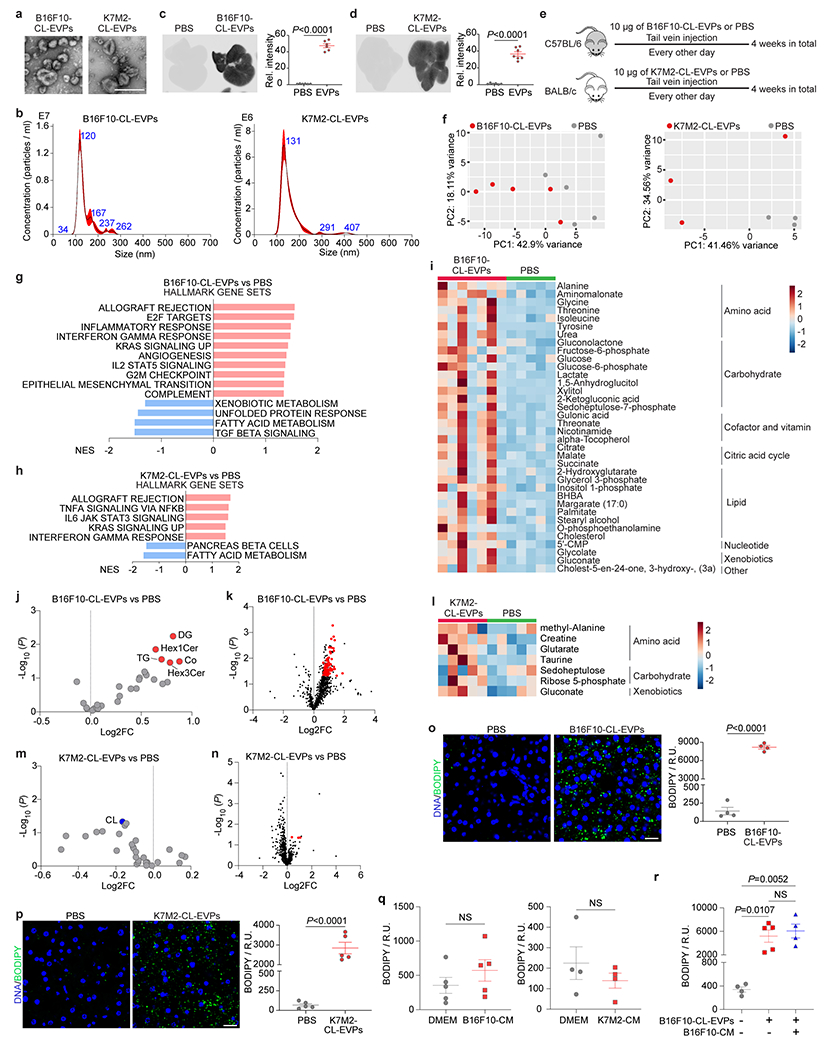
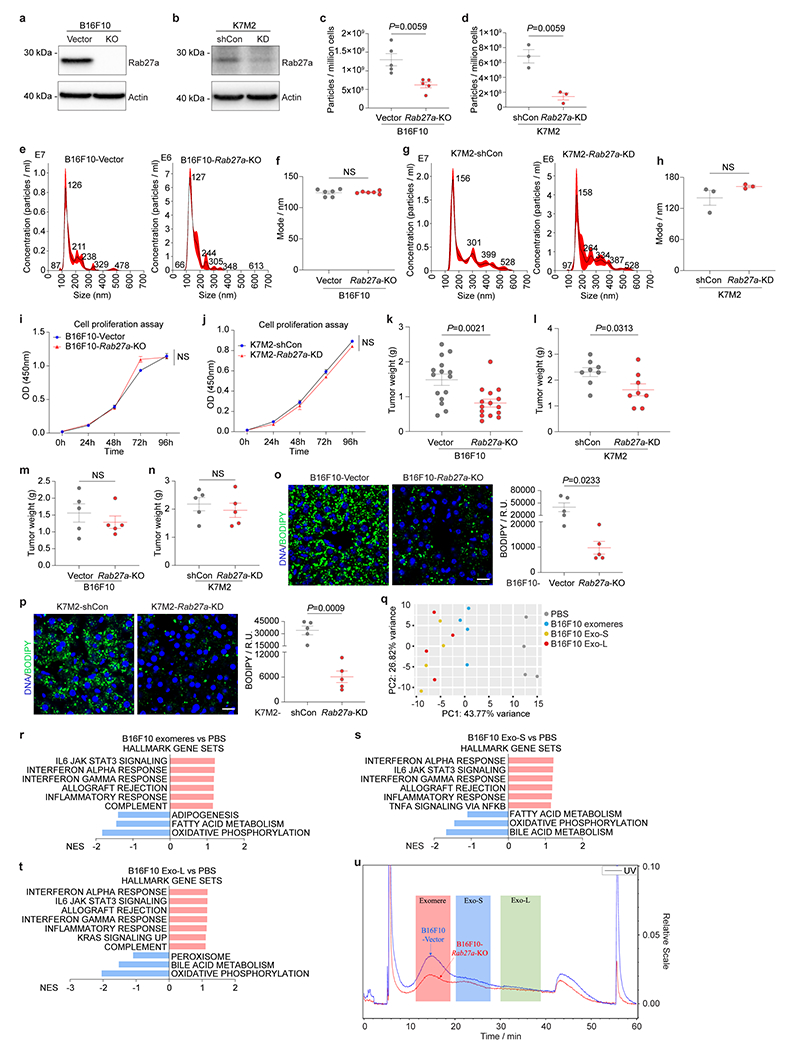
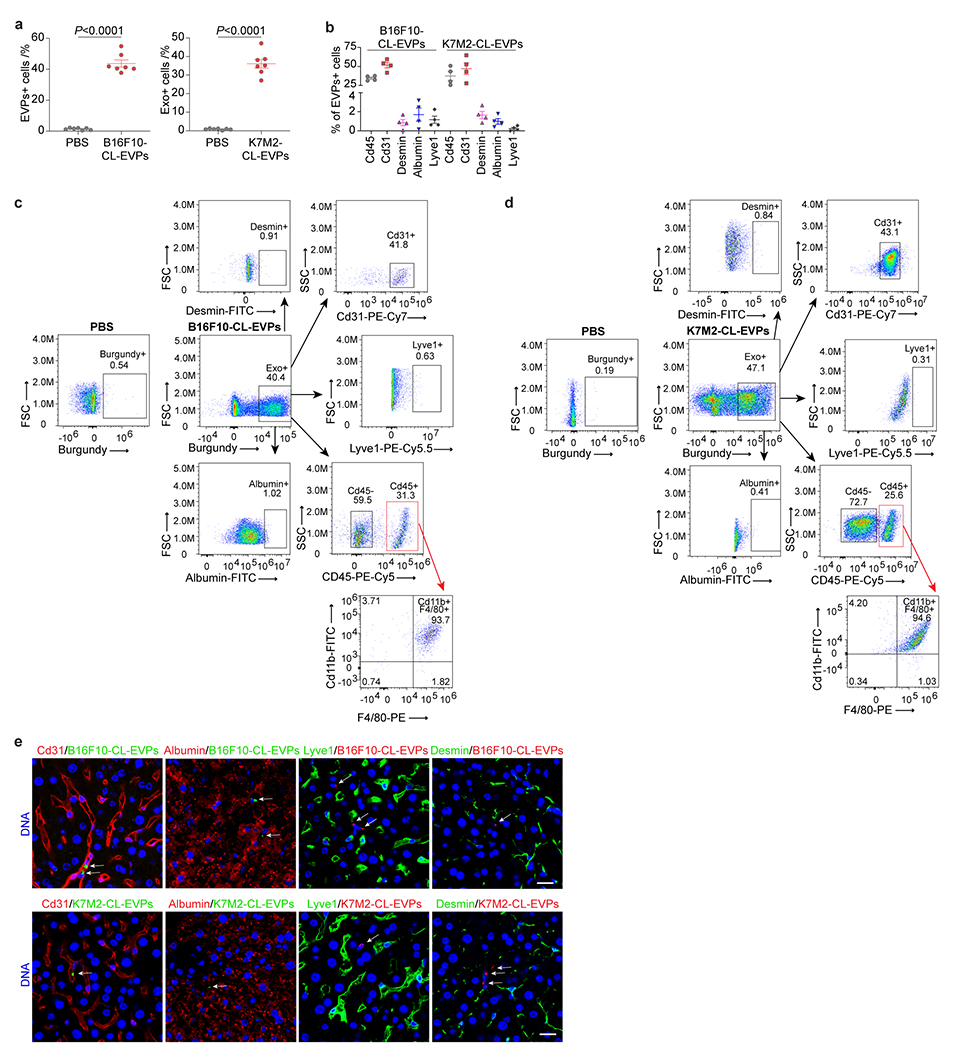
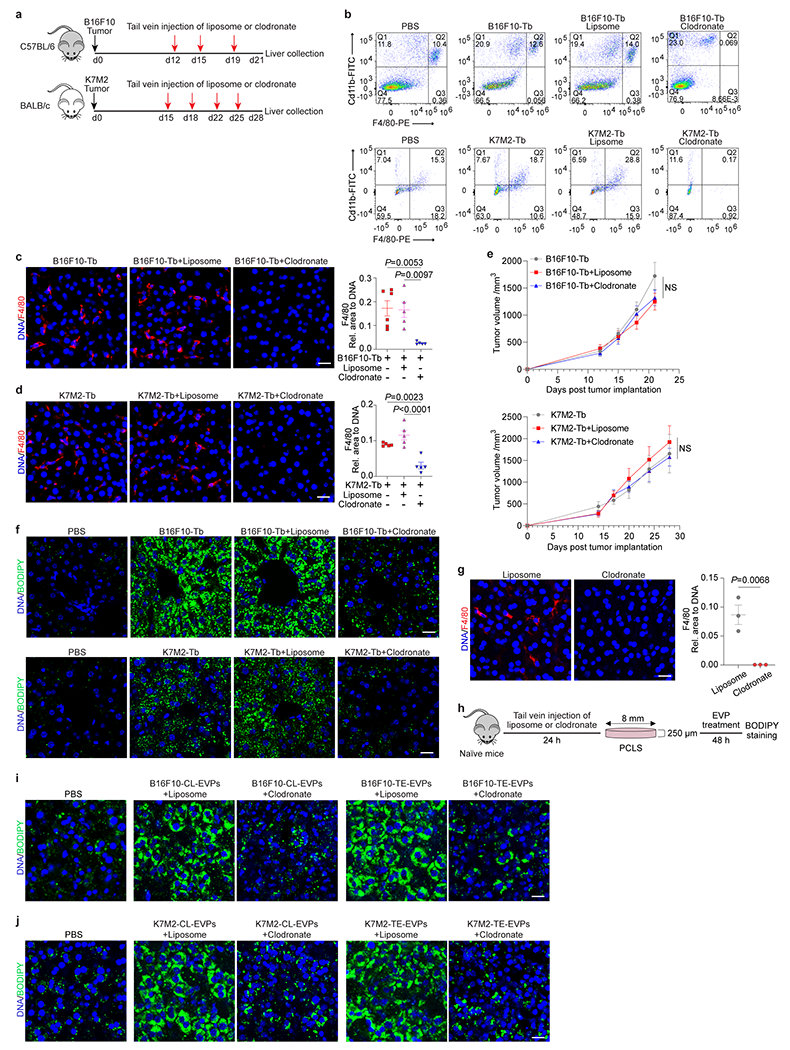
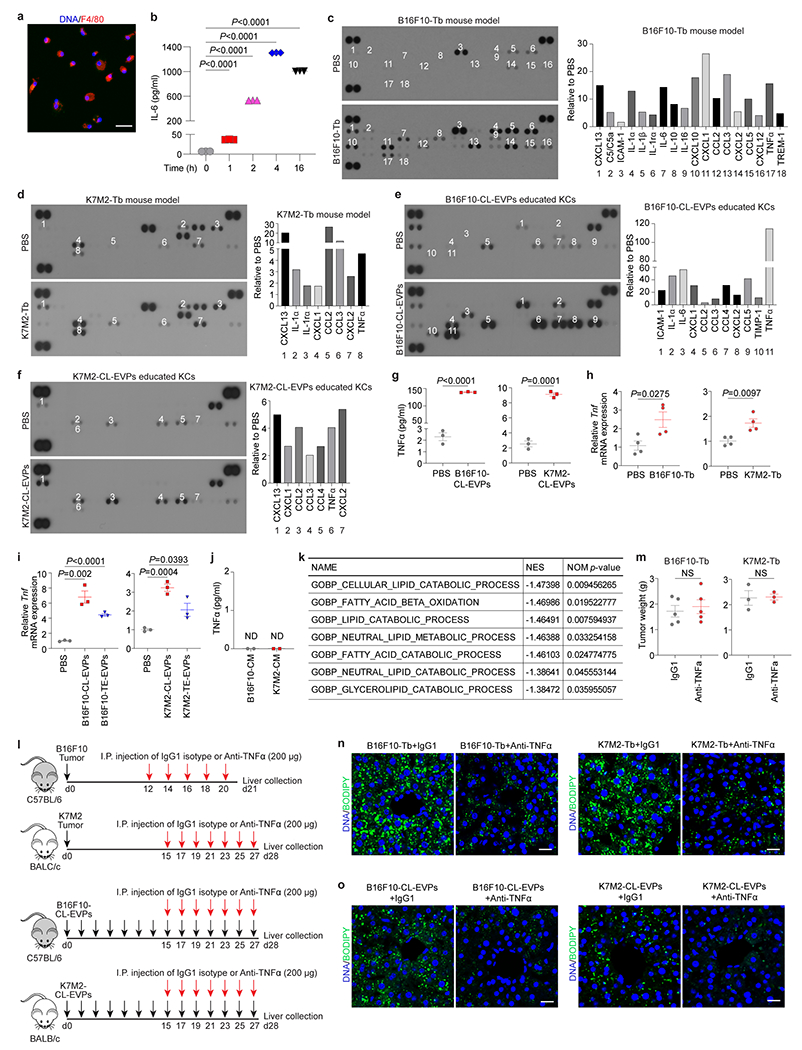
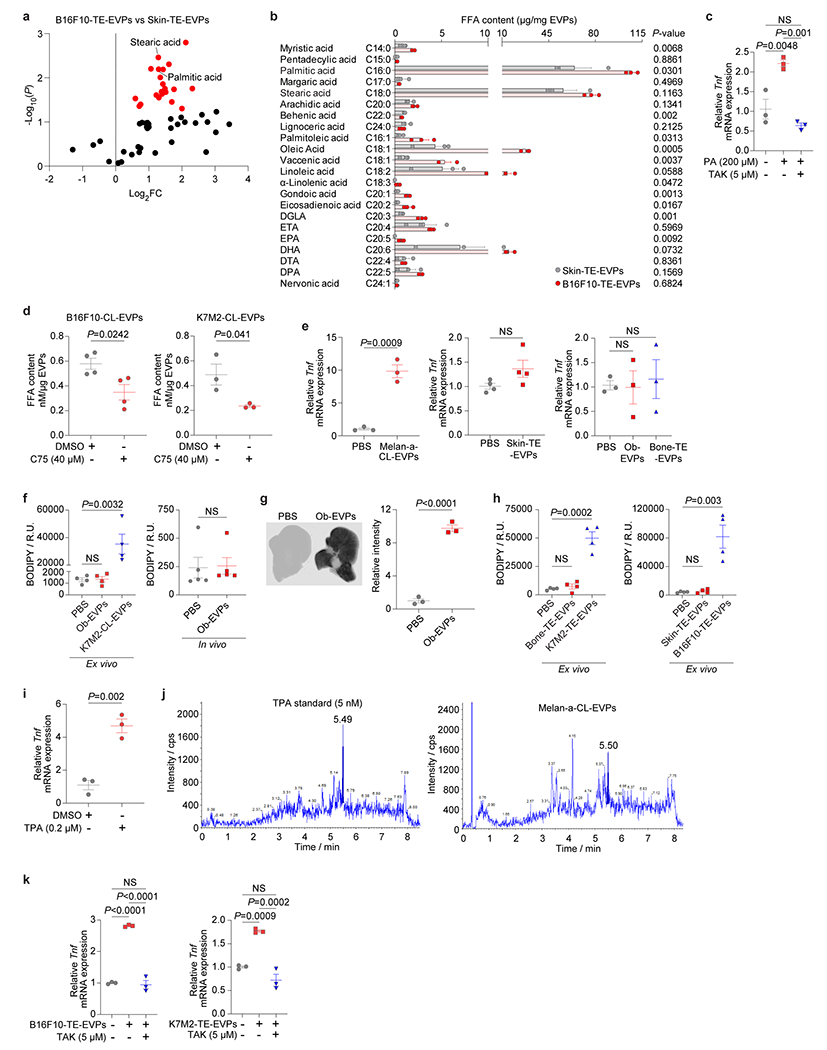
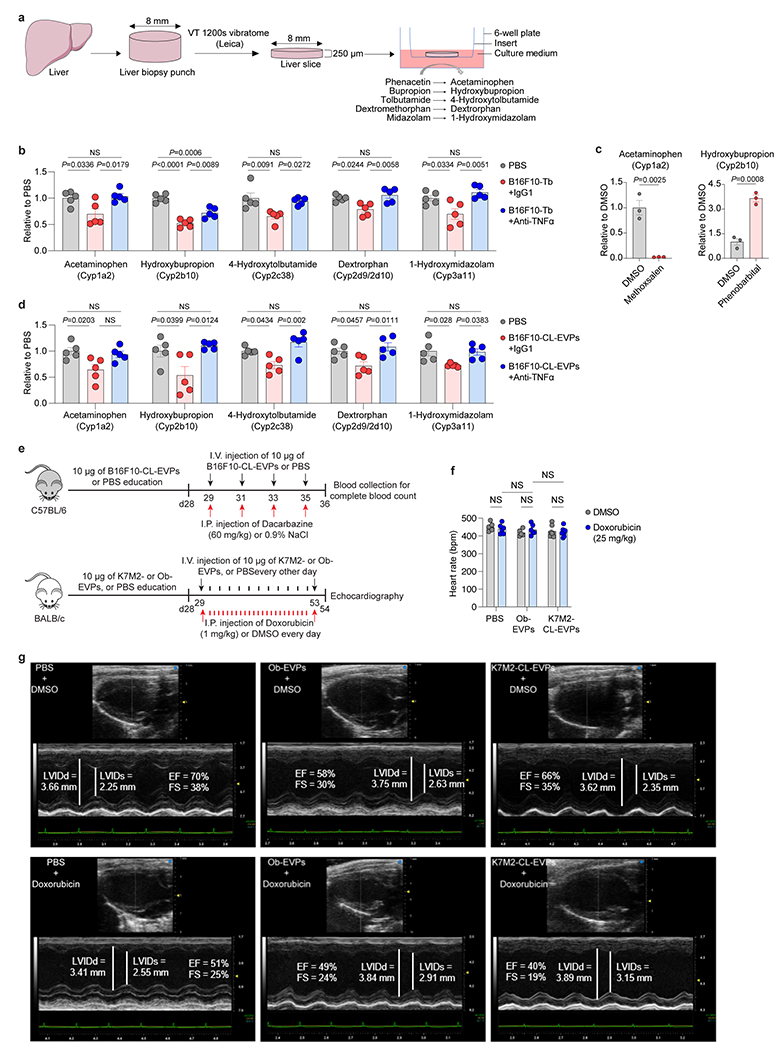
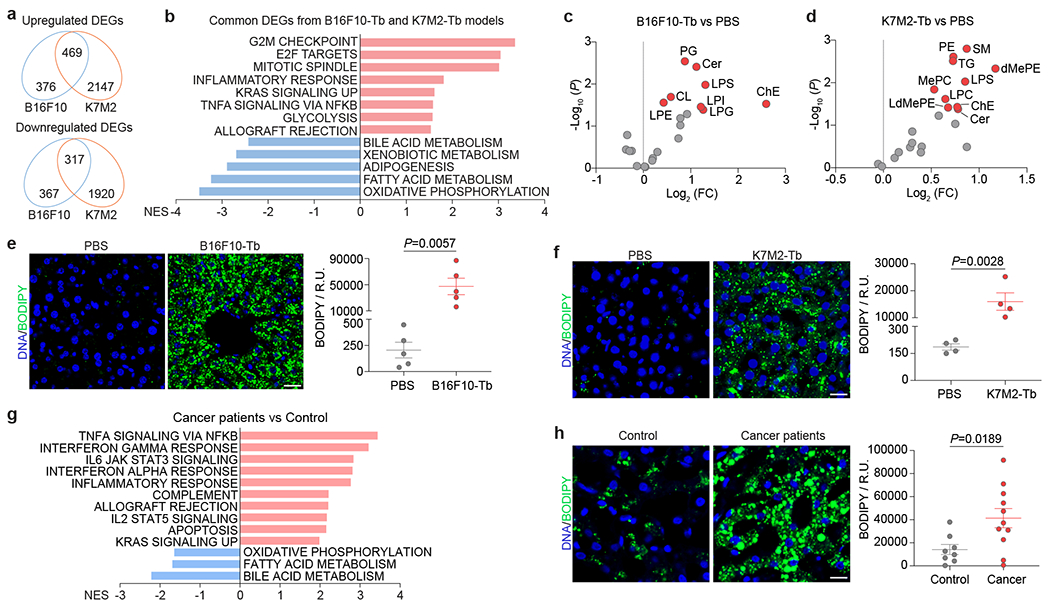
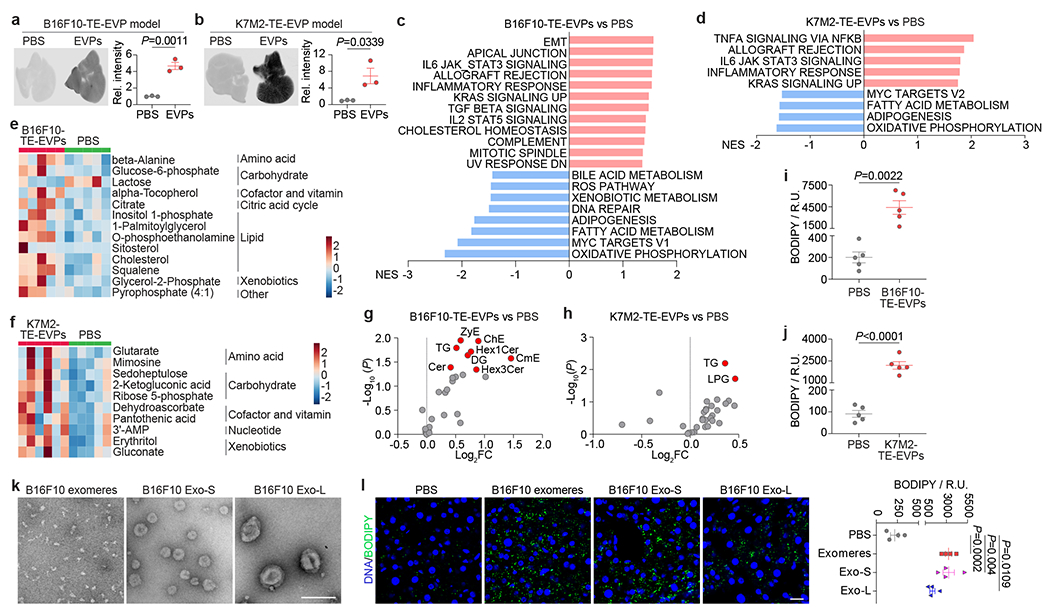
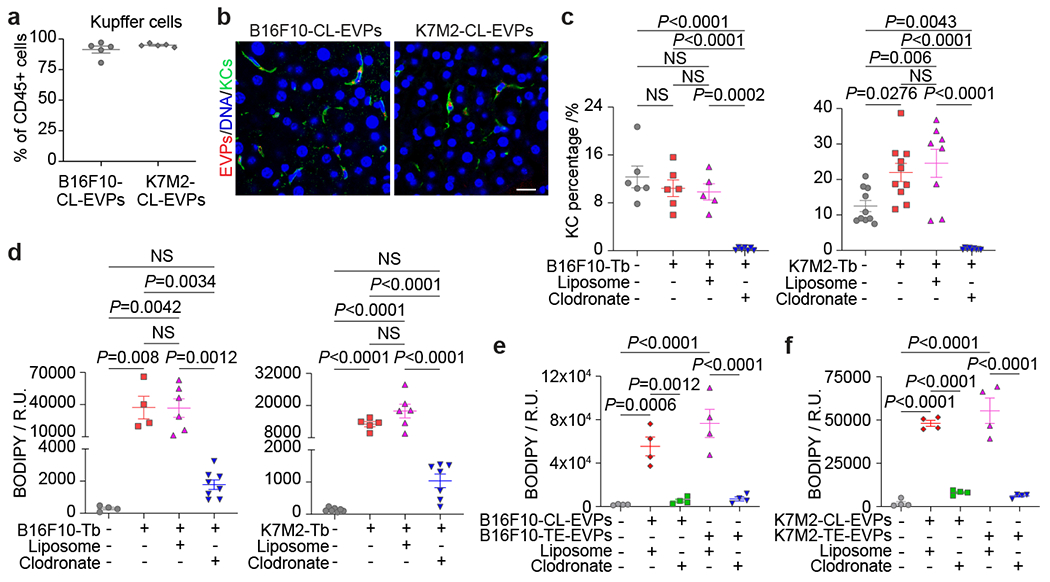
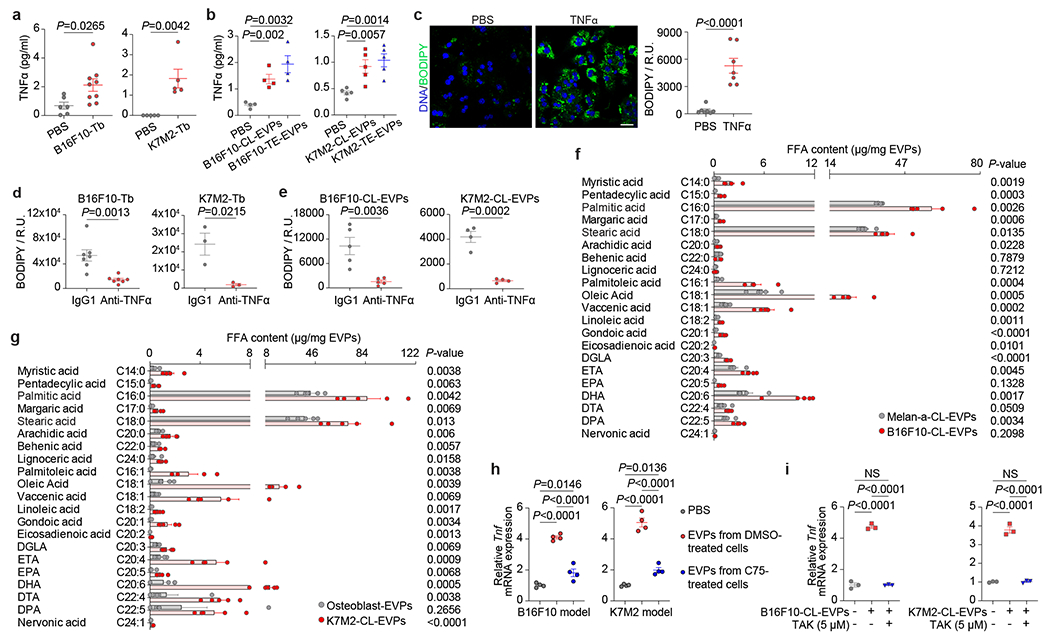
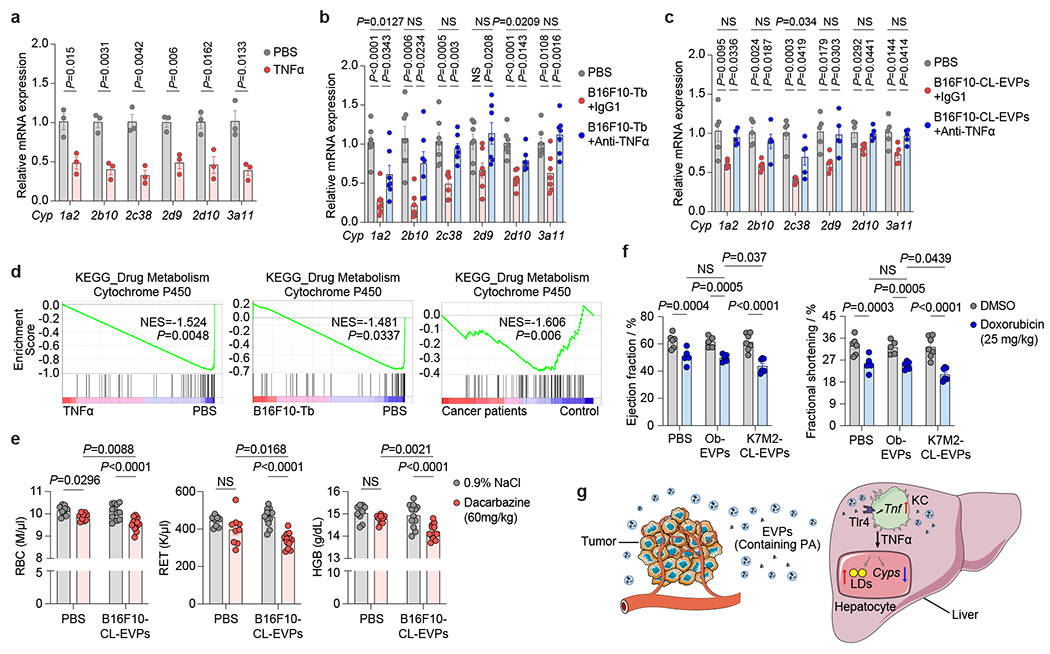
Cancer alters the function of multiple organs beyond those targeted by metastasis1,2. Here we show that inflammation, fatty liver and dysregulated metabolism are hallmarks of systemically affected livers in mouse models and in patients with extrahepatic metastasis. We identified tumour-derived extracellular vesicles and particles (EVPs) as crucial mediators of cancer-induced hepatic reprogramming, which could be reversed by reducing tumour EVP secretion via depletion of Rab27a. All EVP subpopulations, exosomes and principally exomeres, could dysregulate hepatic function. The fatty acid cargo of tumour EVPs-particularly palmitic acid-induced secretion of tumour necrosis factor (TNF) by Kupffer cells, generating a pro-inflammatory microenvironment, suppressing fatty acid metabolism and oxidative phosphorylation, and promoting fatty liver formation. Notably, Kupffer cell ablation or TNF blockade markedly decreased tumour-induced fatty liver generation. Tumour implantation or pre-treatment with tumour EVPs diminished cytochrome P450 gene expression and attenuated drug metabolism in a TNF-dependent manner. We also observed fatty liver and decreased cytochrome P450 expression at diagnosis in tumour-free livers of patients with pancreatic cancer who later developed extrahepatic metastasis, highlighting the clinical relevance of our findings. Notably, tumour EVP education enhanced side effects of chemotherapy, including bone marrow suppression and cardiotoxicity, suggesting that metabolic reprogramming of the liver by tumour-derived EVPs may limit chemotherapy tolerance in patients with cancer. Our results reveal how tumour-derived EVPs dysregulate hepatic function and their targetable potential, alongside TNF inhibition, for preventing fatty liver formation and enhancing the efficacy of chemotherapy.


Conflict of interest statement

Competing interests

The authors declare no competing financial interests.

D.L. is on the scientific advisory board of Aufbau Holdings Ltd.

R.E.S. is on the scientific advisory board of Miromatrix and is a speaker and consultant for Alnylam Inc.

M.E. is a member of the research advisory board for brensocatib for Insmed; a member of the scientific advisory board for Vividion Therapeutics; a consultant for Protalix BioTherapeutics; and holds shares in Agios.

Figures

Extended Data Figure 1.
Extended Data Figure 1.. Primary tumors dysregulate the metabolism of metastasis-free livers.
a, Schematic representation of murine tumor models utilized in this study. B16F10, K7M2, 67NR, B16F1 and 4T1 cells, were orthotopically injected into syngeneic mice. Age and sex-matching mice injected with PBS were used as controls of these experimental murine models. C57BL/6 TN mice carrying a Cre-inducible NrasQ61R oncogene were employed for generating spontaneous melanoma. Non-tumor bearing control mice carried the NrasQ61R, p16fl/fl and Tyr-CRE-ER(T2) alleles but were not treated to induce CRE activity or tumor formation. Functionally null Mc1r increased melanoma susceptibility. b, Representative H&E staining images of the livers from B16F10-Tb and B16F1-Tb mice (top, left), K7M2-Tb mice (top, right), 67NR-Tb and 4T1-Tb mice (bottom), and their respective controls. This experiment was repeated three times independently with similar results. c, Representative H&E staining images of lung metastases in the PBS control mice and K7M2-Tb mice. This experiment was repeated three times independently with similar results. d, qRT-PCR analysis of Trpm1 and mCherry expression in livers and lungs of mice implanted with B16F10 and mCherry-expressing K7M2 cells, respectively, compared to their controls. n=5 per group for B16F10-Tb model, n=4 control and n=6 K7M2-mCherry-Tb mice. NS, not significant; ND, not detected. e, Principal component analysis (PCA) of gene expression in the livers from mice implanted with B16F10, or K7M2, or 67NR, or B16F1, or 4T1 tumor cells, compared to their respective PBS-injected controls. Results showed that the gene expression profiles of livers from tumor-bearing mice independently segregated from their respective controls. n=3 mice per group for B16F10-Tb, 67NR-Tb and 4T1-Tb models; n=5 mice per group for K7M2-Tb and B16F1-Tb models. f-h, GSEA of the gene expression profiles, which were ranked based on the sign of log2FC*(−log10P value), in the livers from 67NR-Tb mice (f), B16F1-Tb mice (g), or 4T1-Tb mice (h), compared to their respective PBS-injected controls, using hallmark gene sets, and the significantly changed signaling pathways with FDR<0.2 are shown. n=3 mice per group for 67NR-Tb and 4T1-Tb models; n=5 mice per group for B16F1-Tb model. Gene lists for signaling pathways are shown in Supplementary Tables 19–21. Scale bars for (b,c), 200 μm. P values were determined by two-tailed, unpaired Student’s t-test (d).
Extended Data Figure 2.
Extended Data Figure 2.. Tumors induce metabolic dysfunction of the metastasis-free livers.
a,b, PLS-DA plots of metabolites detected in the livers from B16F10-Tb mice (a) and K7M2-Tb (b) mice, compared to their PBS-injected controls. Metabolomics MS data are shown Supplementary Tables 1 and 2. n=5 B16F10-Tb mice and controls; n=8 K7M2-Tb mice and controls. c,d, Heatmaps showing the significantly changed metabolites, classified into different groups, in the livers from B16F10-Tb mice (c) and K7M2-Tb mice (d), compared to their PBS-injected controls. n=5 B16F10-Tb mice and controls; n=8 K7M2-Tb mice and controls. e,f, Metabolite set enrichment analysis of metabolites (shown in c,d) significantly changed in the livers of B16F10-Tb (e) and K7M2-Tb (f) mice, compared to their respective PBS-injected controls. n=5 B16F10-Tb mice and controls; n=8 K7M2-Tb mice and controls. P values were determined by the hypergeometric test (e,f).
Extended Data Figure 3.
Extended Data Figure 3.. Tumors induce lipid accumulation in metastasis-free livers.
a,b, PLS-DA plots of the lipid species in the livers from B16F10-Tb mice (a) and K7M2-Tb mice (b), compared to their PBS-injected controls. Lipidomics MS data are shown in Supplementary Tables 3 and 4. n=5 mice per group. c,d, Volcano plots showing the significantly (P<0.05) enriched triglyceride species (red) and cholesteryl ester species (blue) in the livers from B16F10-Tb mice (c) and K7M2-Tb mice (d), compared to their PBS-injected controls. n=5 mice per group. e, Statistical analysis of BODIPY staining of livers from murine melanoma B16F1-Tb mice, murine breast cancer 67NR-Tb and 4T1-Tb mice, genetic melanoma-bearing mice, and their respective controls. n=5 mice per group for B16F1, 67NR and 4T1 models; n=14 control and n=10 tumor-bearing mice for the genetic melanoma model. f, Representative H&E staining images of livers from KPC mice. Liver metastasis was observed in 20-week, but not 14-week tumor bearing mice. g, Statistical analysis of BODIPY staining of the livers from 14-week PDAC tumor-bearing mice, compared to non-PDAC mouse controls. n=3 mice per group. h, Schematic representation of murine tumor models utilized in this study. SK-MEL-192 cells were subcutaneously injected into nude (outbred) mice. Patient-derived xenograft (PDX) models of osteosarcoma were generated by transplanting surgically excised primary tumor specimens from clinical patients into NOD/SCID/IL2Rγnull (NSG) mice. Age and sex-matching mice injected with PBS were used as controls of these experimental murine models. i, Representative H&E staining images of the livers from SK-MEL-192-Tb and control. This experiment was repeated three times independently with similar results. j, Representative MRI images showing lung metastasis, but not liver metastasis detected in osteosarcoma-PDX (OS-PDX) mouse models. This experiment was repeated seven times independently with similar results. k, Statistical analysis of BODIPY staining of livers from human melanoma SK-MEL-192-Tb mice, osteosarcoma-PDX tumor-bearing mice, and their respective controls. n=6 mice per group for SK-MEL-192 model; n=5 control and n=7 tumor-bearing mice for osteosarcoma-PDX model. l, Measurement of body mass index (BMI) of PDAC patients and control subjects with benign lesions. n=14 control subjects and n=16 PDAC patients. Scale bars, 500 μm for (f) and 200 μm for (i). P values were determined by the two-tailed, unpaired Student’s t-test (c-e,g,k,l). Data are mean ± s.e.m. NS, not significant.
Extended Data Figure 4.
Extended Data Figure 4.. Tumor explant (TE)-derived EVPs dysregulate liver metabolism.
a, Representative nanoparticle tracking analysis (NTA) and TEM images (insertions) of B16F10-TE-EVPs (left) and K7M2-TE-EVPs (right). Shown are graphs and images representative of three independent experiments. b, Quantification of the particle numbers in 1 ml of plasma from B16F10-Tb (left) and K7M2-Tb (right) mice, compared to their PBS-injected controls, as well as in 10 μg of EVPs derived from B16F10 (left) and K7M2 (right) cells. n=15 control and B16F10-Tb mice; n=8 control and K7M2-Tb mice; n=5 and n=3 independent experiments for EVPs derived from B16F10 and K7M2 cells, respectively. c, Schematic illustration of the procedure of syngeneic mouse education with B16F10-TE-EVPs or K7M2-TE-EVPs, and PBS control. d, PCA of gene expression in the livers of mice educated with B16F10-TE-EVPs (left) and K7M2-TE-EVPs (right), compared to PBS-educated controls. n=5 mice per group for B16F10-TE-EVP education model; n=3 mice per group for K7M2-TE-EVP education model. e,f, PLS-DA plots of metabolites detected in the livers from B16F10-TE-EVP- (e) and K7M2-TE-EVP- (f) educated mice, compared to PBS-educated controls. Metabolomics data are shown in Supplementary Tables 8 and 9. n=5 B16F10-TE-EVP-educated mice and controls; n=6 K7M2-TE-EVP-educated mice and n=5 controls. g,h, Metabolite set enrichment analysis of the metabolites significantly changed in the livers from B16F10-TE-EVP- (g) and K7M2-TE-EVP- (h) educated mice, compared to PBS-educated controls (see lists of metabolites in Fig. 2e,f). n=5 B16F10-TE-EVP-educated mice and controls; n=6 K7M2-TE-EVP-educated mice and n=5 controls. i,j, PLS-DA plots of the lipid species in the livers from B16F10-TE-EVP- (i) and K7M2-TE-EVP- (j) educated mice, compared to PBS-educated controls. Lipidomics data are shown in Supplementary Tables 10 and 11. n=7 B16F10-TE-EVP-educated mice and n=5 controls; n=5 K7M2-TE-EVP-educated mice and controls. k,l, Volcano plots showing the significantly (P<0.05) enriched triglyceride species (red) and cholesteryl ester species (blue) in the livers from B16F10-TE-EVP- (k) and K7M2-TE-EVP- (l) educated mice, compared to PBS-educated controls. n=7 B16F10-TE-EVP-educated mice and n=5 controls; n=5 K7M2-TE-EVP-educated mice and controls. m,n, Representative images of BODIPY staining of the livers from B16F10-TE-EVP- (m) and K7M2-TE-EVP- (n) educated mice, and PBS-educated controls. Associated quantification of BODIPY staining was shown in Fig. 2i,j. Scale bars, 200 nm for (a) and 20 μm for (m,n). P values were determined by the two-tailed, unpaired Student’s t-test (b,k,l), or hypergeometric test (g,h). Data are mean ± s.e.m.
Extended Data Figure 5.
Extended Data Figure 5.. Tumor cell line (CL)-derived EVPs dysregulate liver metabolism.
a, Representative TEM images of B16F10-CL-EVPs (left) and K7M2-CL-EVPs (right). Scale bar, 200 nm. This experiment was repeated three times independently with similar results. b, NTA of B16F10-CL-EVPs and K7M2-CL-EVPs. Shown are graphs representative of three independent experiments. c,d, Representative images (left) and associated statistical analysis of relative signal intensity (right) of the livers from mice 24 h post intravenous injection of 10 μg of CellVue NIR815-labeled B16F10-CL-EVPs (c) and K7M2-CL-EVPs (d), and their mock PBS-injected controls. n=6 mice injected with B16F10-CL-EVPs or PBS mock reaction; n=7 mice injected with K7M2-CL-EVPs and n=6 mice injected with PBS mock control. e, Schematic illustration of syngeneic mouse education with B16F10-CL-EVPs or K7M2-CL-EVPs, and PBS control. f, PCA of gene expression in the livers from mice educated with B16F10-CL-EVPs (left) and K7M2-CL-EVPs (right), compared to PBS-educated controls. n=5 mice per group for B16F10-CL-EVP education model; n=3 mice per group for K7M2-CL-EVP education model. g,h, GSEA of gene expression profiles, ranked based on the sign of log2FC*(−log10P value), in the livers from B16F10-CL-EVP- (g) and K7M2-CL-EVP- (h) educated mice, compared to PBS-educated controls, using hallmark gene sets. Significantly changed signaling pathways with nominal P<0.05 are shown. n=5 B16F10-CL-EVP-educated mice and controls; n=3 K7M2-CL-EVP-educated mice and controls. Gene lists for signaling pathways are shown in Supplementary Tables 22 and 23. i, Heatmap showing the metabolites significantly changed in the livers of B16F10-CL-EVP-educated mice, compared to PBS-educated controls. n=5 control and n=7 B16F10-CL-EVP-educated mice. Metabolomics MS data are shown in Supplementary Table 29. j,k, Volcano plots showing the significantly (P<0.05) enriched lipid classes (red) (j) and the significantly (P<0.05) enriched triglyceride species (red) (k) in the livers of B16F10-CL-EVP-educated mice, compared to PBS-educated controls. n=5 control and n=6 B16F10-CL-EVPs educated mice. Lipidomics MS data are shown in Supplementary Table 30. l, Heatmap showing the metabolites significantly changed in the livers of K7M2-CL-EVP-educated mice, compared to PBS-educated controls. n=5 K7M2-CL-EVP-educated mice and controls. Metabolomics MS data are shown in Supplementary Table 31. m,n, Volcano plots showing the significantly (P<0.05) changed lipid class (blue) (m), and the significantly (P<0.05) enriched triglyceride species (red) (n) in the livers from K7M2-CL-EVP-educated mice, compared to PBS-educated controls. n=5 control and n=4 K7M2-CL-EVP-educated mice. Lipidomics MS data are shown in Supplementary Table 32. o,p, Representative immunofluorescence (IF) images (left) and associated statistical analysis (right) of BODIPY staining of the livers from B16F10-CL-EVP- (o) and K7M2-CL-EVP- (p) educated mice, and PBS-educated controls. n=4 mice per group for B16F10-CL-EVP-education model; n=5 mice per group for K7M2-CL-EVP-education model. Scale bars, 20 μm. q, Quantification of BODIPY staining of the livers from B16F10- and K7M2-conditioned media (CM) -educated mice, compared to blank DMEM media-educated mice. n=5 mice per group for B16F10-CM model and n=4 mice per group for K7M2-CM model. r, Quantification of BODIPY staining of the livers from PBS-educated and B16F10-CL-EVP-educated mice, in the absence or presence of B16F10-CM co-education. n=4 mice educated with PBS, n=5 mice educated with B16F10-CL-EVPs alone, and n=4 mice educated with B16F10-CL-EVPs together with B16F10-CM. P values were determined by the two-tailed, unpaired Student’s t-test for (c,d,j,k,m-p) and one-way ANOVA with post hoc Tukey’s test for (r). Data are mean ± s.e.m. NS, not significant.
Extended Data Figure 6.
Extended Data Figure 6.. Ablation of Rab27a expression suppresses EVP secretion from tumor cells.
a, Western blot analysis of Rab27a expression in B16F10 cells infected with vector control or Rab27a-CRISPR KO virus. Actin was used as a loading control. Shown is representative data from three independent experiments. b, Western blot analysis of Rab27a expression in K7M2 cells infected with vector control (shCon) or Rab27a-shRNA KD virus. Actin was used as a loading control. Shown is representative data from three independent experiments. c, NTA of the numbers of EVPs secreted from B16F10-control (Vector) or B16F10-Rab27a-KO cells. n=5 independent experiments per group. d, NTA of the numbers of EVPs secreted from K7M2-control (shCon) or K7M2-Rab27a-KD cells. n=3 independent experiments per group. e,f, Representative NTA profiles (e) and associated analysis of the diameter mode (f) of EVPs isolated from B16F10-control (Vector) or B16F10-Rab27a-KO cells. n=6 independent experiments per group. g,h, Representative NTA profiles (g) and associated analysis of the diameter mode (h) of EVPs isolated from K7M2-control (shCon) or K7M2-Rab27a-KD cells. n=3 independent experiments per group. i, Proliferation of B16F10-control (Vector) and B16F10-Rab27a-KO cells. n=3 independent experiments. j, Proliferation of K7M2-control (shCon) and K7M2-Rab27a-KD cells. n=4 independent experiments. k, Statistical analysis of the weights of tumors from mice inoculated with B16F10-control (Vector) or B16F10-Rab27a-KO cells. n=15 mice per group. l, Statistical analysis of the weights of tumors from mice inoculated with K7M2-control (shCon) or K7M2-Rab27a-KD cells. n=8 mice per group. m,n, Statistical analysis showing the similar tumor burden from a subset of mice in k and l inoculated with B16F10-Rab27a-KO cells (m), or K7M2-Rab27a-KD cells (n) subjected to BODIPY staining of their livers as shown in (o,p). n=5 mice per group. o,p, Representative images (left) and associated statistical analysis (right) of BODIPY staining of the livers from B16F10-Rab27a-KO (o) and K7M2-Rab27a-KD (p) tumor bearing mice, and their respective controls. n=5 mice per group. Scale bars, 20 μm. q, PCA of the gene expression profiling in the livers from mice educated with control PBS, B16F10 exomeres, or B16F10 Exo-S, or B16F10 Exo-L for 4 weeks. n=4 mice per group. r-t, GSEA of gene expression profiles, which were ranked based on the sign of log2FC*(−log10P value), in the livers from B16F10 exomere- (r), Exo-S- (s), and Exo-L- (t) educated mice, compared to PBS-educated controls. (n=4 each). Signaling pathways significantly changed with nominal P<0.05 are shown. Gene lists for signaling pathways are shown in Supplementary Tables 24–26. u, EVPs isolated from equal numbers of B16F10-Vector control and B16F10-Rab27a-KO cells were resolved via AF4. Shown are real time measurement of UV on a relative scale (right axis), indicating the abundance of fractionated particles. Shaded areas mark the elution time periods for exomeres (red), Exo-S (blue) and Exo-L (green), respectively. As reflected by the UV signal, the production of exomeres, Exo-S (to a less extent) and Exo-L (to the least extent) were reduced in the B16F10-Rab27a-KO cells compared to the B16F10-Vector control cells. P values were determined by the two-tailed, unpaired Student’s t-test (c,d,f,h,k-p), or two-way ANOVA followed with Bonferroni’s multiple comparisons test (i,j). Data are mean ± s.e.m. NS, not significant. KO, knockout. KD, knockdown. For western blotting source data of (a,b), see Supplementary Figure 1.
Extended Data Figure 7.
Extended Data Figure 7.. Tumor-derived EVPs are uptaken by KCs in the liver.
a, Flow cytometry analysis of the percentage of EVP positive cells in the livers from mice 24 h post intravenous injection of 10 μg of CellVue Burgundy-labeled B16F10-CL-EVPs (left) and K7M2-CL-EVPs (right), and PBS controls. n=7 mice per group. b, Flow cytometry analysis of the percentage of different cell types, including Cd45+ immune cells, Cd31+ vascular endothelial cells, desmin+ stellate cells, albumin+ hepatocytes, Lyve1+ lymphatic and sinusoidal endothelial cells, among the B16F10-CL-EVP and K7M2-CL-EVP positive cells shown in a. n=4 each. c,d, Representative flow cytometry gating strategy evaluating the percentage of different cell types, including Cd31+ vascular endothelial cells, albumin+ hepatocytes, Lyve1+ lymphatic and sinusoidal endothelial cells, desmin+ stellate cells, Cd45+ immune cells and Cd11b+F4/80+ KCs in Cd45+ immune cells, among the B16F10-CL-EVP- (c) and K7M2-CL-EVP- (d) positive cells shown in (a,b and Fig. 3a). e, Representative images of the immunofluorescence (IF) co-staining of EVPs (indicated by white arrows) with Cd31+ vascular endothelial cells, albumin+ hepatocytes, Lyve1+ lymphatic and sinusoidal endothelial cells, and desmin+ stellate cells 24 h post intravenous injection of B16F10-CL-EVPs (top) or K7M2-CL-EVPs (bottom). DNA in blue. Scale bars, 20 μm. This experiment was repeated three times independently with similar results. P values were determined by the two-tailed, unpaired Student’s t-test (a).
Extended Data Figure 8.
Extended Data Figure 8.. Depletion of Kupffer cells alleviates tumor EVP-induced fatty liver formation without impairing tumor growth.
a, Schematic illustration of liposome or clodronate (100 μl of suspension per 10 g of mouse weight) treatment, delivered via intravenous injection to B16F10-Tb and K7M2-Tb mice. The concentration of clodronate in the suspension is 5 mg/ml. b, Representative flow cytometry gating strategy examining the abundance of KCs (Cd11b+F4/80+) in the livers from PBS-injected control mice, B16F10-Tb (up) or K7M2-Tb (bottom) mice, and tumor-bearing mice treated with liposome or clodronate. Associated quantification of KC abundance was shown in Fig. 3c. c,d, Representative IF images (left) and associated statistical analysis (right) of KC staining of the livers from B16F10-Tb (c) and K7M2-Tb (d) mice, and tumor-bearing mice treated with liposome or clodronate. F4/80 staining for KCs in red, and DNA in blue. For B16F10-Tb model, n=6 B16F10-Tb mice, n=5 B16F10-Tb mice treated with liposome or clodronate. For K7M2-Tb model, n=5 mice per group. e, Measurement of the tumor volumes from B16F10-Tb (left) or K7M2-Tb (right) mice, and tumor-bearing mice treated with liposome or clodronate as shown in (a). n=5 B16F10-Tb mice and n=7 B16F10-Tb mice treated with liposome or clodronate; n=3 K7M2-Tb mice and n=5 K7M2-Tb mice treated with liposome or clodronate. f, Representative IF images of BODIPY staining of the livers from PBS-injected control mice, B16F10- or K7M2-Tb mice, and the tumor-bearing mice treated with liposome or clodronate as shown in Fig. 3d. g, Representative IF images (left) and associated statistical analysis (right) of the precision-cut liver slices (PCLS) stained with F4/80 (red) and DAPI (blue) to show the KC depletion in mouse livers 24 h post treatment with liposome or clodronate (100 μl of suspension per 10 g of mouse weight). n=3 mice per group. h, Schematic illustration of precision-cut liver slices (PCLS) from naïve mice 24 h post treatment with liposome or clodronate (100 μl of suspension per 10 g of mouse weight) followed by EVP (10 μg/ml) treatment ex vivo for 48 h. Liver slices were then subjected to BODIPY staining. i,j, Representative IF images of BODIPY staining of PCLS sectioned from liposome- or clodronate- (100 μl of suspension per 10 g of mouse weight) treated mice (as shown in g) that were further treated with 10 μg/ml of B16F10-CL-EVPs or B16F10-TE-EVPs (i), K7M2-CL-EVPs or K7M2-TE-EVPs (j) ex vivo for 48 h (see also Fig. 3e,f). PCLS from naïve mice treated with PBS were used as controls. BODIPY in green and DNA in blue. Scale bars, 20 μm. P values were determined by the one-way ANOVA with post hoc Tukey’s test (c,d) , or two-way ANOVA followed with Bonferroni’s multiple comparisons test (e), or two-tailed, unpaired Student’s t-test (g). Data are mean ± s.e.m. NS, not significant.
Extended Data Figure 9.
Extended Data Figure 9.. Tumor EVPs promote TNFα secretion from KCs.
a, Representative IF image of the primary KCs isolated from naïve mice. F4/80 in red and DAPI in blue. Shown is representative image from three independent experiments. Scale bar, 20 μm. b, ELISA analysis of IL-6 secretion from naïve mice-derived KCs after treatment with LPS (1 μg/ml). n=3 independent experiments per group. c,d, Representative cytokine array blots and associated quantification charts for the cytokines and chemokines in the whole cell lysates of KCs isolated from B16F10-Tb mice (c) and K7M2-Tb mice (d), and their respective PBS-injected controls. e,f, Representative cytokine array blots and associated quantification charts for the cytokines and chemokines in the conditioned media of KCs isolated from naïve mice and educated with 10 μg/ml of B16F10-CL-EVPs (e) or K7M2-CL-EVPs (f) in vitro for 3 days, and their respective PBS-educated controls. g, TNFα ELISA on the conditioned medium (CM) of KCs educated with 10 μg/ml of B16F10-CL-EVP- (left), or K7M2-CL-EVP- (right), and their respective PBS controls for 3 days. n=3 independent experiments per group. h, qRT-PCR analysis of Tnf expression in KCs isolated from B16F10-Tb (left), or K7M2-Tb (right) mice, and their respective PBS-injected controls. n=4 mice per group. i, qRT-PCR analysis of Tnf expression in KCs treated with control PBS, EVPs derived from B16F10 cells or B16F10 tumor explants (left), or EVPs derived from K7M2 cells or K7M2 tumor explants (right) for 4 h. n=3 independent experiments per group. j, TNFα ELISA on EVP-depleted CM from B16F10 and K7M2 cells. n=2 independent experiments. ND, not detected. k, GSEA of gene expression profiles, ranked based on the sign of log2FC*(−log10P value), in hepatocytes 24 h post treatment with recombinant murine TNFα protein (25 ng/ml), compared to PBS control, using Gene Ontology gene sets. Shown are downregulated lipid catabolism-associated gene sets. NES, normalized enrichment score. NOM p-value, nominal p-value. l, Schematic Illustration of anti-TNFα antibody (200 μg/mouse) or IgG1 isotype control (200 μg/mouse) treatment of tumor-bearing mice or tumor EVP-educated mice. I.P., intraperitoneal. m, Weights of tumors from mice inoculated with B16F10 (left) or K7M2 (right) cells and treated with anti-TNFα antibody or IgG1 isotype control as shown in (l). n=5 mice per group for B16F10-Tb model and n=3 per group for K7M2-Tb model. n,o, Representative images of BODIPY staining of the livers from B16F10- and K7M2-Tb mice (n), and B16F10-CL-EVP- and K7M2-CL-EVP-educated mice (o), treated with anti-TNFα antibody or IgG1 isotype control (see also Fig. 4d,e). Scale bars, 20 μm. P values were determined by the one-way ANOVA with post hoc Tukey’s test (b), or two-tailed, unpaired Student’s t-test (g-i,m). Data are mean ± s.e.m. NS, not significant. For cytokine array blot source data of (c-f), see Supplementary Figure 2.
Extended Data Figure 10.
Extended Data Figure 10.. Tumor EVP-packaged palmitic acid (PA) induces TNFα secretion from KCs.
a, Volcano plot of metabolites significantly changed (highlighted in red, P<0.05) in B16F10-TE-EVPs versus skin-TE-EVPs. n=5 B16F10-TE-EVPs and n=4 skin-TE-EVPs. b, Quantitative MS analysis of the long-chain free fatty acids, including saturated and unsaturated fatty acids, in the B16F10-TE-EVPs and skin-TE-EVPs. n=3 per EVP group. c, qRT-PCR analysis of Tnf expression in KCs from naïve C57BL/6 mice treated with DMSO or the Tlr4 inhibitor TAK (5 μM) for 1 h followed by vehicle (100% ethanol diluted into PA-carrier medium at 1:1000 dilution) or 200 μM of PA with or without TAK (5 μM) for 4 h. n=3 mice per group. d, FFA content in the EVPs isolated from B16F10 (left) or K7M2 (right) cells treated with DMSO or C75 (40 μM) for 48 h. n=4 independent experiments for DMSO- or C75-treated B16F10 cells; n=3 independent experiments for DMSO- or C75-treated K7M2 cells. e, qRT-PCR analysis of Tnf expression in KCs isolated from naïve C57BL/6 (left and middle) or BALB/c (right) mice then treated with control PBS, Melan-a-CL-EVPs (left), skin-TE-EVPs (middle), osteoblast-EVPs (Ob-EVPs), or bone-TE-EVPs (right) in vitro for 4 h. n=3 independent experiments per group for treatment with Melan-a-CL-EVPs, Ob-EVPs, bone-TE-EVPs, and their PBS controls. n=4 independent experiments for treatment with skin-TE-EVPs and PBS. f, Quantification of BODIPY staining of precision-cut liver slices treated with Ob-EVPs or K7M2-CL-EVPs ex vivo for 48 h, or livers educated with Ob-EVPs in vivo for 4 weeks, compared to PBS-treated or PBS-educated controls, respectively. n=4 mice per group for ex vivo EVP treatment and n=5 mice per group for in vivo EVP education. g, Representative LI-COR Odyssey images (left) and associated statistical analysis of relative signal intensity (right) of the livers from mice 24 h post intravenously injection of 10 μg of CellVue NIR815-labeled Ob-EVPs and mock PBS control. n=3 mice per group. h, Quantification of BODIPY staining of the precision-cut liver slices treated with control PBS, bone-TE-EVPs or K7M2-TE-EVPs (left), skin-TE-EVPs or B16F10-TE-EVPs (right) ex vivo for 48 h. n=4 mice per group. i, qRT-PCR analysis of Tnf expression in the KCs isolated from C57BL/6 mice and treated with DMSO or 12-O-tetradecanoylphorbol-13-acetate (TPA) (0.2 μM) in vitro for 4 h. TPA induced KC Tnf expression, compared to DMSO control. n=3 independent experiments. j, Representative LC-MS/MS chromatograms of TPA standard (5 nM, left) and TPA detected in the Mela-a-CL-EVPs (right). The concentration of TPA detected in Mela-a-CL-EVPs was 6.5 nM per 100 μg of EVPs. k, qRT-PCR analysis of Tnf expression in KCs which were pre-treated with DMSO or TAK (5 μM) for 1 h, and subsequently treated with PBS, 10 μg of B16F10-TE-EVPs or K7M2-TE-EVPs with or without TAK (5 μM) for 4 h. n=3 independent experiments. P values were determined by the two-tailed, unpaired Student’s t-test (a,b,d-i,k), or one-way ANOVA with post hoc Tukey’s test (c), or Data are mean ± s.e.m. NS, not significant.
Extended Data Figure 11.
Extended Data Figure 11.. Tumor EVPs suppress liver drug metabolism and enhance chemotoxicity.
a, Schematic illustration of the procedure of drug-metabolizing activity analysis of the precision-cut liver slices. Substrates of Cytochrome P450 enzymes (including phenacetin, bupropion, tolbutamide, dextromethorphan and midazolam) were added to the media, and their corresponding metabolites (including acetaminophen, hydroxybupropion, 4-hydroxytolbutamide, dextrorphan and 1-hydroxymidazolam) were analyzed by LC/MS/MS. b, Drug-metabolizing activity of the core CYP enzymes in the precision-cut liver slices sectioned from PBS-injected mice, and B16F10-Tb mice treated with anti-TNFα antibody or IgG1 isotype control. n=5 mice per group. c, Drug-metabolizing activity of Cyp1a2 (left) or Cyp2b10 (right) in the precision-cut liver slices pre-treated with DMSO control or mathoxsalen (5 μM), or phenobarbital (0.1 mM) for 24 h. n=3 mice per group. d, Drug-metabolizing activity of the core CYP enzymes in the precision-cut liver slices sectioned from naïve mice pre-treated with PBS or 10 μg/ml of B16F10-CL-EVPs with co-treatment of anti-TNFα antibody (20 μg/ml) or IgG1 isotype (20 μg/ml) control for 24 h. n=5 mice per group. e, Schematic illustration of the procedure of chemotoxicity analysis using EVP-educated mice. For melanoma model (top), C57BL/6 mice were intravenously injected with PBS or 10 μg of B16F10-CL-EVPs every other day for 4 weeks, and then intraperitoneally injected with dacarbazine (60 mg/kg) or 0.9% NaCl together with intravenous injection of PBS or 10 μg of B16F10-CL-EVPs every other day for 4 times. Retroorbital blood of the mice was then collected for complete blood count. For osteosarcoma model (bottom), BALB/c mice were intravenously injected with PBS, 10 μg of osteoblast-EVPs (Ob-EVPs) or K7M2-CL-EVPs every other day for 4 weeks, and then intraperitoneally injected with doxorubicin (1 mg/kg) or DMSO every 24 h together with intravenous injection of PBS, 10 μg of Ob-EVPs or K7M2-CL-EVPs every other day for 25 days, and mice were then subjected to echocardiography. f, Statistical analysis of the heart rates of PBS-, Ob-EVP- or K7M2-CL-EVP-educated mice after treatment of DMSO or doxorubicin (cumulative dose of 25 mg/kg). No difference of heart rates was observed in different groups. n=6 mice for PBS groups and n=7 mice for K7M2-CL-EVP groups, n=5 and n=6 for DMSO and doxorubicin treated Ob-EVP-educated mice, respectively. g, Representative M-mode images of echocardiography for PBS-, Ob-EVP- or K7M2-CL-EVP-educated mice after treatment of DMSO or doxorubicin as described in (e). LVIDd, left ventricular internal dimension at end diastole. LVIDs, left ventricular internal dimension at end systole. EF, ejection fraction. FS, fractional shortening. P values were determined by the one-way ANOVA with post hoc Tukey’s test (b,d), or two-tailed, unpaired Student’s t-test (c), or two-way ANOVA followed with Fisher’s LSD test (f). Data are mean ± s.e.m. NS, not significant. Ob, osteoblast. I.V., intravenours. I.P., intraperitoneal.
Figure 1.
Figure 1.. Distant primary tumors induce metabolic dysfunction in the liver.
a, Venn diagram analysis of DEGs (q<0.05) in livers from B16F10-Tb (n=3) and K7M2-Tb mice (n=5), compared to their respective PBS-injected controls. b, GSEA of the common DEGs in (a) using hallmark gene sets, and the significantly changed signaling pathways with FDR<0.1 are shown. Gene lists for signaling pathways are shown in Supplementary Table 6. c,d, Volcano plots showing lipid classes (labeled in red, P<0.05) significantly enriched in the livers of B16F10-Tb (c) and K7M2-Tb (d) mice, compared to their respective PBS-injected controls. (n=5 each). e,f, Representative images (left) and associated statistical analysis (right) of BODIPY staining of the livers from B16F10-Tb (n=5) (e) and K7M2-Tb (n=4) (f) mice, and their respective PBS-injected controls. g. GSEA of the normalized gene expression values of tumor-free livers from PDAC patients (n=5) compared to control subjects (n=8) with benign lesions using hallmark gene sets. Downregulated signaling pathways with FDR<0.05 and top 10 upregulated signaling pathways with FDR<0.05 are shown. Gene lists for signaling pathways are shown in Supplementary Table 7. h, Representative images (left) and associated statistical analysis (right) of BODIPY staining of the livers from PDAC patients (n=11) and control subjects (n=8) with benign lesions. Scale bars, 20 μm. P values were determined by the two-tailed, unpaired Student’s t-test (c-f,h). Data are mean ± s.e.m. Tb, tumor-bearing. NES, normalized enrichment score. FC, fold change. R.U., relative unit.
Figure 2.
Figure 2.. Tumor-derived EVPs induce liver metabolic dysfunction.
a,b, Representative LI-COR Odyssey images (left) and associated quantification of relative signal intensity (right) of the livers from mice 24 h post intravenously injection of 10 μg of CellVue NIR815-labeled B16F10-TE-EVPs (a) and K7M2-TE-EVPs (b), and PBS controls. n=3 each. c,d, GSEA of gene expression profiles, which were ranked based on the sign of log2FC*(−log10P value), in livers from mice educated for 4 weeks with B16F10-TE-EVPs (n=5) (c), or K7M2-TE-EVPs (n=3) (d), compared with PBS-educated controls, using hallmark gene sets, and the significantly changed signaling pathways with FDR<0.05 are shown. Gene lists for signaling pathways are shown in Supplementary Tables 12 and 13. e,f, Heatmaps showing the metabolites significantly changed in the livers from B16F10-TE-EVP- (e) and K7M2-TE-EVP- (f) educated mice, compared to PBS-educated controls. n=5 B16F10-TE-EVP-educated mice and controls; n=6 K7M2-TE-EVP-educated mice, and n=5 controls. g,h, Volcano plots showing the significantly enriched lipid classes (labeled in red, P<0.05) in the livers from B16F10-TE-EVP- (g) and K7M2-TE-EVP- (h) educated mice, compared to PBS-educated controls. n=7 B16F10-TE-EVP-educated mice, and n=5 controls; n=5 K7M2-TE-EVP-educated mice and controls. i,j, Quantification of BODIPY staining of the livers from B16F10-TE-EVP- (i) and K7M2-TE-EVP- (j) educated mice, and PBS-educated controls. n=5 each. k, Representative TEM images of B16F10 exomeres, Exo-S and Exo-L. This experiment was repeated three times independently with similar results. l, Representative images (left) and associated quantification (right) of BODIPY staining of the livers from mice educated with PBS, B16F10 exomeres, B16F10 Exo-S, or B16F10 Exo-L for 4 weeks. n=4 each. Scale bar, 200 nm for (k) and 20 μm for (l). P values were determined by the two-tailed, unpaired Student’s t-test (a,b,g-j,l). Data are mean ± s.e.m. EMT, epithelial mesenchymal transition. ROS, reactive oxygene species.
Figure 3.
Figure 3.. Uptake of tumor-derived EVPs by KCs induces fatty liver formation.
a, Flow cytometry analysis of the percentage of KCs in the Cd45+ immune cells. n=5 each. b, Representative immunofluorescence images of the co-localization of KCs (green) and B16F10-CL-EVPs (red, left), or K7M2-CL-EVPs (red, right). DNA in blue. Scale bar, 20 μm. This experiment was repeated three times independently with similar results. c,d, Flow cytometry analysis of the percentage of KCs (c) and quantification of BODIPY staining (d) in the livers from PBS-injected control mice, B16F10- or K7M2-Tb mice, and the tumor-bearing mice treated with liposome or clodronate as illustrated in Extended Data Fig. 8a. In (c), B16F10-Tb model (n=6 controls and Tb mice, n=5 Tb mice treated with liposome, n=7 Tb mice treated with clodronate); K7M2-Tb model (n=10 controls and Tb mice, n=8 Tb mice treated with liposome, n=9 Tb mice treated with clodronate). In (d), B16F10-Tb model (n=4 controls and Tb mice, n=6 Tb mice treated with liposome, n=8 Tb mice treated with clodronate); K7M2-Tb model (n=7 controls, n=5 Tb mice, n=6 Tb mice treated with liposome, n=7 Tb mice treated with clodronate). e,f, Quantification of the BODIPY staining of precision-cut liver slices from liposome- or clodronate- treated mice after treatment with B16F10-CL-EVPs or B16F10-TE-EVPs (e), or K7M2-CL-EVPs or K7M2-TE-EVPs (f), following the procedure illustrated in Extended Data Fig. 8h. n=4 each. P values were determined by the one-way ANOVA with Tukey’s test (c-f). Data are mean ± s.e.m. NS, not significant.
Figure 4.
Figure 4.. Tumor EVP-packaged palmitic acid induces TNFα secretion from KCs and promotes fatty liver generation.
a, TNFα concentration determined by ELISA in the plasma from B16F10-Tb (left) and K7M2-Tb mice (right), and PBS-injected controls. B16F10-Tb model (n=6 controls, n=9 Tb mice), K7M2-Tb model (n=5). b, TNFα concentration in the plasma of B16F10-CL-EVP- and B16F10-TE-EVP-educated mice (n=4 each) (left), K7M2-CL-EVP- and K7M2-TE-EVP-educated mice (n=5 each) (right), and PBS-educated controls. c, Representative images (left) and associated statistical analysis (right) of BODIPY staining of the primary hepatocytes 48 h post treatment with recombinant murine TNFα protein (25 ng/ml), or PBS control. n=7 independent experiments. d,e, Statistical analysis of BODIPY staining of the livers from B16F10- and K7M2-Tb mice (d), and B16F10-CL-EVP- and K7M2-CL-EVP-educated mice (e), treated with anti-TNFα antibody or IgG1 isotype control. B16F10-Tb model (n=7), K7M2-Tb model (n=3), B16F10-CL-EVP model (n=5), K7M2-CL-EVP model (n=4). f, g, Quantitative analysis of the long-chain free fatty acids in the EVPs derived from B16F10 and Melan-a cells (f), and K7M2 cells and primary murine osteoblasts (g). n=5 per group. h, qRT-PCR analysis of the Tnf expression in KCs 4 h post treatment with PBS, 10 μg of EVPs derived from DMSO or C75 (40 μM) treated B16F10 cells (left) or K7M2 cells (right). n=4 independent experiments. i, qRT-PCR analysis of Tnf expression in KCs which were pre-treated with DMSO or TAK (5 μM) for 1 h, and subsequently treated with PBS, 10 μg of B16F10-CL-EVPs (left) or K7M2-CL-EVPs (right) with or without TAK (5 μM) for 4 h. n=3 independent experiments. P values were determined by the two-tailed, unpaired Student’s t-test (a-g), or one-way ANOVA with Tukey’s test (h,i). Data are mean ± s.e.m. Scale bar, 20 μm. NS, not significant.
Figure 5.
Figure 5.. Tumor EVPs suppress liver drug metabolism and enhance chemotoxicity.
a, qRT-PCR analysis of the expression of Cyp genes in the primary hepatocytes treated with PBS or recombinant murine TNFα protein (25 ng/ml) for 24 h. n=3 independent experiments. b,c, qRT-PCR analysis of the expression of Cyp genes in hepatocytes isolated from B16F10-Tb mice (n=7) (b) and B16F10-CL-EVP-educated mice (n=5) (c) treated with anti-TNFα antibody or IgG1 isotype control, compared to their respective PBS-injected controls. d, GSEA of gene expression profiles in the TNFα-treated murine primary hepatocytes (top), in the livers from B16F10-Tb mice (middle) and cancer patients (bottom), compared to their respective controls. n=3 per group for TNFα treatment and B16F10-Tb mice, and PBS controls; n=5 cancer patients and n=8 control subjects. e, Analysis of red blood cell (RBC), reticulocyte (RET) and hemoglobin (HGB) counts in PBS- (n=9) or B16F10-CL-EVP-educated mice (n=12) after treatment with dacarbazine (60 mg/kg) or 0.9% NaCl. f, Analysis of left ventricular ejection fraction and fractional shortening (M-mode) in PBS-, osteoblast (Ob)-EVP-, or K7M2-CL-EVP-educated mice after treatment of doxorubicin (cumulative dose of 25 mg/kg) or DMSO. PBS groups (n=6), K7M2-CL-EVP groups (n=7), Ob-EVP group treated with DMSO (n=5) or doxorubicin (n=6). g, A schematic illustration of the working model. Tumor-derived EVPs specifically target KCs in the liver. EVP-packaged saturated fatty acids, such as palmitic acid (PA), stimulate the secretion of TNFα from KCs depending on Tlr4 functional integrity. This produces a pro-inflammatory microenvironment in the liver, thereby systemically inducing fatty liver formation and suppressing the drug-metabolizing activity of the liver. P values were determined by the two-tailed, unpaired t-test (a), one-way ANOVA with Tukey’s test (b,c), or two-way ANOVA with Fisher’s LSD test (e,f). Data are mean ± s.e.m. NS, not significant. LDs, lipid droplets.

Comment in

References

    1. McAllister SS & Weinberg RA The tumour-induced systemic environment as a critical regulator of cancer progression and metastasis. Nat Cell Biol 16, 717–727 (2014). 10.1038/ncb3015 - DOI - PMC - PubMed
    1. Wang G et al. Metastatic cancers promote cachexia through ZIP14 upregulation in skeletal muscle. Nat Med 24, 770–781 (2018). 10.1038/s41591-018-0054-2 - DOI - PMC - PubMed
    1. Lucotti S, Kenific CM, Zhang H & Lyden D Extracellular vesicles and particles impact the systemic landscape of cancer. EMBO J 41, e109288 (2022). 10.15252/embj.2021109288 - DOI - PMC - PubMed
    1. Zhang G et al. Tumor induces muscle wasting in mice through releasing extracellular Hsp70 and Hsp90. Nat Commun 8, 589 (2017). 10.1038/s41467-017-00726-x - DOI - PMC - PubMed
    1. Zhang H et al. Identification of distinct nanoparticles and subsets of extracellular vesicles by asymmetric flow field-flow fractionation. Nat Cell Biol 20, 332–343 (2018). 10.1038/s41556-018-0040-4 - DOI - PMC - PubMed

Publication types

MeSH terms