. 2023 Jun;618(7964):402-410.
doi: 10.1038/s41586-023-06090-9. Epub 2023 May 24.

Heteromeric clusters of ubiquitinated ER-shaping proteins drive ER-phagy

Affiliations

Heteromeric clusters of ubiquitinated ER-shaping proteins drive ER-phagy

Hector Foronda et al. Nature. 2023 Jun.

Abstract

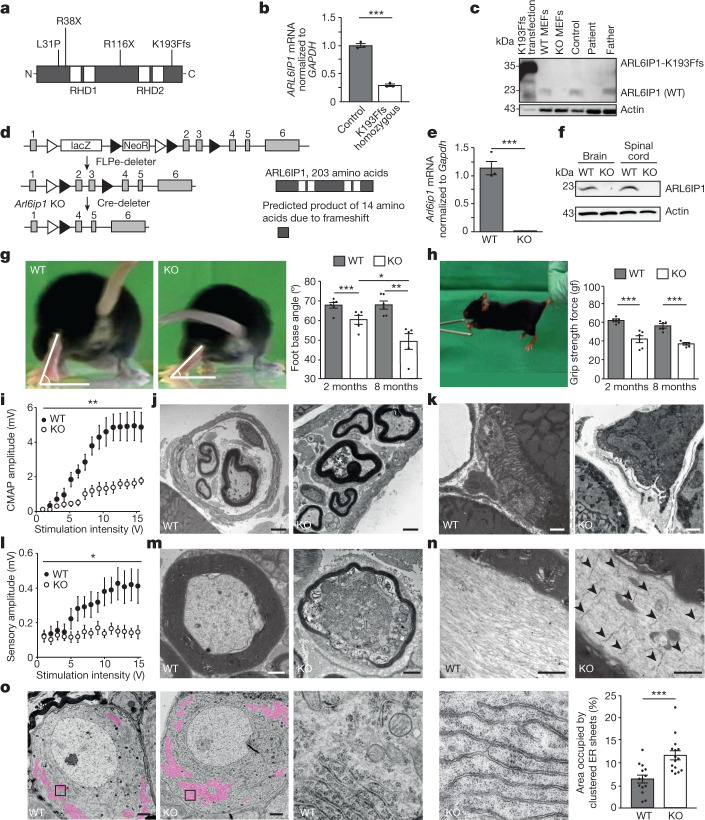
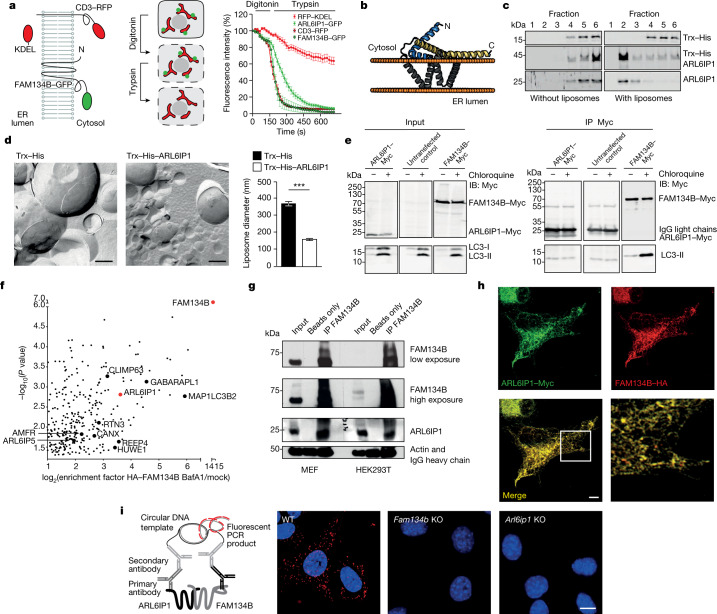
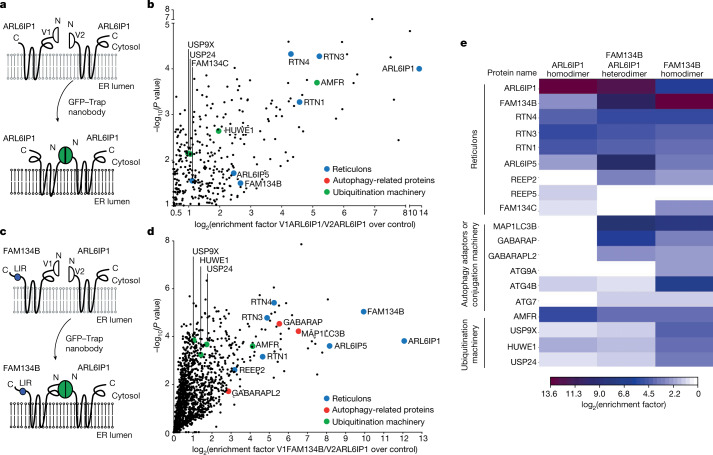
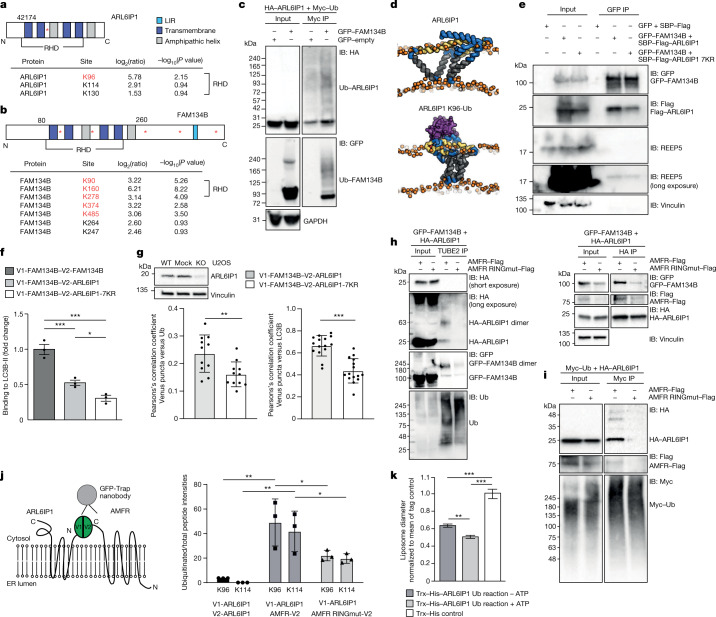
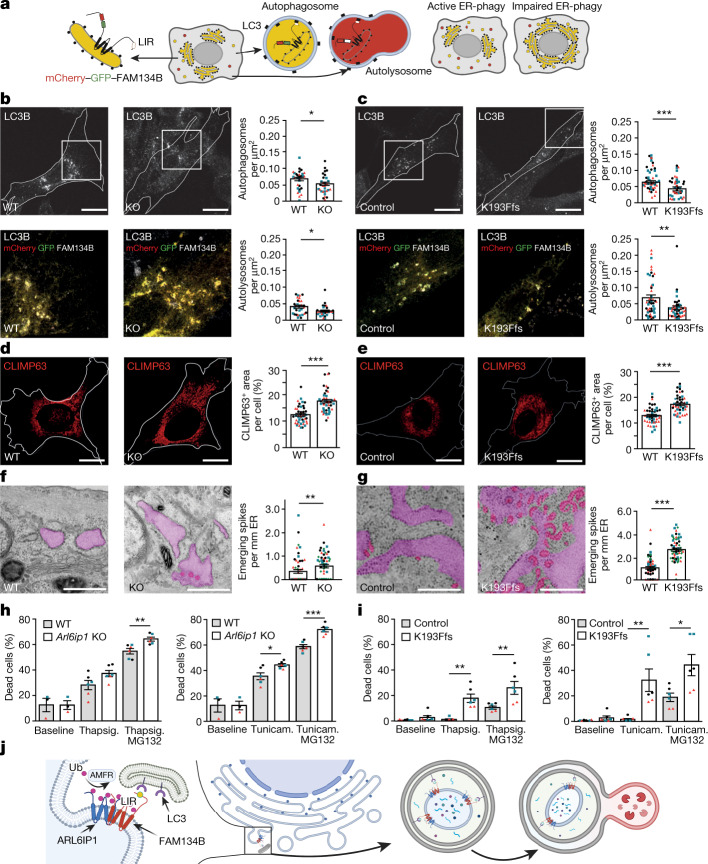
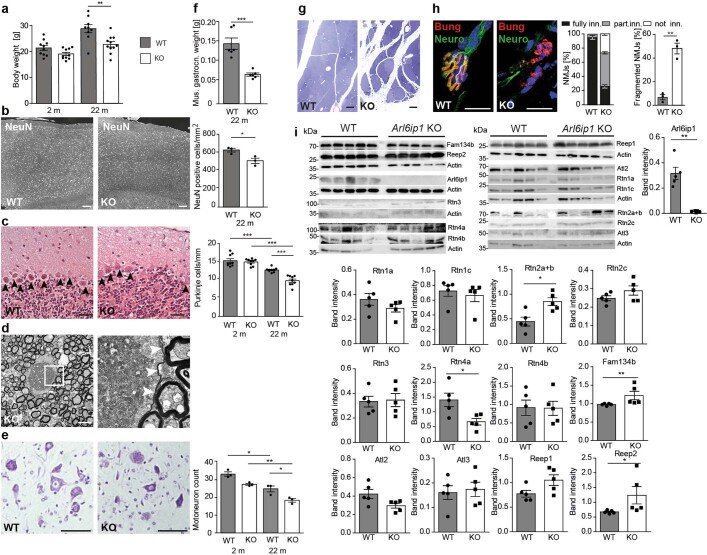
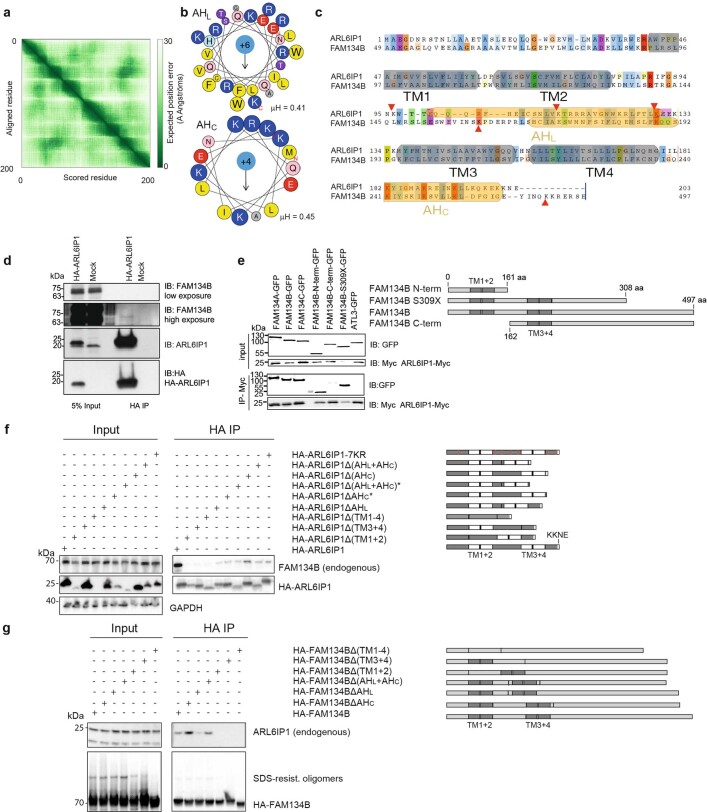
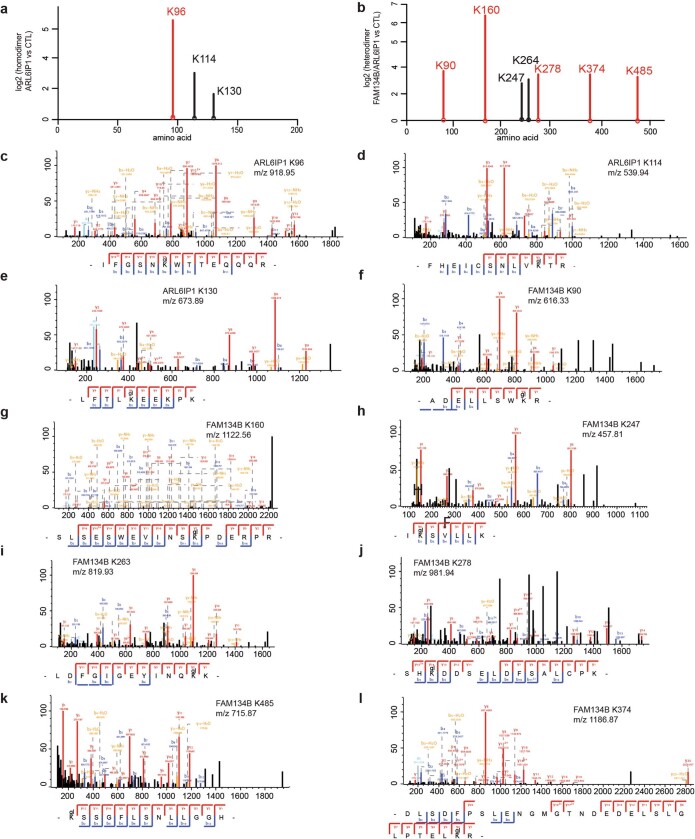
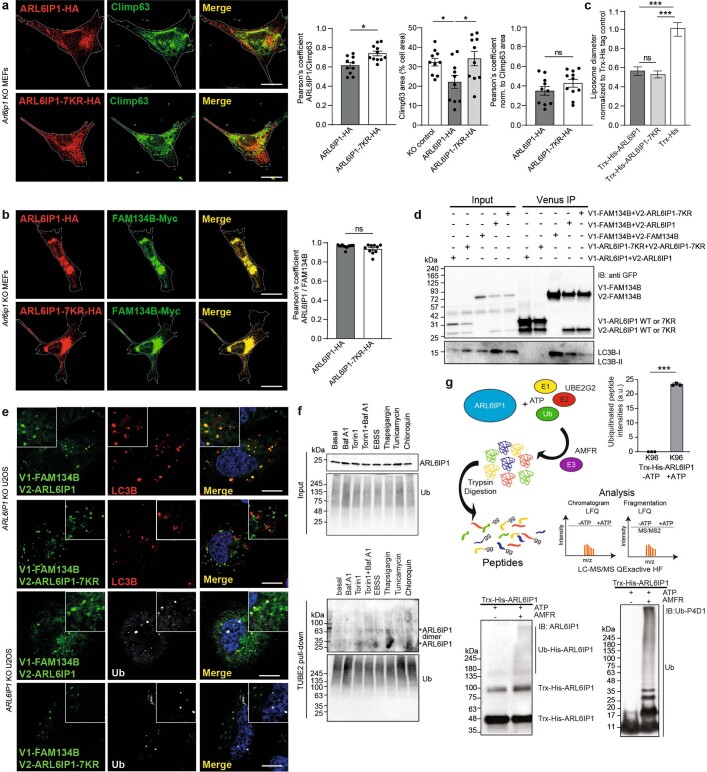
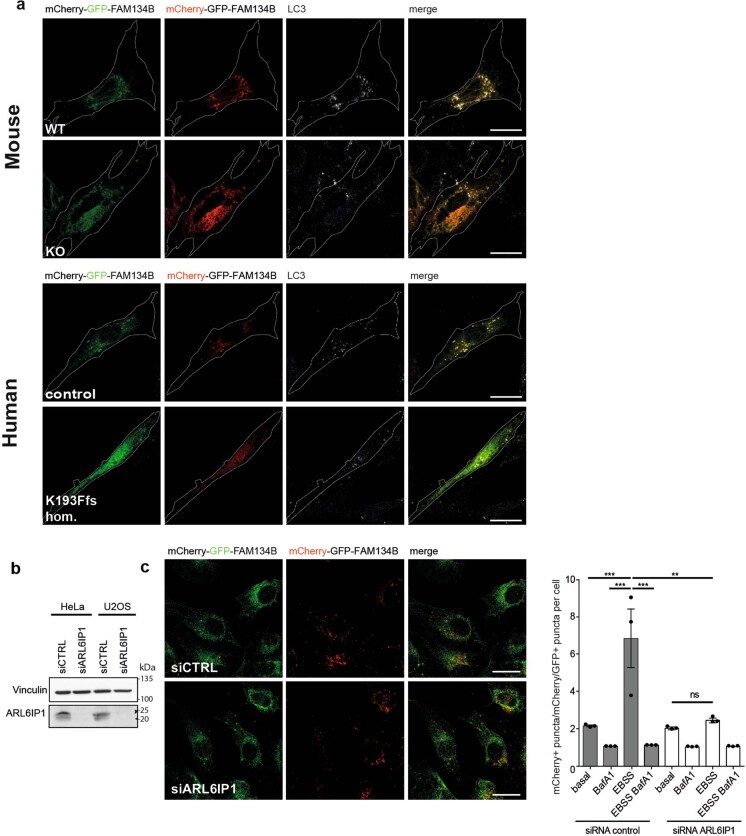
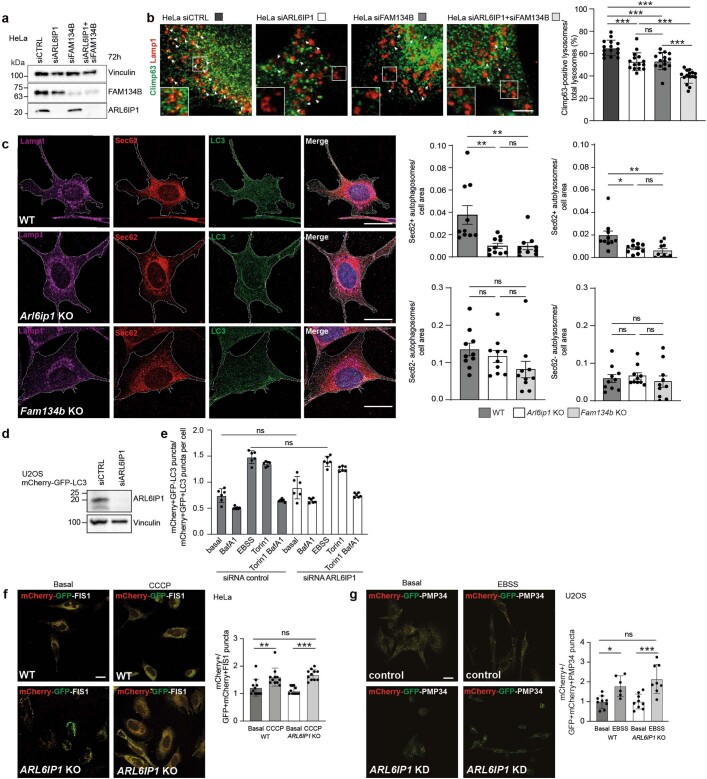
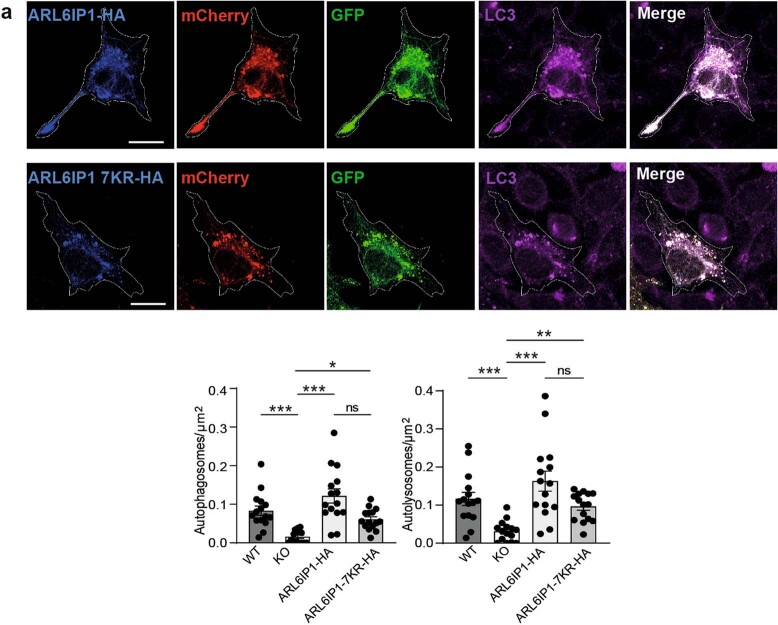
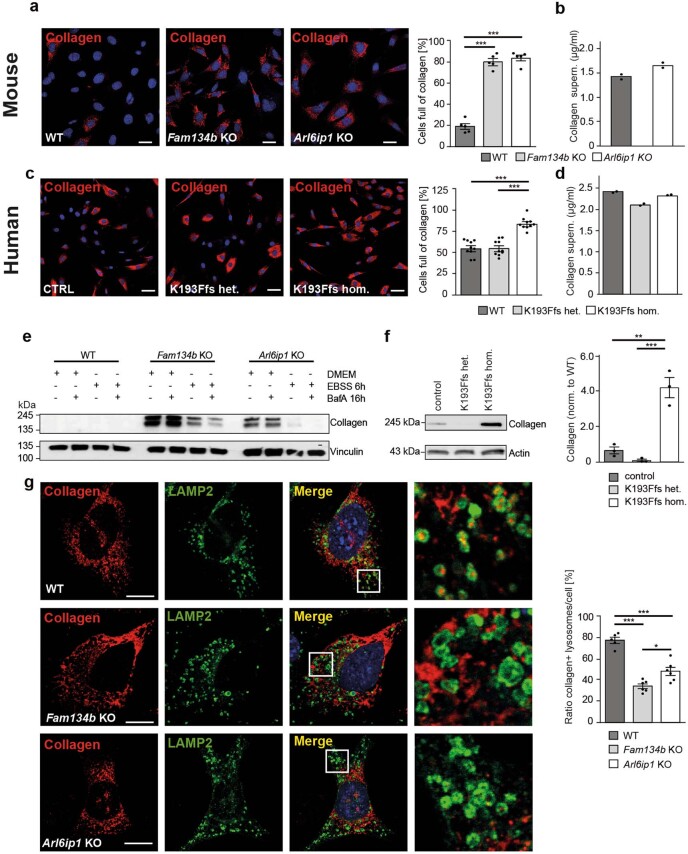
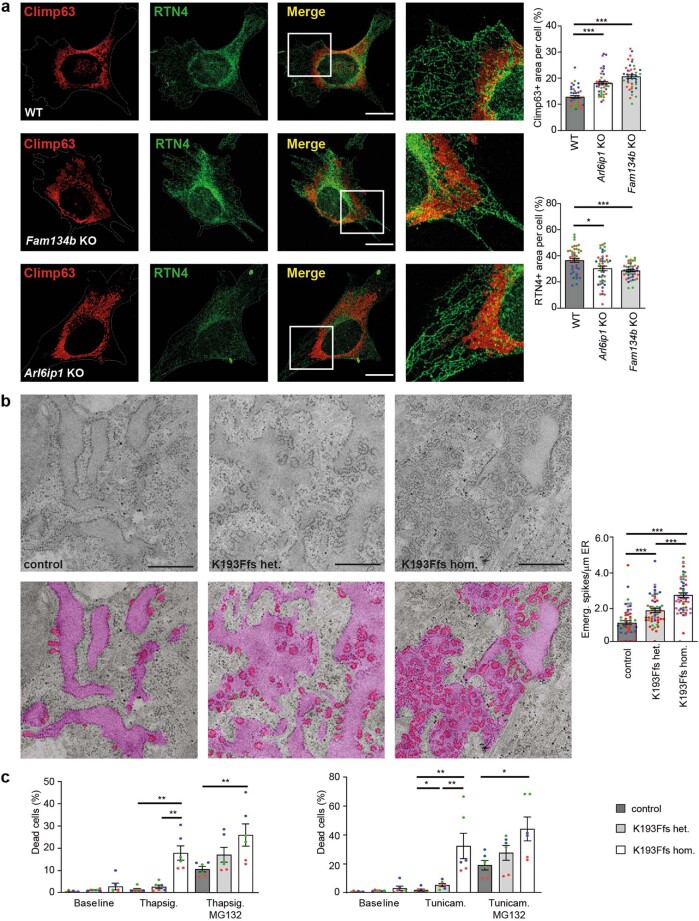
Membrane-shaping proteins characterized by reticulon homology domains play an important part in the dynamic remodelling of the endoplasmic reticulum (ER). An example of such a protein is FAM134B, which can bind LC3 proteins and mediate the degradation of ER sheets through selective autophagy (ER-phagy)1. Mutations in FAM134B result in a neurodegenerative disorder in humans that mainly affects sensory and autonomic neurons2. Here we report that ARL6IP1, another ER-shaping protein that contains a reticulon homology domain and is associated with sensory loss3, interacts with FAM134B and participates in the formation of heteromeric multi-protein clusters required for ER-phagy. Moreover, ubiquitination of ARL6IP1 promotes this process. Accordingly, disruption of Arl6ip1 in mice causes an expansion of ER sheets in sensory neurons that degenerate over time. Primary cells obtained from Arl6ip1-deficient mice or from patients display incomplete budding of ER membranes and severe impairment of ER-phagy flux. Therefore, we propose that the clustering of ubiquitinated ER-shaping proteins facilitates the dynamic remodelling of the ER during ER-phagy and is important for neuronal maintenance.


Conflict of interest statement

The authors declare no competing interests.

Figures

Fig. 1
Fig. 1. Neurodegeneration with ER sheet expansion in Arl6ip1 KO mice.
a, Schematic of disease-associated ARL6IP1 variants. b, No ARL6IP1 transcripts were detected in fibroblasts obtained from a patient carrying a homozygous mutation of ARL6IP1K193Ffs (qPCR with three replicates, two-sided unpaired Student’s t-test, P = 0.0001). c, No variant protein was detected in cells from the patient (two experiments). d, Arl6ip1 KO strategy. Frt sites, white triangles; loxP sites, black triangles. Predicted 14 amino acid product for the KO allele. e, No Arl6ip1 transcripts were detected in KO MEFs (qPCR with three replicates, two-sided unpaired Student’s t-test, P = 0.0007). f, Absence of ARL6IP1 in KO tissue lysates (two experiments). g, Decreasing foot base angle in KO mice (n = 6 WT mice and n = 5 KO mice; two-sided unpaired Student’s t-test, 2 month-old WT versus KO, P = 0.0007; 8-month-old WT versus KO, P = 0.0016; KO 2 months versus 8 months, P = 0.038). h, Diminished forelimb grip strength in 2-month-old (P = 0.0004) and 8-month-old (P = 0.0001) KO mice (n = 6 WT and KO mice each; two-sided unpaired Student’s t-test). i, Decreased compound muscle action potentials (CMAPs) in KO mice (n = 6 WT mice and n = 7 KO mice; repeated-measures analysis of variance (ANOVA), F = 18.6, P = 0.0015). j, TEM of intact WT and degenerating KO intramuscular nerve fibre (indicated by the asterisk). k, TEM of intact WT and degenerating KO motor end plate. l, Decreased sensory amplitudes in KO mice (n = 6 WT mice and n = 7 KO mice; repeated-measures ANOVA, F = 6.08, P = 0.0314). m, TEM of transversely cut intact WT and degenerating KO sciatic nerve axon. n, TEM of longitudinally cut sciatic nerve axons with ladder-like transverse ER sheet expansions (arrowheads) in KO but not WT mice. For in, analyses were performed using 6-month-old mice. o, TEM images (left) and quantification (right) show ER sheet expansions in lumbar spinal ganglion neurons in 12-month-old KO mice. ER sheet areas are coloured and higher magnifications are indicated. n = 100 cells from n = 3 WT mice and n = 177 cells from n = 3 KO mice; two-sided unpaired Student’s t-test, P = 0.0006. Data shown as the mean ± s.e.m. Scale bars, 1 µm (j,m,n), 2 µm (k) or 2.5 µm (o). Source Data
Fig. 2
Fig. 2. FAM134B interacts with ARL6IP1.
a, Left, cytosolic location of the ARL6IP1 C terminus. Middle, COS-7 cells transiently expressing RFP-tagged or GFP-tagged ER proteins subjected to fluorescence protease protection assays by sequential administration of digitonin to permeabilize plasma but not intracellular membranes and then trypsin. Right, C-terminal fluorescent tags of ARL6IP1, FAM134B or CD3 are destroyed by trypsin, whereas luminal RFP–KDEL is protected (three experiments with n = 29 (CD3–RFP), 16 (RFP–KDEL), 15 (FAM134B–GFP) and 22 (ARL6IP1–GFP) cells). b, Three-dimensional model of ARL6IP1 built using AlphaFold2 showing the relative organization of key structural elements (grey and yellow) and their relative orientation in a model bilayer (orange beads). c, Recombinant Trx–His–ARL6IP1 and untagged ARL6IP1 float with lipid membranes in sucrose density gradients to the liposome fraction 2 (immunoblot analysis, n = 2). d, Left, TEM images of freeze-fractured incubations of liposomes with Trx–His or recombinant Trx–His–ARL6IP1. Right, mean liposome diameters are decreased with Trx–His–ARL6IP1 (1 experiment with n = 1,817 (Trx–His; average 380 nm) and 1,824 (Trx–His–ARL6IP1; average 150 nm) vesicles analysed; two-sided Mann–Whitney U-test, P = 0.0001). e, HEK293T cells were transfected with the indicated constructs and immunoblotted (IB). Pull-down with anti-Myc coupled beads shows that LC3-II co-precipitates with FAM134B–Myc but not ARL6IP1–Myc (n = 1). f, The FAM134B interactome in U2OS cells includes ARL6IP1 (single-sided volcano plot). Notable hits with a log2(enrichment factor) > 1 and –log10(P value) > 1.3 are highlighted (one-sided paired Student’s t-test with three biological replicates). g, Co-precipitation of endogenous ARL6IP1 and FAM134B from MEFs and from HEK293T cells (n = 1). IP, immunoprecipitation. h, Overexpressed ARL6IP1–Myc and FAM134B–HA co-localize in MEFs. i, Proximity ligation assays suggest a proximity of less than 40 nm between endogenous ARL6IP1 and FAM134B. Specificity was confirmed by the absence of signals in the respective KO MEFs. Quantitative data are shown as the mean ± s.e.m. Scale bars, 200 nm (d) or 5 µm (h,i). Source Data
Fig. 3
Fig. 3. ARL6IP1 supports the formation of a multi-receptor complex with FAM134B and other ER-shaping proteins.
a, ARl6IP1 N-terminally tagged with the non-fluorescent N-terminal (V1) and ARl6IP1 N-terminally tagged with the C-terminal (V2) fragment of the Venus protein exhibit fluorescence after interaction. b, Single-sided Volcano plot of the label-free interactome of ARL6IP1 homodimers revealed that FAM134B, FAM134C and other RHD-containing ER proteins (blue) and proteins of the ubiquitination machinery (green) are binding partners. Only notable hits with log2(P value) > 1 and –log10(P value) > 1.3 are labelled in colour (one-sided paired Student’s t-test with three biological replicates). c, FAM134B N-terminally tagged with the non-fluorescent N-terminal (V1) and ARL6IP1 N-terminally tagged with the C-terminal (V2) fragment of the Venus protein exhibit fluorescence after interaction. d, Single-sided volcano plot of the label-free interactome for V1-FAM134B–V2-ARL6IP1 heterodimers include autophagy-related proteins LC3B and GABARAPL2 (red) and FAM134B as known binding partners. Notable hits with log2(P value) > 1 and –log10(P value) > 1.3 are labelled in colour (one-sided paired Student’s t-test with three biological replicates). Red dots indicate autophagy-related proteins. e, Heatmap of log2 enrichment of V1-ARL6IP1–V2-ARL6IP1, V1-FAM134B–V2-ARL6IP1 or V1-FAM134B–V2-FAM134B over mock from notable hits indicated in b and d.
Fig. 4
Fig. 4. LC3B binding to FAM134B–ARL6IP1 complexes depends on ARL6IP1 ubiquitination.
a,b, Position and log2(fold changes) of ubiquitinated lysine residues identified by LC–MS in ARL6IP1 (cells expressing V1-ARL6IP1–V2-ARL6IP1 or V1-FAM134B–V2-ARL6IP1) (a) and FAM134B (cells expressing V1-FAM134B–V2-FAM134B or V1-FAM134B–V2-ARL6IP1) (b). Significant sites are indicated in red (–log10(P value) > 1.3, one-sided unpaired Student’s t-test). c, Anti-Myc IP from HEK293T cells co-expressing HA–ARL6IP1, GFP–FAM134B and Myc–ubiquitin (Ub) confirms ARL6IP1 and FAM134B ubiquitination (one experiment). d, Snapshots from coarse-grained molecular dynamics simulations showing the most populated conformations of non-ubiquitinated and ubiquitinated ARL6IP1 (ubiquitin purple) in 1-palmitoyl-2-oleoyl-glycero-3-phosphocholine (POPC 16:0/18:1) bilayers (orange). e, Interaction with FAM134B but not endogenous REEP5 is promoted by ARL6IP1 ubiquitination (two experiments). f, LC3B co-precipitation with V1-FAM134B–V2-ARL6IP1-7KR is reduced compared with V1-FAM134B–V2-ARL6IP1 (three experiments; one-way ANOVA, F = 46; Holm–Sidak’s post-test, FAM134B–FAM134B versus FAM134B–ARL6IP1, P = 0.0014; FAM134B–FAM134B versus FAM134B–ARL6IP1-7KR, P = 0.0002; FAM134B–ARL6IP1 versus FAM134B–ARL6IP1-7KR, P = 0.0242). g, Pearson’s correlation analysis for ubiquitin-positive and LC3B-positive Venus puncta for V1-FAM134B–V2-ARL6IP1 and V1-FAM134B–V2-ARL6IP1-7KR in ARL6IP1 KO U2OS cells (1 experiment with n = 11 (ubiquitin) and 15 (LC3B) cells; two-sided unpaired Student’s t-test, P = 0.006 (ubiquitin) and P = 0.0001 (LC3B)). h, Left, ubiquitinated ARL6IP1 is detected after TUBE2 pull-down after co-expression of GFP–FAM134B and HA–ARL6IP1 with AMFR–Flag but not AMFR-RINGmut–Flag. Right, ARL6IP1–FAM134B interaction is promoted by AMFR but not AMFR-RINGmut–Flag (n = 1). i, Myc pull-down after co-expression of Myc–ubiquitin–HA–ARL6IP1 with AMFR–Flag or AMFR-RINGmut–Flag confirms ARL6IP1 ubiquitination with active AMFR (n = 1). j, Schematic (left) and quantification (right) of LC–MS of GFP pull-downs of co-expressed V1-ARL6IP1 and AMFR-V2 or AMFR-RINGmut-V2: AMFR ubiquitinates ARL6IP1 at K96 and K114 (one-sided unpaired Student’s t-test: V1-ARL6IP1–V2-ARL6IP1 versus V1-ARL6IP1–AMFR-V2 K96, P = 0.0075; K114, P = 0.006; V1-ARL6IP1–AMFR-V2 versus V1-ARL6IP1–AMFR-RINGmut-V2 K96, P = 0.038; K114, P = 0.044). k, In vitro ubiquitination of Trx–His–ARL6IP1 with AMFR decreases the mean liposome diameter in TEM of freeze-fractured liposomes by about 20%. Incubations without ATP served as control (2 experiments with n = 393, 346 and 223 vesicles analysed (left to right); two-sided Kruskal–Wallis test with Dunn’s post-hoc test: Trx–His–ARL6IP1 and ATP–Trx–His–ARL6IP1 + ATP, P = 0.0024; Trx–His–ARL6IP1 – ATP and control, P < 0.0001; Trx–His–ARL6IP1 + ATP and control, P < 0.0001). Quantitative data shown as the mean ± s.e.m. Source Data
Fig. 5
Fig. 5. FAM134B-mediated ER-phagy requires ARL6IP1 in mice and humans.
a, Rational of the mCherry–GFP–FAM134B reporter. b,c, ARL6IP1 loss-of-function compromises ER-phagy. Arl6ip1 WT and KO MEFs (b) or fibroblasts from the patient and the healthy individual (control) (c) were transfected with mCherry–GFP–FAM134B and stained for LC3B. Quantifications of LC3B+mCherry+GFP+ puncta and LC3B+mCherry+GFP puncta per cell area suggest that the formation of autophagosomes (3 experiments with 10 cells per genotype each; two-sided Mann–Whitney U-test; MEFs, P = 0.0479; human cells, P = 0.0005) and autolysosomes (3 experiments with 10 cells per genotype each; two-sided Mann–Whitney U-test; MEFs, P = 0.0307; human cells, P = 0.0096) is impaired. d,e, ARL6IP1 loss-of-function enlarges ER sheets. Arl6ip1 WT and KO MEFs (d) or fibroblasts from the patient and healthy individual (e) were stained for the ER sheet protein CLIMP63 and the relative CLIMP63+ area per cell calculated (3 experiments with 15 cells per genotype; two-sided Mann–Whitney U-test; MEFs, P = 0.0001; human cells, P = 0.0001). f,g, TEM images showed increased numbers of small highly curved ER protrusions emanating from ER sheets in the absence of ARL6IP1 (ER sheets in light purple, ER-emerging spikes in pink) in MEFs (f) and human fibroblasts (g) (1 experiment with 55 cells per genotype; two-sided Mann–Whitney U-test; P = 0.0059 (f) and P = 0.0001 (g)). h,i, ARL6IP1 loss-of-function decreases cell viability in the presence of the ER stressors tunicamycin (Tunicam.) or thapsigargin (Thapsig.) with or without the proteasome inhibitor MG132 in MEFs (h) and human fibroblasts (i) (3 experiments with 2 replicates; two-sided Mann–Whitney U-test; MEFs, thapsigargin + MG132, P = 0.0022; tunicamycin, P = 0.041; tunicamycin + MG132, P = 0.0022; patient cells, thapsigargin, P = 0.0022; thapsigargin + MG132, P = 0.0087; tunicamycin, P = 0.0022; tunicamycin + MG132, P = 0.026). j, Cartoon showing ARL6IP1 (blue) ubiquitinated (red balls) by AMFR in a complex with FAM134B (red), which binds to LC3 (purple) during ER-phagy. Quantitative data are shown as the mean ± s.e.m. Individual experiments are indicated by differently coloured data points. Scale bars, 500 nm (f,g), 10 µm (d,e) or 20 µm (b,c). The models in a and j were created using BioRender (https://www.biorender.com). Source Data
Extended Data Fig. 1
Extended Data Fig. 1. Phenotype of Arl6ip1 KO mice.
a) The body weight of KO mice is reduced (2 months: 15 WT and 15 KO mice; 22 months: 9 WT and 11 KO mice; 2-sided unpaired Student’s t-test: p = 0.0034). b) Cortical neurons are decreased in aged KO mice. Cross sections of the motor cortex of 22-month-old WT and KO mice with NeuN-labelled neurons (1 exp.; 3 mice per genotype; 2-sided unpaired Student’s t-test: p = 0.0312). Scale bars: 50 µm. c) Progressive Purkinje cell loss in KO mice. Representative images of the Purkinje cell layer of HE-stained sagittal cerebellum sections of 22-month-old WT and KO mice (1 exp.; n = 3 mice with 3 sections each per genotype; 2-sided unpaired Student’s t-test: WT 2 versus WT 22 months, p = 0.0002; KO 2 versus KO 22 months p = 0.0001, KO versus WT 22 months p = 0.0001). Scale bars: 100 µm. d) Swollen corticospinal axon in the lumbar spinal cord of a 6-month-old KO mouse (1 exp.). TEM of a horizontal spinal cord section. Scale bar: 5 µm. The higher magnification shows the accumulation of granular electron-dense material, defective organelles and tubulofilamentous material. The axon is surrounded by a distended myelin sheath (arrowheads). Scale bar: 1 µm. e) Progressive α-motoneuron loss in the thoracic spinal cord of KO mice. Nissl-stained horizontal sections (1 exp.; 3 mice per genotype; 2-sided unpaired Student’s t-test: WT 22 versus KO 22 months p = 0.0322, KO 2 versus KO 22 months p = 0.0018, WT 2 versus WT 22 months p = 0.0154). f) The Musculus gastrocnemius mass is reduced in 2-month-old KO mice (1 exp.; 3 WT and 3 KO mice with 2 samples each (left and right); 2-sided unpaired Student’s t-test: p = 0.001). g) Grouped atrophic skeletal muscle fibres in 20-week-old KO mice. Toluidine-blue stained semi-thin sections (1 exp.). Scale bar: 100 µm. h) Fragmentation and innervation loss of neuromuscular junctions (NMJ) in the Musculus gastrocnemius of 2-month-old KO mice stained with α-bungarotoxin (red), neurofilament 200 (green) and Hoechst 33258 (1 exp.; 3 mice per genotype). 2-sided unpaired Student’s t-test for fragmentation (p = 0.0012). i) The abundance of some ER proteins with RHDs is changed in brain lysates of 5-month-old KO mice (1 exp. with 5 samples per genotype; 2-sided Mann-Whitney-U-test: Rtn2a+b p = 0.0317, Rtn4a p = 0.0317, Fam134b p = 0.0079, Reep2 p = 0.0159). Quantitative data are shown as mean ± SEM. Source Data
Extended Data Fig. 2
Extended Data Fig. 2. ARL6IP1 and FAM134B share structural features and interact.
a) Predicted alignment error of the relative organization of key structural elements of ARL6IP1 shown in Fig. 2b. b) Helical wheel representation of two cytosolic helical segments with characteristics of amphipathic helices with a large hydrophobic moment and net positive charge (blue circle) . c) Pairwise sequence alignment of ARL6IP1 and FAM134B indicates preserved RHDs, i.e. two helical hairpins TM1+2 and TM3+4 (grey), and two amphipathic helices, AHL and AHC (yellow). Both proteins harbour several predicted ubiquitination sites (red triangles). d) Doxycycline induced HA-ARL6IP1 interacts with endogenous FAM134B in U2OS cells (1 exp.). e) ARL6IP1 co-precipitates with all known members of the FAM134 family of proteins (1 exp.). The interaction with FAM134B requires the N-terminal part of FAM134B with its first RHD and is independent of its C-terminal coiled-coil domain. Cells were transfected with Myc-ARL6IP1 and the indicated GFP-tagged FAM134B deletion constructs. ATL3, another ER-protein characterised by a RHD, served as a negative control. f) The central part of ARL6IP1 with both helical hairpins is involved in the interaction with FAM134B (1 exp.). HEK293T cells were transfected with the indicated HA-tagged ARL6IP1 deletion constructs. WT and variant proteins were pulled down and the endogenous binding partner FAM134B was detected. The deletion sites are indicated as black bars. The replaced lysines for the ARL6IP1-7KR variant are indicated by red bars. Variants marked with * lack the terminal KKNE signal (white bar). g) The central part of FAM134B with both helical hairpins is required for the interaction with ARL6IP1 (1exp.). HEK293T cells were transfected with the indicated HA-tagged FAM134B deletion constructs. The deletion sites are indicated as black lines. WT and variant proteins were pulled down and the endogenous binding partner ARL6IP1 detected.
Extended Data Fig. 3
Extended Data Fig. 3. ARL6IP1 forms heterodimers with FAM134B but does not bind LC3B on its own.
a) V1-ARL6IP1/V2-ARL6IP1 homodimers and V1-FAM134B/V2-ARL6IP1 heterodimers are formed in transiently expressing U2OS cells as evidenced by the Venus fluorescence. Co-transfection of V2-ARL6IP1 with V1-CCPG1, another ER resident protein, which does not interact with ARL6IP1, or a construct encoding an ARL6IP1 variant devoid of the first helical hairpin (V2-ARL6IP1Δ(TM1+2)), which is required for the interaction between FAM134B and ARL6IP1, does not result in heteromerisation as evidenced by the lack of the Venus fluorescence. The single channel images represent immunostaining for either FAM134B, ARL6IP1, and CCPG1 or the Venus signal. 1 experiment. Scale bars: 10 µm. b) Venn diagram of interactors of ARL6IP1 and FAM134B homo- and heterodimers, respectively. Numbers represent the identified peptides significantly enriched in three IP and mass spectrometry replicates for each condition. c,d) Annotation enrichment analysis of the interactome of V1-ARL6IP1/V2-ARL6IP1 homodimers and V1-FAM134B/V2-ARL6IP1 heterodimers. Bars represent the significantly enriched gene ontology biological process (GOBP), the gene ontology cellular components (GOCC), the gene ontology molecular function (GOMF), and the domain enrichment (Pfam). The Benjamini-Hochberg FDR value is included (right side of the bars). e) Western blot analysis showing that RTN4, another ER-shaping protein characterised by the presence of a RHD, and FAM134B co-precipitate with HA-tagged ARL6IP1 (1 exp.).
Extended Data Fig. 4
Extended Data Fig. 4. Mass spectrometry analysis of ubiquitinated lysines in ARL6IP1 and FAM134B proteins.
a,b) Localization of the identified lysines in ARL6IP1 and FAM134B versus Log2 enrichment over mock. Significantly modified lysines (−Log10 >1.3) are highlighted in red. c–e) Spectra of modified lysines of ARL6IP1 peptides (K96, K114 and K130) found in ARL6IP1 homo- or heterodimers with FAM134B. f–l) Spectra of modified lysines of FAM134B peptides, K90, K160, K374, K278 and K485 found in FAM134B in the heterodimer complex with ARL6IP1.
Extended Data Fig. 5
Extended Data Fig. 5. ER-fragmentation (ER-phagy) is promoted by ubiquitination of ARL6IP1.
a) Co-localisation of either ARL6IP1-HA or ARL6IP1-7KR-HA with Climp63 in Alr6ip1 KO MEFs (1 exp.; 10 cells per genotype; 2-sided Mann-Whitney-U-test: Pearson’s coefficient ARL6IP1-HA versus ARL6IP1-7KR-HA p = 0.012, Climp63 area control versus ARL6IP1-HA p = 0.036, Climp63 area ARL6IP1-HA versus ARL6IP1-7KR-HA p = 0.036). Scale bars: 10 µm. b) Co-localisation of either ARL6IP1-HA or ARL6IP1-7KR with FAM134B-Myc in Alr6ip1 KO MEFs does not differ (1 exp.; 10 cells per genotype; 2-sided Mann-Whitney-U-test). Scale bars: 10 µm. c) Quantitative evaluations of TEM images of freeze-fractured liposomes demonstrate that the shaping properties of His-Trx-ARL6IP1-7KR do not differ from His-Trx-ARL6IP1 (2 exp.; n = 344/391/242; Kruskal-Wallis test with Dunn’s post-hoc test: His-Trx-ARL6IP1 versus His-Trx p < 0.0001, His-Trx-ARL6IP1-7KR versus His-Trx p < 0.0001; n = 344/391/242). d) The binding of LC3B to V1-ARL6IP1-7KR/V2-FAM134B heterodimers is reduced compared to V1-ARL6IP1/V2-FAM134B heterodimers (3 exp.). Illustration for quantification shown in Fig. 4f. e) The co-localization of ER-fragments with LC3B (red) and Ubiquitin (Ub, white) was analysed in ARL6IP1 KO U2OS cells transiently expressing either V1-FAM134B/V2-ARL6IP1 or V1-FAM134B/V2-ARL6IP1-7KR heterodimers after treatment with Torin1 for 6 h. Scale bars: 10 µm. Illustration for quantification shown in Fig. 4g. f) Endogenous ARL6IP1 is ubiquitinated upon induction of ER stress (1 exp.). U2OS cells were harvested at steady state (basal) or after incubation with the indicated stressors for 6 h (Bafilomycin A1 200 nM, Torin1 250 nM, Thapsigargin 1.5 µM, Tunicamycin 5 µg/ml, Chloroquine 100 µM; stressors and steady state with DMSO 1:1,000). ARL6IP1 is detected in the TUBE2-pull-down. g) Upper: The in vitro ubiquitination assay with subsequent mass spectrometry shows that AMFR can ubiquitinate ARL6IP1 K96 (1 exp. with 3 replicates; 2-sided unpaired Student’s t-test p = 0.0001). Lower: Confirmation of ubiquitination of ARL6IP1 by immunoblot analysis (1 exp.). Quantitative data are shown as mean ± SEM. Source Data
Extended Data Fig. 6
Extended Data Fig. 6. FAM134B-driven ER-phagy is compromised in the absence of ARL6IP1.
a) Single channels of the merged images displayed in Fig. 5b and c. Scale bar: 20 μm. b) Western blot analysis of siRNA mediated knock-down of ARL6IP1 in HeLa and U2OS cells (1 exp. with 2 replicates). c) The ratio between mCherry-positive and mCherry and GFP-positive puncta is decreased in EBSS starved cells upon knock-down of ARL6IP1 and induction of the reporter with doxycycline (1 exp. with triplicates; one-way ANOVA with Bonferroni post-hoc analysis, p = 0.0001, F = 12.19: siRNA control basal versus EBSS p = 0.0006; BafA1 versus EBSS p = 0.0001, EBSS versus EBSS BafA1 p = 0.0001; siRNA control EBSS versus siRNA ARL6IP1 EBSS p = 0.0013). Scale bar: 10 μm. Quantitative data are shown as mean ± SEM. Source Data
Extended Data Fig. 7
Extended Data Fig. 7. ER-phagy but not bulk autophagy, mitophagy or pexophagy is compromised upon disruption of ARL6IP1.
a) siRNA mediated knock-down of either ARL6IP1, FAM134B or both in HeLa cells (3 exp.). b) The ratio of Climp63-positive versus Climp63-negative lysosomes upon knock-down of either ARL6IP1 or FAM134B is consistent with a defect in ER-phagy. Cells were treated with Torin1 and Bafilomycin A1. The simultaneous knock-down of both further decreases this ratio (1 exp.; 15 cells per genotype, one-way-ANOVA, F-value = 32.59, p = 0.0001, Bonferroni post-hoc analysis: siCTRL versus siARL6IP1 p = 0.0001, siCTRL versus siFAM134B p = 0.0017, siRNA CTRL versus siARL6IP1+siFAM134B p = 0.0001; siARL6IP1 versus siARL6IP1+siFAM134B p = 0.0001, siFAM134B versus siARL6IP1+siFAM134B p = 0.0001). Scale bar: 5 µm. c) Arl6ip1 and Fam134b WT and KO MEFs were EBSS starved for 4 h, fixed and stained for Lamp1, LC3B, and the ER-protein Sec62. The quantification of autophagosomes (LC3B-positive and Lamp1-negative) loaded with ER (Sec62-positive) or devoid of ER (Sec62-negative) supports a defect in ER-phagy but not bulk autophagy (1 exp.; 10 cells per genotype were analysed; one-way-ANOVA with Bonferroni post-hoc analysis; autophagosomes: p = 0.001, F-value = 9.081, WT versus Arl6ip1 KO p = 0.003, WT versus Fam134b KO p = 0.003; autolysosomes: p = 0.004, F-value = 6.954, WT versus Arl6ip1 KO p = 0.024, WT versus Fam134b KO p = 0.005). Scale bar: 20 µm. d) Knock-down of ARL6IP1 in U2OS cells with inducible expression of the mCherry-GFP-LC3 reporter (1 exp.). e) Bulk autophagy upon siRNA mediated knock-down of ARL6IP1 is not compromised in U2OS cells expressing the mCherry-GFP-LC3 reporter (1 exp. with 3 replicates, one-way-ANOVA with Bonferroni post-hoc analysis). f) Mitophagy is not affected by KO of ARL6IP1. WT and ARL6IP1 KO HeLa cells were transfected with the mitophagy reporter mCherry-GFP-FIS1. Mitophagy flux was studied at steady state (basal) and after 4 h with 40 µM CCCP (1 exp; n = 11 cells each were analysed; one-way ANOVA with Bonferroni post-hoc analysis, F-value = 13.36, p = 0.0001: WT basal versus CCCP p = 0.0067, KO basal versus CCCP p = 0.0001). Scale bar: 25 µm. g) Pexophagy is not affected by ARL6IP1 knock-down. The mCherry-GFP-PMP34 reporter was induced in control and ARL6IP1 knock-down U2OS cells and pexophagy flux studied at steady state (basal) and 20 h of EBSS starvation (1 exp. with n = 9/6/9/8 cells analysed; one-way ANOVA with Bonferroni post-hoc analysis, F-value = 10.65, p = 0.0001: WT basal versus CCCP p = 0.0377, KO basal versus CCCP p = 0.0004). Scale bar: 25 µm. Quantitative data are shown as mean ± SEM. Source Data
Extended Data Fig. 8
Extended Data Fig. 8. Rescue experiment with either ARL6IP1 or the ARL6IP1-7KR variant.
a) In Arl6ip1 KO MEFs ER-phagy can be rescued by overexpression of either ARL6IP1 or ARL6IP1-7KR-HA. KO MEFs were transfected with the mCherry-GFP-FAM134B reporter and either ARL6IP1-HA or ARL6IP1-7KR-HA, fixed and stained for LC3B. Quantifications of LC3B/mCherry/GFP-positive puncta (autophagosomes) and LC3B/mCherry-positive but GFP-negative puncta (autolysosomes) per cell area (1 exp. with 15 cells analysed per genotype; Kruskal-Wallis test with Dunn`s multiple comparison test: autophagosomes WT versus KO p = 0.0002, KO versus ARL6IP1 rescue p = 0.0001, KO versus ARL6IP1-7KR rescue p = 0.0138; autolysosomes WT versus KO p = 0.001, KO versus ARL6IP1 rescue p = 0.0001, KO versus ARL6IP1-7KR rescue p = 0.0053). Scale bars: 20 µm. Quantitative data are shown as mean ± SEM. Source Data
Extended Data Fig. 9
Extended Data Fig. 9. Intracellular accumulation of collagen in the absence of ARL6IP1.
a) The ratio of cells strongly labelling for collagen is increased in both Fam134b and Arl6ip1 KO MEFs (1 exp. with n = 86 WT cells, n = 121 FAM134B KO MEF cells, n = 69 ARL6IP1 KO MEFs analysed; one-way ANOVA with Bonferroni post-hoc analysis, F-value = 171.7, p = 0.0001: WT versus Fam134b KO p = 0.0001, WT versus Arl6ip1 KO p = 0.0001). Scale bar: 50 µm. b) Comparable collagen levels in the supernatants of Fam134b and Arl6ip1 KO MEFs exclude a defect of collagen secretion (1 exp. with n = 2 samples). c) The ratio of cells strongly labelling for collagen is increased in fibroblasts of the patient homozygous for the K193Ffs variant (n = 3 experiments with 344 (control), 310 (K193Ffs het.), 399 (K193Ffs hom.) cells analysed; one-way ANOVA with Bonferroni post-hoc analysis, F = 40.02, p = 0.0001: WT versus K193Ffs hom. p = 0.0001, K193Ffs het. versus K193Ffs hom. p = 0.0001). d) Comparable collagen levels in the supernatants of fibroblasts of a healthy control, the heterozygous father and the affected patient exclude a defect of collagen secretion (1 exp. with n = 2 samples). e) Western blot analysis of WT, Fam134b KO and Arl6ip1 KO MEFs at steady state and EBSS starvation with or without Bafilomycin A1 (BafA). The accumulation of collagen is not enhanced upon Bafilomycin A1 treatment. This suggests that the removal of misfolded collagen by ER-phagy is abolished in Arl6ip1 KO MEFs. Vinculin served as loading control (1 exp.). f) Accumulation of collagen in patient fibroblasts. Actin served as loading control (3 experiments; one-way ANOVA with Bonferroni post-hoc analysis, F-value = 40.8, p = 0.0003: WT versus K193Ffs hom. p = 0.0011; K193Ffs het. versus K193Ffs hom. p = 0.0005). g) MEFs devoid of Fam134b or Arl6ip1 cannot deliver collagen to lysosomes. Quantification of collagen-positive lysosomes per cell in cells loaded with collagen (1 exp., 6 cells analysed with 564 (WT), 474 (Fam134b KO), 785 (Arl6ip1 KO) puncta counted; one-way ANOVA with Bonferroni post-hoc analysis, F-value 47.59, p = 0.0001: WT versus Fam134b KO p = 0.0001, WT versus Arl6ip1 KO p = 0.0001, Fam134b KO versus Arl6ip1 KO p = 0.0165). Scale bars: 20 µm. Quantitative data are shown as mean ± SEM. Source Data
Extended Data Fig. 10
Extended Data Fig. 10. Consequences of compromised FAM134B-dependent ER-phagy for ER structure and cell viability.
a) Staining for the ER sheet protein Climp63 and the ER tubule marker RTN4 in WT and Fam134b and Arl6ip1 KO MEFs. Relative Climp63-positive or RTN4-positive pixels per cell and their ratio was calculated (3 exp. with 45 cells analysed per genotype; Kruskal-Wallis test with Dunn’s multiple comparisons test: Climp63 WT versus Arl6ip1 KO p = 0.0001, WT versus Fam134b KO p = 0.0001; RTN4 WT versus Arl6ip1 KO p = 0.036, WT versus Fam134b KO p = 0.0005; data points obtained within the same experiment are indicated by the same colour). Scale bar: 10 µm. b) Compared with the strongly increased number of small highly curved ER protrusions emanating from ER sheets in fibroblasts of the homozygous patient, fibroblasts of the heterozygous father show an intermediate phenotype (1 exp. with 55 cells per genotype; one-way ANOVA with Bonferroni post-hoc analysis, F-value 42,59, p = 0.0001: WT versus K193Ffs het. p = 0.0002, WT versus K193Ffs hom. p = 0.0001, K193Ffs hom. versus K193Ffs het. p = 0.0001; data points obtained within the same experiment are indicated by the same colour). Scale bar: 500 nm. The ER is shown in light purple colour. ER-emerging spikes are shown in pink. c) In the presence of the ER stressor Tunicamycin without the proteasomal inhibitor MG132 the viability of the fibroblasts of the heterozygous father is slightly increased compared to control (3 experiments with 2 replicates each; 2-sided Mann-Whitney-U-test; Thapsigargin: WT versus K193Ffs hom. p = 0.0022, K193Ffs het. versus K193Ffs hom. p = 0.0022; Thapsigargin + MG132: WT versus K193Ffs hom. p = 0.0087; Tunicamycin: WT versus K193Ffs het. p = 0.0411, WT versus K193Ffs hom. p = 0.0022; K193Ffs het. versus K193Ffs hom. p = 0.0022; Tunicamycin+MG132: WT versus K193Ffs hom. p = 0.026). Individual experiments are indicated by differently coloured data points. Quantitative data are shown as mean ± SEM. Source Data

References

    1. Khaminets A, et al. Regulation of endoplasmic reticulum turnover by selective autophagy. Nature. 2015;522:354–358. - PubMed
    1. Kurth I, et al. Mutations in FAM134B, encoding a newly identified Golgi protein, cause severe sensory and autonomic neuropathy. Nat. Genet. 2009;41:1179–1181. - PubMed
    1. Novarino G, et al. Exome sequencing links corticospinal motor neuron disease to common neurodegenerative disorders. Science. 2014;343:506–511. - PMC - PubMed
    1. Mochida K, et al. Receptor-mediated selective autophagy degrades the endoplasmic reticulum and the nucleus. Nature. 2015;522:359–362. - PubMed
    1. Hübner CA, Kurth I. Membrane-shaping disorders: a common pathway in axon degeneration. Brain. 2014;137:3109–3121. - PubMed

Publication types

MeSH terms