

Ubiquitination regulates ER-phagy and remodelling of endoplasmic reticulum
- PMID: 37225996
- PMCID: PMC10247366
- DOI: 10.1038/s41586-023-06089-2
Ubiquitination regulates ER-phagy and remodelling of endoplasmic reticulum
Abstract
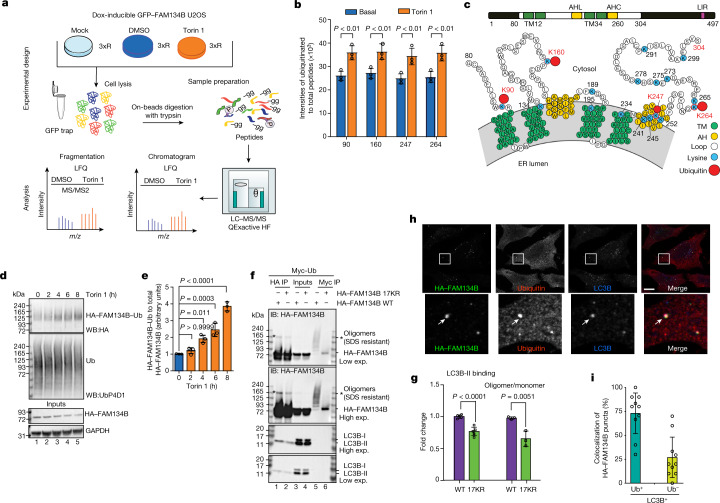
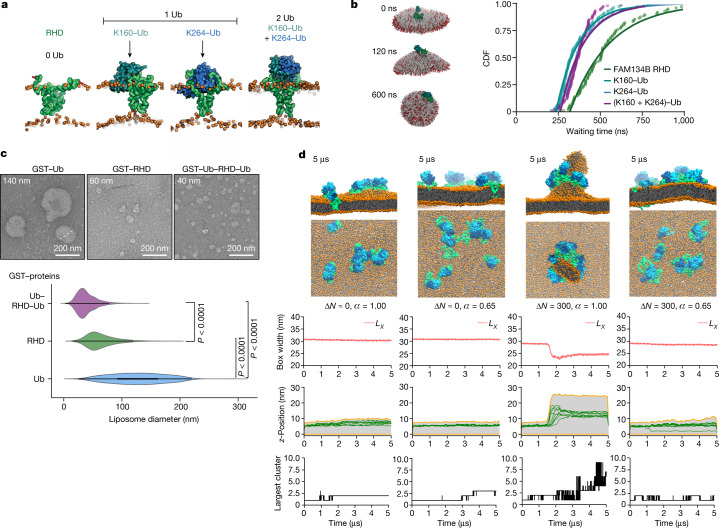
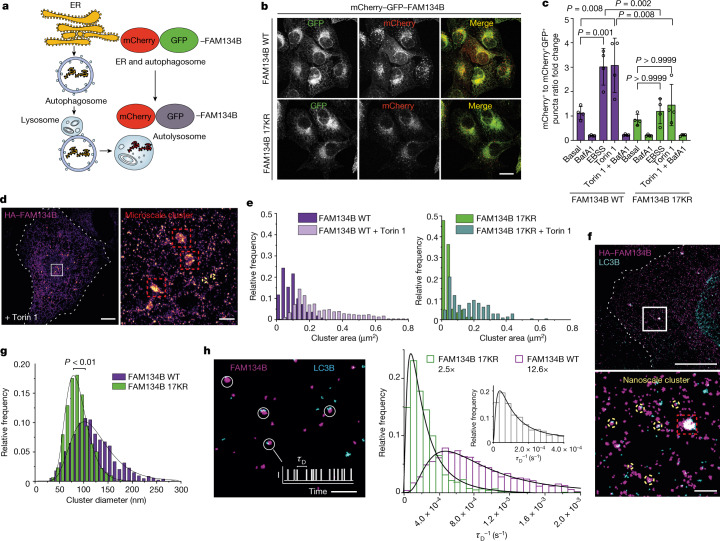
The endoplasmic reticulum (ER) undergoes continuous remodelling via a selective autophagy pathway, known as ER-phagy1. ER-phagy receptors have a central role in this process2, but the regulatory mechanism remains largely unknown. Here we report that ubiquitination of the ER-phagy receptor FAM134B within its reticulon homology domain (RHD) promotes receptor clustering and binding to lipidated LC3B, thereby stimulating ER-phagy. Molecular dynamics (MD) simulations showed how ubiquitination perturbs the RHD structure in model bilayers and enhances membrane curvature induction. Ubiquitin molecules on RHDs mediate interactions between neighbouring RHDs to form dense receptor clusters that facilitate the large-scale remodelling of lipid bilayers. Membrane remodelling was reconstituted in vitro with liposomes and ubiquitinated FAM134B. Using super-resolution microscopy, we discovered FAM134B nanoclusters and microclusters in cells. Quantitative image analysis revealed a ubiquitin-mediated increase in FAM134B oligomerization and cluster size. We found that the E3 ligase AMFR, within multimeric ER-phagy receptor clusters, catalyses FAM134B ubiquitination and regulates the dynamic flux of ER-phagy. Our results show that ubiquitination enhances RHD functions via receptor clustering, facilitates ER-phagy and controls ER remodelling in response to cellular demands.
© 2023. The Author(s).
Conflict of interest statement
The authors declare no competing interests.
Figures


References
-
- Khaminets A, et al. Regulation of endoplasmic reticulum turnover by selective autophagy. Nature. 2015;522:354–358. - PubMed
Publication types
MeSH terms
Substances
LinkOut - more resources
Full Text Sources
Molecular Biology Databases
