

Identification of immune cell infiltration and effective biomarkers of polycystic ovary syndrome by bioinformatics analysis
- PMID: 37226082
- PMCID: PMC10207797
- DOI: 10.1186/s12884-023-05693-4
Identification of immune cell infiltration and effective biomarkers of polycystic ovary syndrome by bioinformatics analysis
Abstract
Background: Patients with polycystic ovary syndrome (PCOS) exhibit a chronic inflammatory state, which is often accompanied by immune, endocrine, and metabolic disorders. Clarification of the pathogenesis of PCOS and exploration of specific biomarkers from the perspective of immunology by evaluating the local infiltration of immune cells in the follicular microenvironment may provide critical insights into disease pathogenesis.
Methods: In this study, we evaluated immune cell subsets and gene expression in patients with PCOS using data from the Gene Expression Omnibus database and single-sample gene set enrichment analysis.
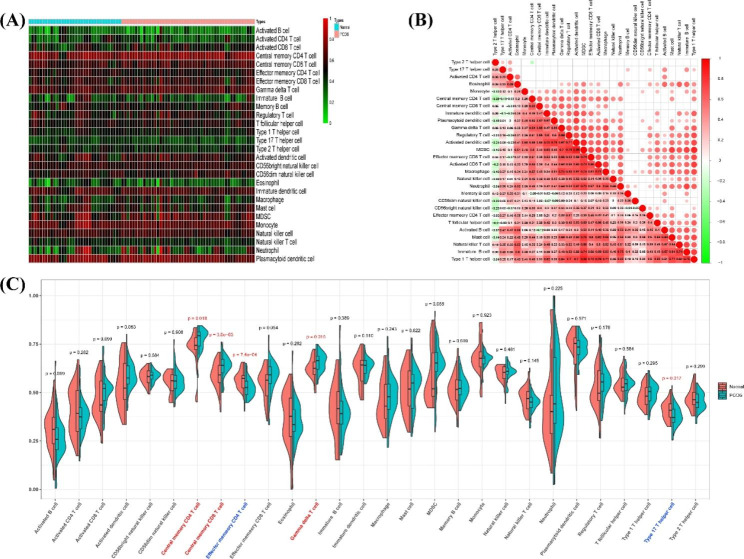
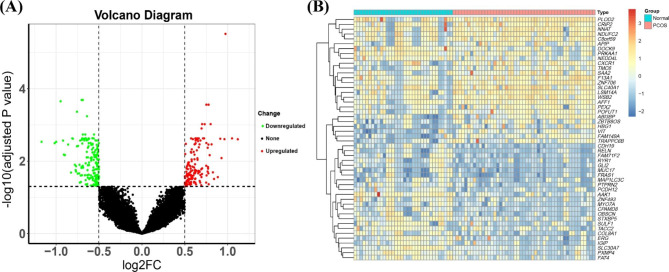
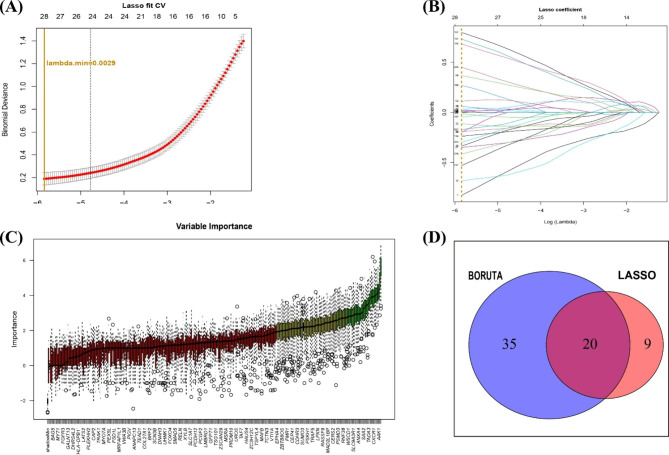
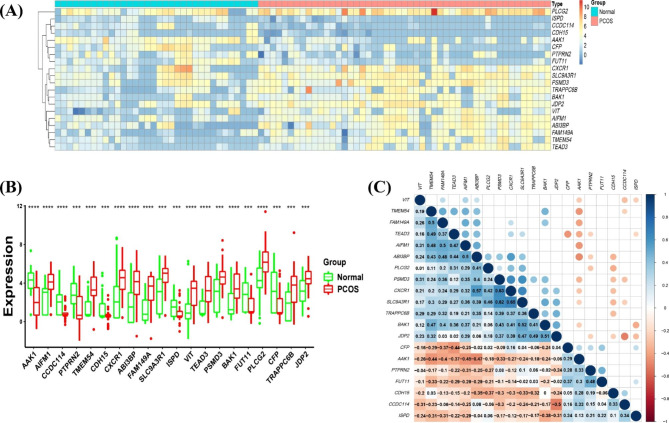
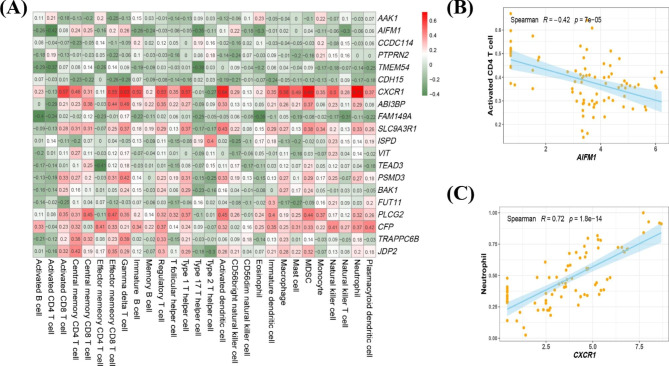
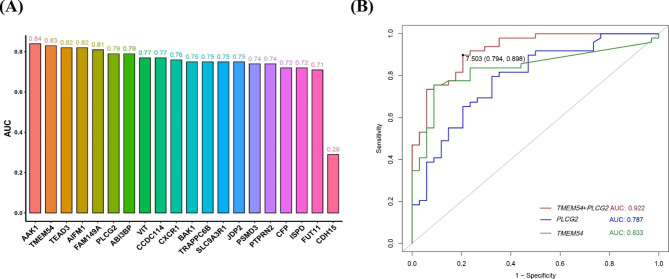
Results: In total, 325 differentially expressed genes were identified, among which TMEM54 and PLCG2 (area under the curve = 0.922) were identified as PCOS biomarkers. Immune cell infiltration analysis showed that central memory CD4+ T cells, central memory CD8+ T cells, effector memory CD4+ T cells, γδ T cells, and type 17 T helper cells may affect the occurrence of PCOS. In addition, PLCG2 was highly correlated with γδ T cells and central memory CD4+ T cells.
Conclusions: Overall, TMEM54 and PLCG2 were identified as potential PCOS biomarkers by bioinformatics analysis. These findings established a basis for further exploration of the immunological mechanisms of PCOS and the identification of therapeutic targets.
Keywords: Biomarker; Immune cell infiltration; Polycystic ovary syndrome; Single-sample gene set enrichment analysis.
© 2023. The Author(s).
Conflict of interest statement
The authors declare no competing interests.
Figures


Similar articles
-
Identification of novel candidate biomarkers and immune infiltration in polycystic ovary syndrome.J Ovarian Res. 2022 Jul 6;15(1):80. doi: 10.1186/s13048-022-01013-0. J Ovarian Res. 2022. PMID: 35794640 Free PMC article.
-
Identification of MAP1LC3A as a promising mitophagy-related gene in polycystic ovary syndrome.Sci Rep. 2024 Jul 23;14(1):16982. doi: 10.1038/s41598-024-67969-9. Sci Rep. 2024. PMID: 39043888 Free PMC article.
-
Identification of potential diagnostic genes for atherosclerosis in women with polycystic ovary syndrome.Sci Rep. 2024 Aug 6;14(1):18215. doi: 10.1038/s41598-024-69065-4. Sci Rep. 2024. PMID: 39107365 Free PMC article.
-
Proteomic biomarkers of preterm birth risk in women with polycystic ovary syndrome (PCOS): a systematic review and biomarker database integration.PLoS One. 2013;8(1):e53801. doi: 10.1371/journal.pone.0053801. Epub 2013 Jan 29. PLoS One. 2013. PMID: 23382852 Free PMC article.
-
Pathogenetic analysis of polycystic ovary syndrome from the perspective of omics.Biomed Pharmacother. 2021 Oct;142:112031. doi: 10.1016/j.biopha.2021.112031. Epub 2021 Aug 16. Biomed Pharmacother. 2021. PMID: 34411918 Review.
Cited by
-
Granulosa cell RNA-Seq insights into senescence and sphingolipid metabolism disorder in PCOS: aspirin as a potential therapeutic drug.Reprod Biol Endocrinol. 2025 Apr 26;23(1):61. doi: 10.1186/s12958-025-01396-x. Reprod Biol Endocrinol. 2025. PMID: 40287692 Free PMC article.
-
Mesenchymal stem cells and mesenchymal stem cell-derived exosomes: attractive therapeutic approaches for female reproductive dysfunction.Mol Biol Rep. 2024 Nov 22;52(1):10. doi: 10.1007/s11033-024-10106-6. Mol Biol Rep. 2024. PMID: 39576370 Review.
-
Decreased miR-128-3p in serum exosomes from polycystic ovary syndrome induces ferroptosis in granulosa cells via the p38/JNK/SLC7A11 axis through targeting CSF1.Cell Death Discov. 2025 Feb 18;11(1):64. doi: 10.1038/s41420-025-02331-0. Cell Death Discov. 2025. PMID: 39966422 Free PMC article.
-
Pro-cumulin addition in a biphasic in vitro oocyte maturation system modulates human oocyte and cumulus cell transcriptomes.Mol Hum Reprod. 2025 Jan 17;31(1):gaaf001. doi: 10.1093/molehr/gaaf001. Mol Hum Reprod. 2025. PMID: 39862403 Free PMC article.
References
-
- Qiao J, Li R, Li L. Polycystic ovary syndrome -- an epidemiological study of polycystic ovary syndrome. Chin J Practical Gynecol Obstet. 2013;29(11):849–52.
MeSH terms
Substances
LinkOut - more resources
Full Text Sources
Medical
Research Materials
