. 2023 May 24;24(1):215.
doi: 10.1186/s12859-023-05343-8.

Drug mechanism enrichment analysis improves prioritization of therapeutics for repurposing

Affiliations

Drug mechanism enrichment analysis improves prioritization of therapeutics for repurposing

Belinda B Garana et al. BMC Bioinformatics. .

Abstract

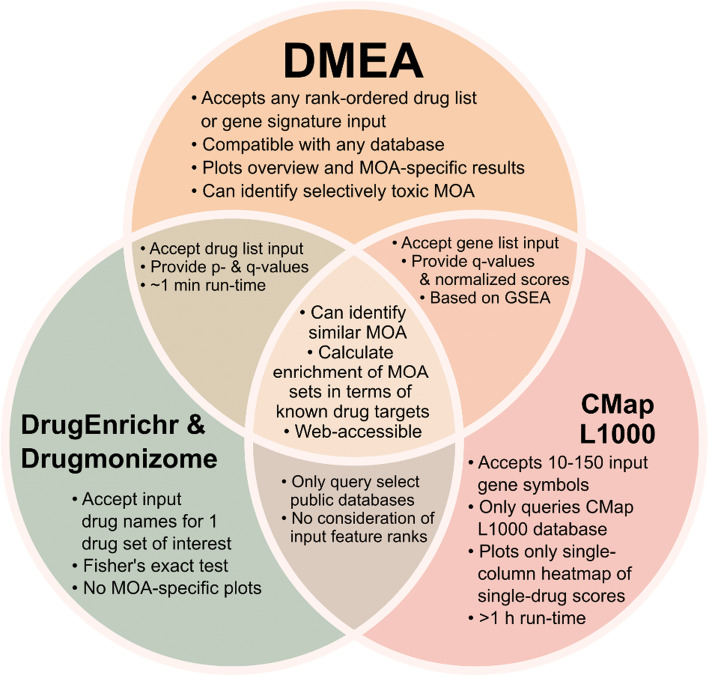
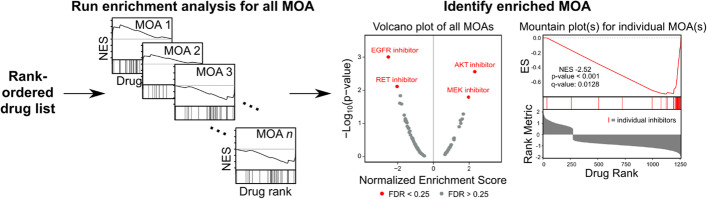
Background: There is a pressing need for improved methods to identify effective therapeutics for diseases. Many computational approaches have been developed to repurpose existing drugs to meet this need. However, these tools often output long lists of candidate drugs that are difficult to interpret, and individual drug candidates may suffer from unknown off-target effects. We reasoned that an approach which aggregates information from multiple drugs that share a common mechanism of action (MOA) would increase on-target signal compared to evaluating drugs on an individual basis. In this study, we present drug mechanism enrichment analysis (DMEA), an adaptation of gene set enrichment analysis (GSEA), which groups drugs with shared MOAs to improve the prioritization of drug repurposing candidates.

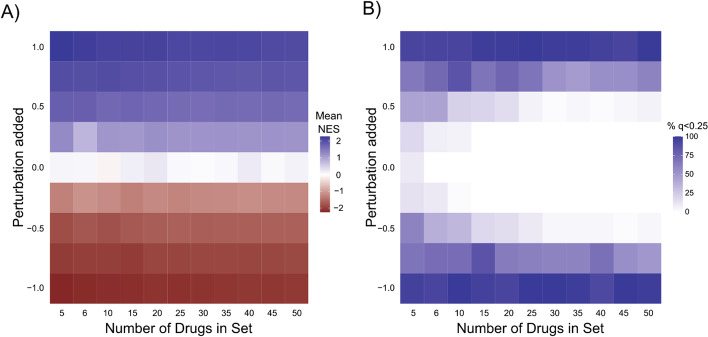
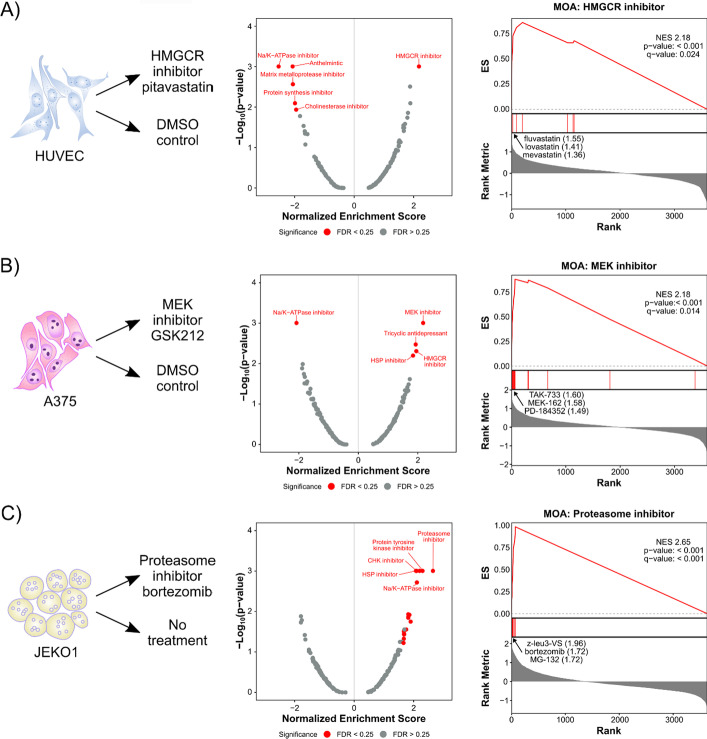
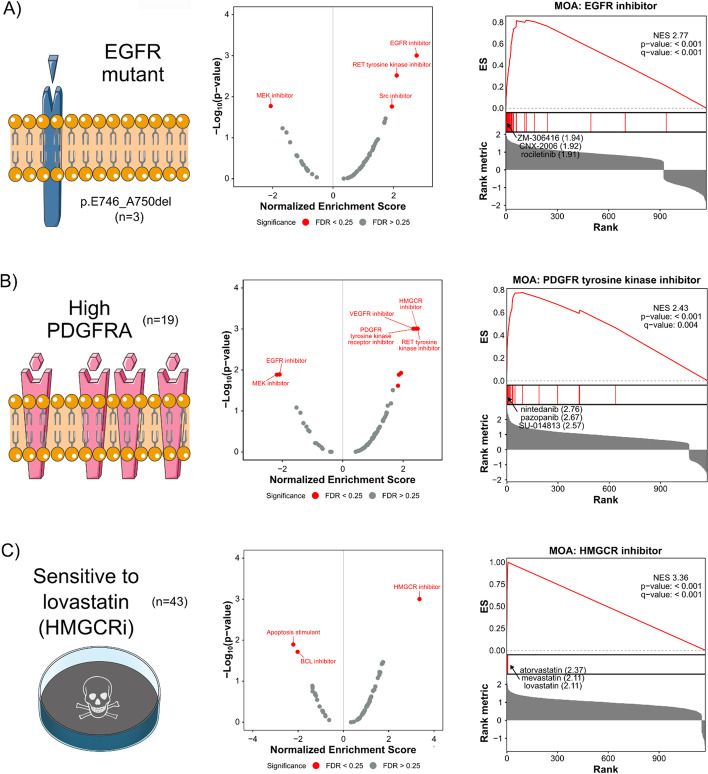
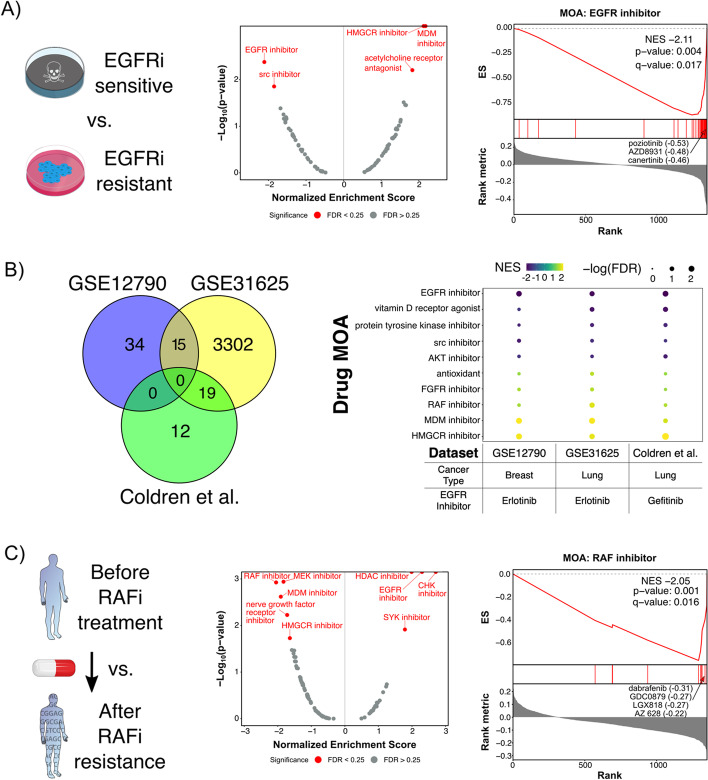
Results: First, we tested DMEA on simulated data and showed that it can sensitively and robustly identify an enriched drug MOA. Next, we used DMEA on three types of rank-ordered drug lists: (1) perturbagen signatures based on gene expression data, (2) drug sensitivity scores based on high-throughput cancer cell line screening, and (3) molecular classification scores of intrinsic and acquired drug resistance. In each case, DMEA detected the expected MOA as well as other relevant MOAs. Furthermore, the rankings of MOAs generated by DMEA were better than the original single-drug rankings in all tested data sets. Finally, in a drug discovery experiment, we identified potential senescence-inducing and senolytic drug MOAs for primary human mammary epithelial cells and then experimentally validated the senolytic effects of EGFR inhibitors.

Conclusions: DMEA is a versatile bioinformatic tool that can improve the prioritization of candidates for drug repurposing. By grouping drugs with a shared MOA, DMEA increases on-target signal and reduces off-target effects compared to analysis of individual drugs. DMEA is publicly available as both a web application and an R package at https://belindabgarana.github.io/DMEA .

Keywords: Drug repurposing; Enrichment analysis; Gene expression analysis; Mechanism of action; Precision medicine; Proteomic analysis; Senescence; Senolytic; Targeted therapeutics.


Conflict of interest statement

The authors declare that they have no competing interests.

Figures

Fig. 1
Fig. 1
DMEA is more flexible and statistically rigorous than other approaches to evaluate drug MOA. The Venn diagram compares our method, DMEA, with the Connectivity Map (CMap) L1000 query of gene expression signatures [8] and the DrugEnrichr [–37] and Drugmonizome methods [38]
Fig. 2
Fig. 2
Overview of drug mechanism enrichment analysis. DMEA is an adaptation of GSEA which analyzes a rank-ordered drug list to identify drug MOAs that are overrepresented at either end of the input drug list. Given a rank-ordered drug list where drugs have been annotated with known MOAs, DMEA runs an enrichment analysis for each individual MOA. After calculating p values and FDR q-values, DMEA outputs (1) enrichment results for all tested drug MOAs; (2) a volcano plot summarizing the NES and − log10(p value) for all tested drug MOAs; and (3) mountain plot(s) for individual drug MOA(s) which pass the FDR cutoff
Fig. 3
Fig. 3
Sensitivity analysis of DMEA using synthetic data. Synthetic rank-ordered drug lists were generated with varying perturbations (y-axis) of different drug set sizes (x-axis), then analyzed by DMEA (see Methods). For each combination of drug set size and perturbation value, 50 replicates were performed. A Heatmap showing the average DMEA NES for the perturbed drug set. B Heatmap showing the percent of DMEA replicates with FDR q-value < 0.25 for the perturbed drug set
Fig. 4
Fig. 4
DMEA identifies similar MOAs based on gene expression connectivity scores. Rank-ordered drug lists were generated by querying the CMap L1000 gene expression perturbation signatures and then analyzed by DMEA. A HUVEC cells treated with the HMGCR inhibitor pitavastatin [41], B A375 melanoma clones treated with the MEK inhibitor GSK212 [42], and C JEKO1 cells treated with the proteasome inhibitor bortezomib [43]. Volcano plots summarizing the NES and − log10(p value) for all tested drug MOAs and mountain plots of the expected MOAs are shown. Red text indicates MOAs with p value < 0.05 and FDR < 0.25. For each mountain plot, the inhibitors with the most positive connectivity scores are highlighted
Fig. 5
Fig. 5
DMEA identifies selectively toxic MOAs based on cell viability connectivity scores. Rank-ordered drug lists were generated by querying the PRISM database with input cell line sets characterized by A the activating EGFR mutation p.E746_A750del, B high expression of PDGFRA, and C sensitivity to the HMGCR inhibitor lovastatin. Volcano plots summarizing the NES and − log10(p value) for all tested drug MOAs and mountain plots of the expected MOAs are shown. Red text indicates MOAs with p value < 0.05 and FDR < 0.25. For each mountain plot, the inhibitors with the most positive connectivity scores are highlighted
Fig. 6
Fig. 6
DMEA identifies selectively toxic MOAs based on external gene expression signatures of intrinsic EGFR inhibitor resistance and acquired RAF inhibitor resistance, respectively. Using gene expression signatures of intrinsic resistance to EGFR inhibition and acquired resistance to RAF inhibition, we calculated WGV molecular classification scores for 327 adherent cancer cell lines in the CCLE database. For each signature, the WGV scores were correlated with drug sensitivity scores (i.e., AUC) for 1351 drugs from the PRISM database. Drugs were then ranked by Pearson correlation coefficient, and DMEA was performed to identify selectively toxic MOAs. A DMEA analysis of GSE12790 [48] transcriptomic signature of intrinsic resistance to EGFR inhibitor erlotinib, including a volcano plot of NES versus − log10(p value) for MOA evaluated where red text indicates MOAs with p value < 0.05 and FDR < 0.25 and a mountain plot showing that DMEA identified the EGFR inhibitor MOA as negatively enriched. The most negatively correlated EGFR inhibitors are labeled along with their correlation coefficients. B Comparison of three transcriptomic signatures for intrinsic resistance to EGFR inhibition analyzed using DMEA, including a Venn diagram showing the number of shared genes among the signatures and a dot plot illustrating the consistency of MOA enrichment across DMEA’s analyses. C DMEA analysis of GSE66539 [51] transcriptomic signature of acquired resistance to RAF inhibitor vemurafenib, including a volcano plot of NES versus − log10(p value) for MOA evaluated where red text indicates MOAs with p value < 0.05 and FDR < 0.25 and a mountain plot showing that DMEA identified the RAF inhibitor MOA as negatively enriched. The most negatively correlated RAF inhibitors are labeled along with their correlation coefficients
Fig. 7
Fig. 7
DMEA identifies potential senescence-inducing and senolytic drug MOAs for primary HMECs. A Schematic detailing how the proteomic signature of replicative senescence in primary HMECs [46] was used to identify either senescence-inducing or senolytic drug MOAs. B DMEA results for senescence-inducing drug MOAs. (Left) Volcano plot of NES versus − log10(p value) for drug MOAs from DMEA. Red text indicates MOAs with p value < 0.05 and FDR < 0.25. (Right) Mountain plot showing the positive enrichment of the proteasome inhibitor MOA in the rank-ordered drug list of CMap L1000 connectivity scores. The proteasome inhibitors with the most positive connectivity scores are highlighted. C DMEA results for senolytic drug MOAs. (Left) Volcano plot of NES versus − log10(p value) for drug MOAs from DMEA. Red text indicates MOAs with p value < 0.05 and FDR < 0.25. (Right) Mountain plot showing the positive enrichment of the EGFR inhibitor MOA in the rank-ordered drug list of correlation coefficients. The EGFR inhibitors with the most positive correlation coefficients are highlighted. D The EGFR inhibitors dacomitinib and AZD8931 and the senolytic compound navitoclax exhibited senolytic activity in HMECs. Proliferating HMECs (PD ~ 12) were treated with DMSO or 2 μM triapine for 3 days to induce proliferating or senescent phenotypes, respectively, as in our previous work [53]. Proliferating and senescent HMECs were then treated with DMSO (negative control), 100 nM/500 nM dacomitinib, 100 nM / 500 nM AZD8931, or 100 / 500 nM navitoclax for 3 days, after which cell viability and live cell number were measured by trypan blue staining. The live cell number was normalized to the number of live cells present at the time of drug treatment. * and ** represent p < 0.05 and 0.01, respectively, compared to the senescent DMSO control calculated by Student’s t-test

Similar articles

Cited by

References

    1. Li H, Ning S, Ghandi M, Kryukov GV, Gopal S, Deik A, et al. The landscape of cancer cell line metabolism. Nat Med. 2019;25:850. doi: 10.1038/s41591-019-0404-8. - DOI - PMC - PubMed
    1. Nusinow DP, Szpyt J, Ghandi M, Rose CM, McDonald ER, Kalocsay M, et al. Quantitative proteomics of the cancer cell line encyclopedia. Cell. 2020;180:387–402.e16. doi: 10.1016/j.cell.2019.12.023. - DOI - PMC - PubMed
    1. Ghandi M, Huang FW, Jané-Valbuena J, Kryukov GV, Lo CC, McDonald ER, et al. Next-generation characterization of the Cancer Cell Line Encyclopedia. Nature. 2019;569:503–508. doi: 10.1038/s41586-019-1186-3. - DOI - PMC - PubMed
    1. Frejno M, Meng C, Ruprecht B, Oellerich T, Scheich S, Kleigrewe K, et al. Proteome activity landscapes of tumor cell lines determine drug responses. Nat Commun. 2020;11:3639. doi: 10.1038/s41467-020-17336-9. - DOI - PMC - PubMed
    1. Corsello SM, Nagari RT, Spangler RD, Rossen J, Kocak M, Bryan JG, et al. Discovering the anticancer potential of non-oncology drugs by systematic viability profiling. Nat Cancer. 2020;1:235–248. doi: 10.1038/s43018-019-0018-6. - DOI - PMC - PubMed