

Spatial and temporal distribution of reported dengue cases and hot spot identification in Quezon City, Philippines, 2010-2017
- PMID: 37226211
- PMCID: PMC10208904
- DOI: 10.1186/s41182-023-00523-x
Spatial and temporal distribution of reported dengue cases and hot spot identification in Quezon City, Philippines, 2010-2017
Abstract
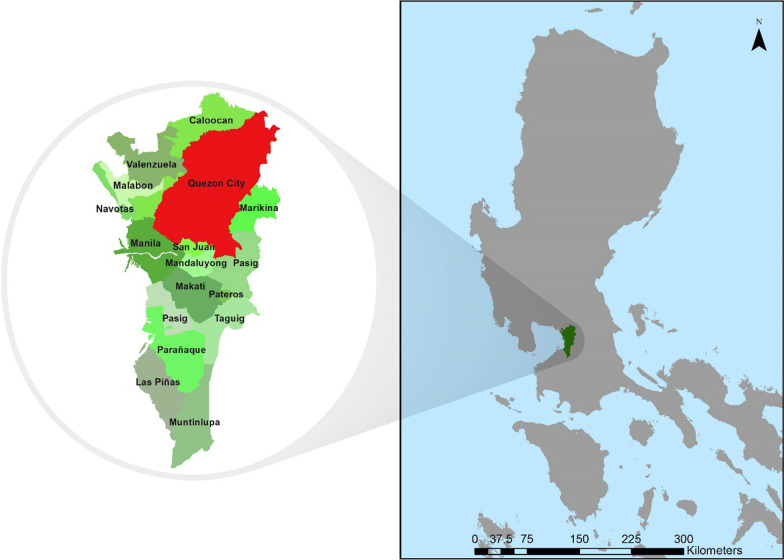
Background: Dengue remains a major public health problem in the Philippines, particularly in urban areas of the National Capital Region. Thematic mapping using geographic information systems complemented by spatial analysis such as cluster analysis and hot spot detection can provide useful information to guide preventive measures and control strategies against dengue. Hence, this study was aimed to describe the spatiotemporal distribution of dengue incidence and identify dengue hot spots by barangay using reported cases from Quezon City, the Philippines from 2010 to 2017.
Methods: Reported dengue case data at barangay level from January 1, 2010 to December 31, 2017 were obtained from the Quezon City Epidemiology and Surveillance Unit. The annual incidence rate of dengue from 2010 to 2017, expressed as the total number of dengue cases per 10,000 population in each year, was calculated for each barangay. Thematic mapping, global cluster analysis, and hot spot analysis were performed using ArcGIS 10.3.1.
Results: The number of reported dengue cases and their spatial distribution varied highly between years. Local clusters were evident during the study period. Eighteen barangays were identified as hot spots.
Conclusions: Considering the spatial heterogeneity and instability of hot spots in Quezon City across years, efforts towards the containment of dengue can be made more targeted, and efficient with the application of hot spot analysis in routine surveillance. This may be useful not only for the control of dengue but also for other diseases, and for public health planning, monitoring, and evaluation.
Keywords: And Getis-Ord Local Gi*; Dengue; GIS; Getis-Ord General G statistic; Hot spot; Philippines; Quezon City; Spatial cluster.
© 2023. The Author(s).
Conflict of interest statement
The authors declare that they have no competing interests.
Figures


References
Grants and funding
LinkOut - more resources
Full Text Sources