. 2023 May 24;21(1):123.
doi: 10.1186/s12915-023-01612-3.

Epigenetic regulation of human-specific gene expression in the prefrontal cortex

Affiliations

Epigenetic regulation of human-specific gene expression in the prefrontal cortex

Weifen Sun et al. BMC Biol. .

Abstract

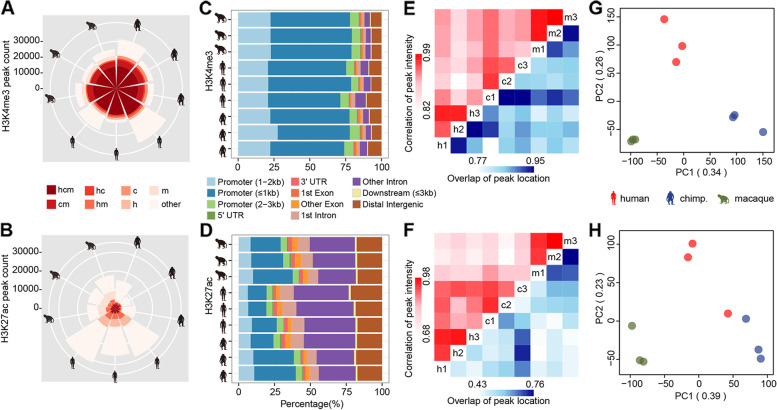
Background: Changes in gene expression levels during brain development are thought to have played an important role in the evolution of human cognition. With the advent of high-throughput sequencing technologies, changes in brain developmental expression patterns, as well as human-specific brain gene expression, have been characterized. However, interpreting the origin of evolutionarily advanced cognition in human brains requires a deeper understanding of the regulation of gene expression, including the epigenomic context, along the primate genome. Here, we used chromatin immunoprecipitation sequencing (ChIP-seq) to measure the genome-wide profiles of histone H3 lysine 4 trimethylation (H3K4me3) and histone H3 lysine 27 acetylation (H3K27ac), both of which are associated with transcriptional activation in the prefrontal cortex of humans, chimpanzees, and rhesus macaques.

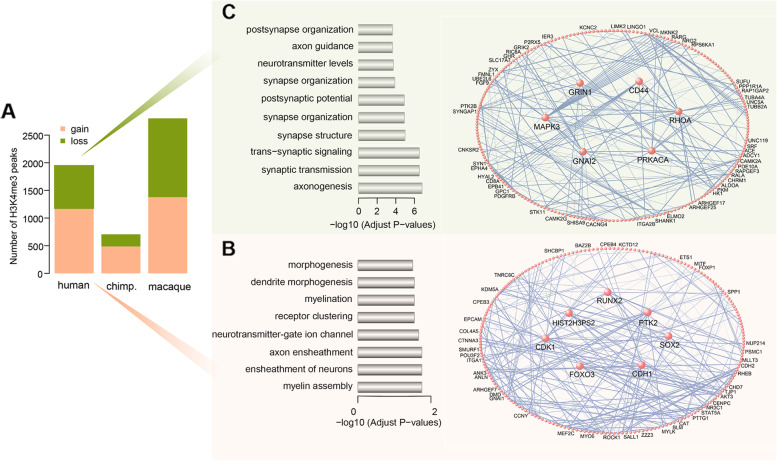
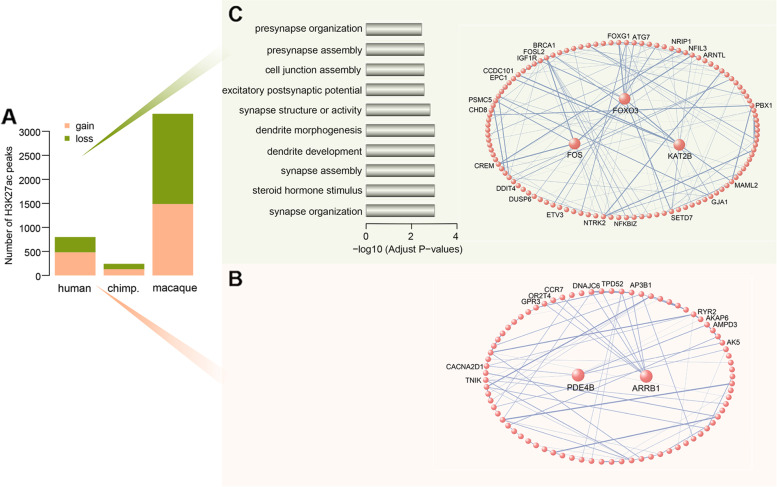
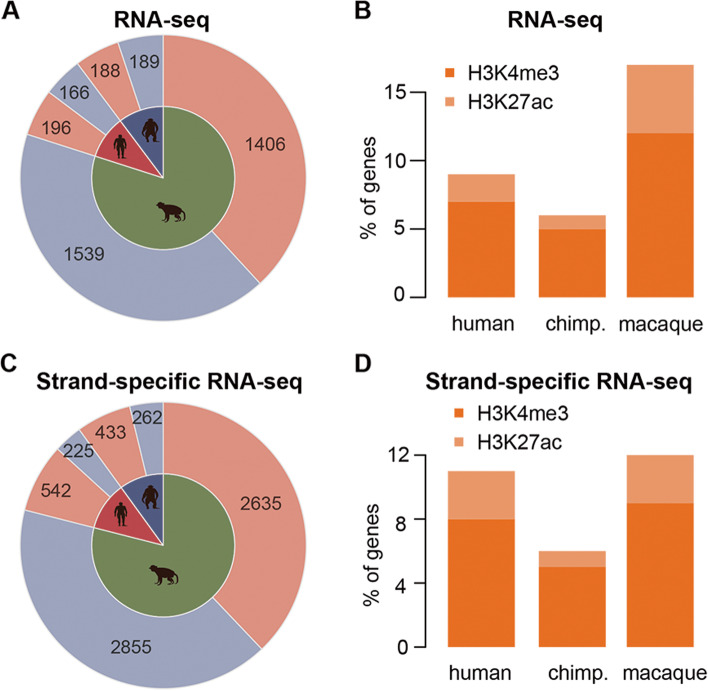
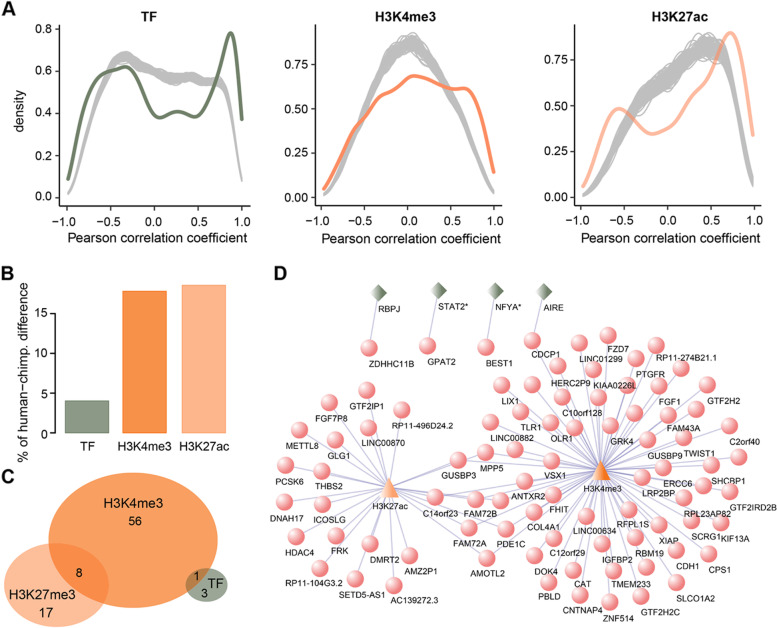
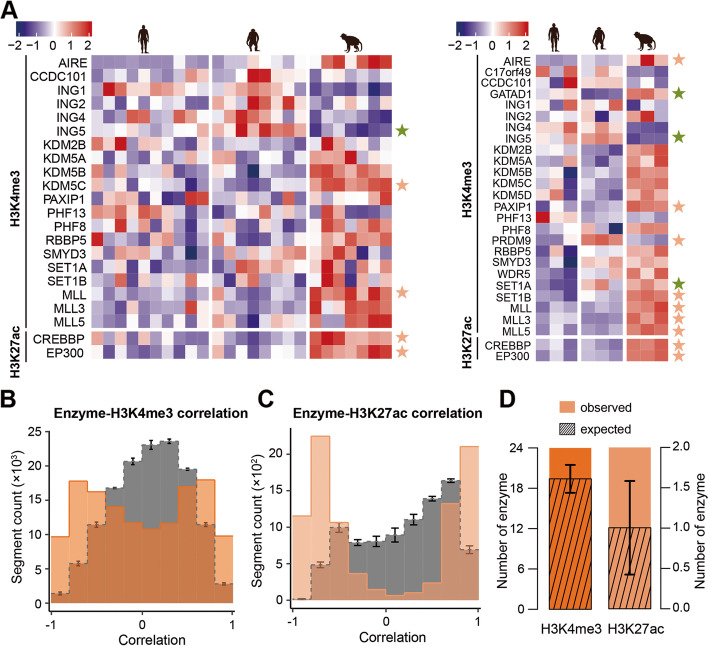
Results: We found a discrete functional association, in which H3K4me3HP gain was significantly associated with myelination assembly and signaling transmission, while H3K4me3HP loss played a vital role in synaptic activity. Moreover, H3K27acHP gain was enriched in interneuron and oligodendrocyte markers, and H3K27acHP loss was enriched in CA1 pyramidal neuron markers. Using strand-specific RNA sequencing (ssRNA-seq), we first demonstrated that approximately 7 and 2% of human-specific expressed genes were epigenetically marked by H3K4me3HP and H3K27acHP, respectively, providing robust support for causal involvement of histones in gene expression. We also revealed the co-activation role of epigenetic modification and transcription factors in human-specific transcriptome evolution. Mechanistically, histone-modifying enzymes at least partially contribute to an epigenetic disturbance among primates, especially for the H3K27ac epigenomic marker. In line with this, peaks enriched in the macaque lineage were found to be driven by upregulated acetyl enzymes.

Conclusions: Our results comprehensively elucidated a causal species-specific gene-histone-enzyme landscape in the prefrontal cortex and highlighted the regulatory interaction that drove transcriptional activation.

Keywords: ChIP-seq; H3K27ac; H3K4me3; Histone-modifying enzyme; Prefrontal cortex (PFC); Strand-specific RNA-seq (ssRNA-seq); Transcription factor (TF).


Conflict of interest statement

The authors declare that they have no competing interests.

Figures

Fig. 1
Fig. 1
Epigenome profiling in the PFC cortex. A, B Graphical representation of the global peak distribution. hcm: Peaks shared among all three primates; cm, hc, hm: Peaks shared between pairwise primates; c, h, m: Peaks unique to each primate. The number of peaks is shown on the y-axis (n = 3) (See replicate data in Additional file 1: Tables S3 and S4). C, D Overlap of peaks within each individual and given features based on genomic coordinates. Different colors denote different genomic features. The x-axis denotes the proportion of peaks intersected with specific genomic features. The y-axis denotes each primate (n = 3) (See replicate data in Additional file 1: Tables S3 and S4). E, F Hierarchical clustering of three humans, three chimpanzees, and three macaques based on either correlation of peak intensity (top left) or overlap of peak coordinates (bottom right) for H3K4me3 (E) and H3K27ac (F) epigenome (n = 3) (See replicate data in Additional file 1: Tables S3 and S4). G, H Principal components based on the peak intensity of H3K4me3 (G) and H3K27ac (H). Each point represents an individual; colors represent primates (red, human; blue, chimpanzee; green, macaque). The proportion of variance explained by each component is shown on the axis labels (n = 3) (See replicate data in Additional file 1: Tables S3 and S4)
Fig. 2
Fig. 2
Human-specific signature of the H3K4me3 epigenome. A Number of species-specific H3K4me3 peaks. The orange represents H3K4me3 peaks with significant enrichment unique to each primate; green represents H3K4me3 peaks with significant depletion unique to each primate (n = 3) (See replicate data in Additional file 1: Tables S5 and S6). B Left panel: Gene ontology categories enriched with annotated genes adjacent to H3K4me3HP gain. The x-axis denotes log10-transformed BH-corrected P values. Right panel: Network visualization of genes adjacent to H3K4me3HP gain. C Left panel: Gene ontology categories enriched with annotated genes adjacent to H3K4me3HP loss. The x-axis denotes log10-transformed BH-corrected P values. Right panel: Network visualization of genes adjacent to H3K4me3HP loss. For these two networks, the largest sub-networks are shown. Each circle represents an individual gene. Genes with the highest connectivity (i.e., hubs) are shown as larger sizes
Fig. 3
Fig. 3
Human-specific signature of the H3K27ac epigenome. A Numbers of species-specific H3K27ac peaks. The orange represents H3K27ac peaks with significant enrichment unique to each primate, green represents H3K27ac peaks with significant depletion unique to each primate (n = 3) (See replicate data in Additional file 1: Tables S9 and S10). B Network visualization of genes adjacent to H3K27acHP gain. C Left panel: Relevant gene ontology categories enriched with annotated genes adjacent to H3K4me3HP loss. The x-axis denotes log10-transformed BH-corrected P values. Right panel: Network visualization of genes adjacent to H3K27acHP loss. The largest sub-networks are shown for both networks. Each circle represents an individual gene. Genes with the highest connectivity (i.e., hubs) are shown as larger sizes
Fig. 4
Fig. 4
Regulation of species-specific gene expression by species-specific H3K4me3 and H3K27ac peaks. A, C Summary of the species-specific expressed genes detected in the RNA-seq dataset (A) and ssRNA-seq dataset (C). The pink and purple denote upregulated and downregulated genes specific to primates, respectively. The silhouette denotes primate identity throughout the figure (red, human; blue, chimpanzee; green, macaque). Digits in areas denote the number of genes. B, D Proportion of species-specific expressed genes regulated by species-specific H3K4me3 peaks (orange) and H3K27ac peaks (light orange) in the RNA-seq (B) and ssRNA-seq (D) datasets. The y-axis displays percentile values. C, D (n = 3) (See replicate data in Additional file 1: Table S13)
Fig. 5
Fig. 5
Histone-TF target regulatory network. A Colored curves showing the correlation between species-specific expressed genes detected in the ssRNA-seq dataset and their corresponding regulators. The gray areas show the expected by chance correlation calculated by randomly sampling the same number of non-species-specific genes and their coupled regulators based on 100 permutations. The x-axis denotes the Pearson correlation coefficients and the y-axis denotes the density estimation. B The percentage of gene expression variance between humans and chimpanzees explained by TF expression differences, or H3K4me3 and H3K27ac coverage differences. C The overlap of the human-specific genes that significantly correlated with TFs, or those close to H3K4me3HP and H3K27acHP. A–C Green, TF; orange, H3K4me3; light orange, H3K27ac. D Network visualization of human-specific genes regulated by TF, H3K4me3HP, and H3K27acHP corresponding to C. Genes marked with asterisks denote TFs highly correlated with human-specific genes. Red circle, human-specific gene; triangle, H3K4me3 (orange) and H3K27ac (light orange); green quadrangle, TF
Fig. 6
Fig. 6
Expression profile of histone-modifying enzymes. A Heatmap of 22 histone-modifying enzymes based on gene expression levels measured in the RNA-seq dataset (left panel) and 27 histone-modifying enzymes based on the gene expression levels measured in the ssRNA-seq dataset (right panel). Corresponding human, chimpanzee, and macaque as indicated (top). Color scaled bars represent the normalized read counts. Stars on the right side denote species-specific expressed genes. Human-specific genes: SET1A; chimpanzee-specific genes: GATAD1, PRDM9; macaque-specific genes: AIRE, ING5, PAXIP1, KDM5C, SET1B, MLL, MLL3, MLL5, CREBBP, EP300. (orange: upregulated; green, downregulated). B Pearson correlation of 25 H3K4me3-modifying enzymes derived from ssRNA-seq dataset and 5459 species-specific H3K4me3 peaks. C Pearson correlation of two H3K27ac-modifying enzymes derived from ssRNA-seq dataset and 4404 species-specific H3K27ac peaks. B, C The gray bars represent the mean correlation coefficients expected by chance, calculated by randomly subsampling the same number of non-species-specific peaks and repeating the permutation 100 times. The test was conducted using the expression profiles for all three species. The error bars represent the mean ± 3SD. D Number of enzymes significantly correlated with H3K4me3 and H3K27ac peaks (colorful bars). The Pearson correlation of each enzyme derived from ssRNA-seq dataset and species-specific histone peaks was compared to the correlations between the same enzyme and the same number of non-species-specific peaks using one-sided Wilcoxon test (P < 0.01). The average number based on 1000 permutations is defined as the number of significantly correlated enzymes. The streaked bars represent the average number of correlated enzymes expected by chance, calculated from 1000 random samplings of nonenzymatic genes and the same number of non-species-specific histone peaks. The test was conducted using all three species’ expression profiles. The error bars represent the mean ± SD

References

    1. Preuss TM. The human brain: rewired and running hot. Ann N Y Acad Sci. 2011;1225 Suppl 1(Suppl 1):E182–191. doi: 10.1111/j.1749-6632.2011.06001.x. - DOI - PMC - PubMed
    1. Roth G, Dicke U. Evolution of the brain and intelligence in primates. Prog Brain Res. 2012;195:413–430. doi: 10.1016/B978-0-444-53860-4.00020-9. - DOI - PubMed
    1. Laland K, Seed A. Understanding human cognitive uniqueness. Annu Rev Psychol. 2021;72:689–716. doi: 10.1146/annurev-psych-062220-051256. - DOI - PubMed
    1. Waterson RH, Lander ES, Wilson RK, The Chimpanzee S, Analysis C. Initial sequence of the chimpanzee genome and comparison with the human genome. Nature. 2005;437(7055):69–87. doi: 10.1038/nature04072. - DOI - PubMed
    1. Kronenberg ZN, Fiddes IT, Gordon D, Murali S, Cantsilieris S, Meyerson OS, Underwood JG, Nelson BJ, Chaisson MJP, Dougherty ML, et al. High-resolution comparative analysis of great ape genomes. Science. 2018;360(6393):eaar6343. doi: 10.1126/science.aar6343. - DOI - PMC - PubMed

Publication types