. 2023 Jul 5;13(7):jkad115.
doi: 10.1093/g3journal/jkad115.

Impact of the acquired subgenome on the transcriptional landscape in Brettanomyces bruxellensis allopolyploids

Affiliations

Impact of the acquired subgenome on the transcriptional landscape in Brettanomyces bruxellensis allopolyploids

Arthur Jallet et al. G3 (Bethesda). .

Abstract

Gene expression variation can provide an overview of the changes in regulatory networks that underlie phenotypic diversity. Certain evolutionary trajectories such as polyploidization events can have an impact on the transcriptional landscape. Interestingly, the evolution of the yeast species Brettanomyces bruxellensis has been punctuated by diverse allopolyploidization events leading to the coexistence of a primary diploid genome associated with various haploid acquired genomes. To assess the impact of these events on gene expression, we generated and compared the transcriptomes of a set of 87 B. bruxellensis isolates, selected as being representative of the genomic diversity of this species. Our analysis revealed that acquired subgenomes strongly impact the transcriptional patterns and allow discrimination of allopolyploid populations. In addition, clear transcriptional signatures related to specific populations have been revealed. The transcriptional variations observed are related to some specific biological processes such as transmembrane transport and amino acids metabolism. Moreover, we also found that the acquired subgenome causes the overexpression of some genes involved in the production of flavor-impacting secondary metabolites, especially in isolates of the beer population.

Keywords: Brettanomyces bruxellensis; polyploids; subgenome; transcriptional landscape; yeast.


Conflict of interest statement

Conflicts of interest statement The author(s) declare no conflict of interest.

Figures

Fig. 1.
Fig. 1.
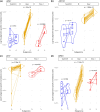
Intra- and inter-population variations of expression profiles of the primary diploid and acquired haploid subgenomes. a) Minimum evolution tree constructed on the basis of 345,272 biallelic single nucleotide variants detected through the mapping of RNAseq reads on the primary diploid subgenome. b) Principal component analysis from all reads that mapped to the primary diploid subgenome, which is present in all isolates of the Brettanomyces bruxellensis species. Read counts were normalized by accounting for the fraction of reads assigned to the diploid subgenome during competitive mapping and log2 transformed. c) PCA based on reads that mapped to the acquired haploid subgenomes of allotriploid isolates (Teq/EtOH, Beer, and Wine 1) during competitive mapping. Genes shared by the three acquired subgenomes of these populations were used, and counts were normalized by the total number of reads assigned to these 2,819 genes, before log2 transformation. For both PCA, symbol shapes represent allotriploid (filled circles) and non-allotriploid (triangles) populations and samples are linked to the centroid of the population they belong to.
Fig. 2.
Fig. 2.
Distinctive patterns of global expression profiles across populations. a) For allotriploid samples (Teq/EtOH, Beer, and Wine 1), reads that mapped to genes present on the acquired haploid subgenome were summed with reads mapped to their orthologs of the primary genome, resulting in collapsed read counts. Collapsed counts from allotriploids and counts from non-allopolyploids were used to perform a principal component analysis after normalization by total library size and log2 transformation. Colors stand for populations, and symbol shapes represent allotriploid (filled circles) and non-allotriploid (triangles) populations; samples are linked to the centroid of the population they belong to. b) Matrix of pairwise correlation between isolates expression profiles. Correlation coefficient was computed using the Spearman correlation. Collapsed counts were used for allotriploid samples, and counts were normalized by total library size. Samples were intendedly ordered by population, as shown by the color of the isolate labels.
Fig. 3.
Fig. 3.
Enrichment in transmembrane transport in sets of differentially expressed genes. a) A test of functional enrichment based on gene ontology terms was performed on the sets of differentially expressed (DE) genes in each population. Ontology terms are classified in three broad categories: BP for biological process (squares), CC for cellular component (filled circles), and MF for molecular function (triangles). For each term found as significantly over-represented, dot size indicates the number of differentially expressed genes annotated with this term, and shades of blue indicate the adjusted P-value (Benjamini–Hochberg correction) of the enrichment. Position of dots along the x-axis is proportional to the enrichment score, defined as the ratio between the proportion of DE genes with the focal GO term in the set of DE genes to the proportion of genes annotated in the genome with the focal term. Only populations for which at least one functional term was found over-represented in the set of DE genes are represented. b) Collapsed expression level in transcripts per million (TPM) of the sulfite efflux pump SSU1 (locus_tag=DEBR0S2e12442g). P-values indicate the FDR-corrected significance of pairwise t-tests (Welch's t-tests assuming unequal variance), and only pairwise comparisons between the three “Wine” populations and the Beer and Teq/EtOH populations are reported. We note that testing the overall expression across the three “Wine” groups against the Teq/EtOH and Beer groups pooled together results in a highly significant difference (P = 2.0e−09, Welch's t-test). When each group was contrasted to all the others, SSU1 was downregulated in both Beer and Teq/EtOH, while it was upregulated in Wine 3 and Kombucha.
Fig. 4.
Fig. 4.
Transcriptomic signatures differentiating populations of Brettanomyces bruxellensis. a and b) Expression of two Teq/EtOH transcriptomic signatures across populations: the respiratory supercomplex factor (RCF1) and the cytochrome oxidase assembly gene (COA6). c to f) Expression of four Wine 1 transcriptomic signatures across populations: the cytochrome c1 gene (CYT1), the hydrogen peroxide resistance gene (APD1), the riboflavin biosynthesis gene (RIB1), and the glutathione peroxydase hydroperoxyde resistance gene (HYR1). g and h) Expression of two Beer transcriptomic signatures across populations: the decarboxylase-encoding ARO10 gene and the oxidoreductase-encoding ARA1 gene. For all panels, P-values indicate the significance of testing collapsed expression level in the clade in which the considered gene is a signature against other clades as a whole, using a t-test assuming unequal variance (Welch's t-test). For each panel, expression levels are given in transcripts per million (TPM).
Fig. 5.
Fig. 5.
Differential expression between subgenomes within allopolyploid populations. a and b) Expression of ARA1 and ARO10 genes in the primary (2n) and acquired (1n) subgenomes of allotriploids. Expression of ARO10 in Wine 1 is not shown because the considered gene is not present in the haploid subgenome of Wine 1. c and d) Expression of IAH1 and GRE3 in the subgenomes of allotriploids. Expression of IAH1 in Teq/EtOH is not shown because the considered gene is not present in the haploid subgenome of Teq/EtOH. P-values are from paired t-tests assuming unequal variance (paired Welch's t-test). Note that in the manuscript, we use the following rationale to consider a gene consistently differentially expressed between subgenomes in a population: it significantly deviates from the 2n versus 1n sample-specific relationship in most samples of the focal population (>7/9 Teq/EtOH samples; >25/30 Beer samples; and >5/6 Wine 1 samples). Provided at least one population showed consistent differential expression between its subgenomes, P-values are shown for all three populations, without regarding whether other(s) population(s) fulfilled these per-population criteria of consistent differential expression between subgenomes.

Similar articles

Cited by

References

    1. Albert FW, Bloom JS, Siegel J, Day L, Kruglyak L. Genetics of trans-regulatory variation in gene expression. ELife. 2018;7:1–39. doi:10.7554/eLife.35471. - DOI - PMC - PubMed
    1. Albert FW, Kruglyak L. The role of regulatory variation in complex traits and disease. Nat Rev Genet. 2015;16(4):197–212. doi:10.1038/nrg3891. - DOI - PubMed
    1. Avramova M, Cibrario A, Peltier E, Coton M, Coton E, Schacherer J, Spano G, Capozzi V, Blaiotta G, Salin F, et al. . Brettanomyces bruxellensis population survey reveals a diploid–triploid complex structured according to substrate of isolation and geographical distribution. Sci Rep. 2018;8(1):1–13. doi:10.1038/s41598-018-22580-7. - DOI - PMC - PubMed
    1. Avramova M, Grbin P, Borneman A, Albertin W, Masneuf-Pomarède I, Varela C. Competition experiments between Brettanomyces bruxellensis strains reveal specific adaptation to sulfur dioxide and complex interactions at intraspecies level. FEMS Yeast Res. 2019;19(3):1–9. doi:10.1093/femsyr/foz010. - DOI - PubMed
    1. Avramova M, Vallet-Courbin A, Maupeu J, Masneuf-Pomarède I, Albertin W. Molecular diagnosis of Brettanomyces bruxellensis sulfur dioxide sensitivity through genotype specific method. Front Microbiol. 2018;9(JUN):1–9. doi:10.3389/fmicb.2018.01260. - DOI - PMC - PubMed

Publication types

Supplementary concepts

LinkOut - more resources