

FAM3C/ILEI protein is elevated in psoriatic lesions and triggers psoriasiform hyperproliferation in mice
- PMID: 37226685
- PMCID: PMC10331587
- DOI: 10.15252/emmm.202216758
FAM3C/ILEI protein is elevated in psoriatic lesions and triggers psoriasiform hyperproliferation in mice
Abstract
FAM3C/ILEI is an important cytokine for tumor progression and metastasis. However, its involvement in inflammation remains elusive. Here, we show that ILEI protein is highly expressed in psoriatic lesions. Inducible keratinocyte-specific ILEI overexpression in mice (K5-ILEIind ) recapitulates many aspects of psoriasis following TPA challenge, primarily manifested by impaired epidermal differentiation and increased neutrophil recruitment. Mechanistically, ILEI triggers Erk and Akt signaling, which then activates STAT3 via Ser727 phosphorylation. Keratinocyte-specific ILEI deletion ameliorates TPA-induced skin inflammation. A transcriptomic ILEI signature obtained from the K5-ILEIind model shows enrichment in several signaling pathways also found in psoriasis and identifies urokinase as a targetable enzyme to counteract ILEI activity. Pharmacological inhibition of urokinase in TPA-induced K5-ILEIind mice results in significant improvement of psoriasiform symptoms by reducing ILEI secretion. The ILEI signature distinguishes psoriasis from healthy skin with uPA ranking among the top "separator" genes. Our study identifies ILEI as a key driver in psoriasis, indicates the relevance of ILEI-regulated genes for disease manifestation, and shows the clinical impact of ILEI and urokinase as novel potential therapeutic targets in psoriasis.
Keywords: ILEI/FAM3C; inflammation; keratinocyte differentiation; psoriasis; uPA/PLAU.
© 2023 The Authors. Published under the terms of the CC BY 4.0 license.
Conflict of interest statement
The authors declare that they have no conflict of interest.
Figures

Representative images of ILEI immunohistochemistry on healthy (upper panels) and psoriatic (lower panels) skin sections, scale bar 100 μm. Inlets show a magnification of the marked regions, scale bar 50 μm.
Distribution of ILEI protein content per keratinocyte (n = 5,000–15,000 cells per skin sample) in healthy and psoriatic skin. Box‐and‐whiskers plot: Central band shows median, box extends from the 25th to 75th percentiles, and whiskers go from the 1st to the 99th percentiles.
Median ILEI content of keratinocytes per person shown as mean ± SEM of healthy (n = 6) and psoriasis (n = 5) conditions.
Pearson correlation plot of median ILEI content per keratinocyte and epidermal thickness of psoriatic skin (n = 5).
Mean ± SEM of epidermal ILEI load per mm skin section in healthy (n = 6) and psoriasis (n = 5) condition. A.U., arbitrary unit.

- A
Schematic view of the K5‐ILEI ind psoriasis mouse model. Tet‐ON inducible ILEI transgenic mice (ILEI ind ) were crossed with mice expressing the reverse tet‐responsive transactivator in epidermal basal keratinocytes under the control of the bovine Keratin 5 promoter (K5rtTA). TPA treatment was performed for 5 days. Three days prior treatment start mice were switched to doxycycline diet. Dual transgenic K5‐ILEI ind mice with normal diet, ILEI ind mice with normal and doxycycline diet and acetone treatment were used as genetic, diet, and treatment controls, respectively.
- B–E
(B) Macroscopic appearance, (C) hematoxylin–eosin staining with scale bar of 50 μm and (D) mean epidermal thickness ± SEM of the back skin of ILEI ind and K5‐ILEI ind mice kept on normal or doxycycline diet and treated with acetone or TPA for 5 days (n = 2–5; 3 independent experiments). Statistical significance was determined by one‐way ANOVA with Tukey multiple comparison test and marked with asterisks (*P < 0.05; ***P < 0.001). (E) Representative images of ILEI immunohistochemistry on sections of back skin of ILEI ind and K5‐ILEI ind mice kept on normal or doxycycline diet upon 5 days of treatment with acetone or TPA. Scale bar 50 μm. Inlets show a magnification of the marked regions, scale bar 20 μm.
- A, B
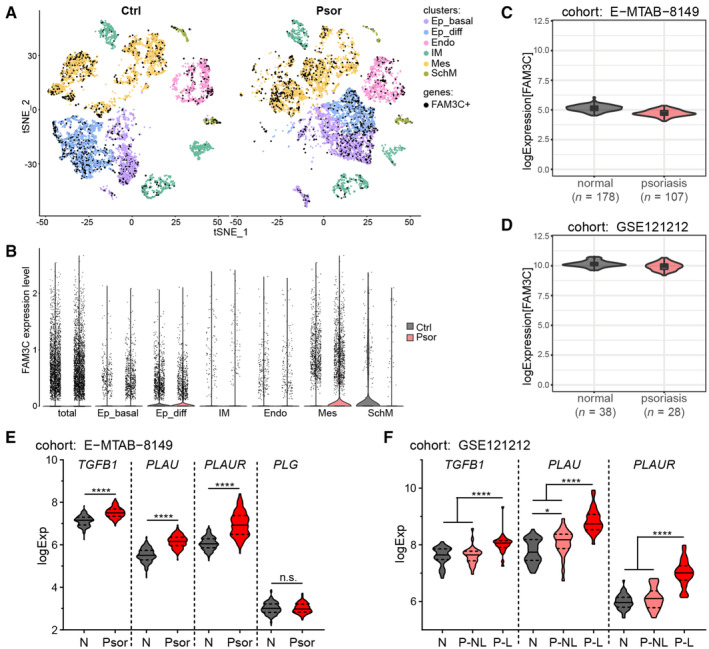
scRNA‐Seq human full‐thickness skin dataset GSEE162183 of control (Ctrl) and Psoriasis (Psor) patients presented (A) in t‐SNE overlay visualization overlayed with cells expressing FAM3C and (B) in violin plots showing expression levels of FAM3C in respective cell clusters. Ep_basal, epidermis basal subcluster; Ep_diff, epidermis differentiated subcluster; IM, immune cluster; Endo, endothelial cluster; Mes, mesenchymal cluster; SchM, Schwann/Melanocyte‐like cluster.
- C, D
log2fold FAM3C mRNA expression levels in normal skin and psoriatic lesions of the datasets (C) MTAB‐8149 (n = 285) and (D) GSE121212 (n = 66). Violin plot overlayed with Box‐and‐whiskers plot: Central band shows median, box extends from the 25th to 75th percentiles and whiskers go from the smallest (min) to the largest (max) value. Density curves of the violin plot correspond to the approximate frequency of data points in each region.
- E, F
log2fold mRNA expression levels of (E) TGFB1, PLAU, PLAUR and PLG in normal skin (N) (n = 178) and psoriatic lesions (Psor; n = 107) of the RNA sequencing dataset MTAB‐8149 and (F) TGFB1, PLAU and PLAUR in normal skin (N) (n = 38) and in nonlesional (P‐NL) (n = 27) and lesional (P–L) skin (n = 28) of psoriasis patients of the microarray dataset GSE121212. Violin plots: central band shows median, dashed lines label the 25th and 75th percentiles, and density curves correspond to the approximate frequency of data points in each region extending from the smallest (min) to the largest (max) value.

- A–F
Analysis on back skin of wild‐type mice treated for 0, 3, 5, and 7 days with (A–C) TPA or (D–F) IMQ followed by an additional withdrawal for 3 days (n = 3 for each time point and treatment; 2 independent experiments). Timely changes of (A,D) mean epidermal thickness ± SEM and (B, E) mean ILEI mRNA expression fold change ±SEM. Epidermal thickness was quantified from (C, F left panels) hematoxylin–eosin stained thin sections of back skin. mRNA expression was normalized to untreated skin (Day 0). (C, F right panels) Representative images of ILEI immunohistochemistry on thin sections of back skin. Scale bar 100 μm. Inlets show a magnification of the marked regions, scale bar 20 μm. IMQ, imiquimod; nd, not done.

Representative images of Ki67 immunohistochemistry on back skin sections of K5‐ILEI ind and ILEI ind mice kept on normal or doxycycline diet and treated with acetone or TPA for 5 days. Scale bar: 100 μm.
Percentage of Ki67 positive cells in the epidermis shown as mean ± SEM and quantified on samples described in panel A (n = 1–5; 3 independent experiments).
Immunofluorescence for Keratin 5 (K5; red) and Keratin 10 (K10; green) expression on TPA‐treated skin sections of mice described in panel A. Nuclei were counterstained with DAPI (blue). Scale bar: 50 μm. Inlets show a magnification of the marked regions. Scale bar: 20 μm.
Keratin 16 (K16) western blot analysis (left) and quantification (right) of proteins extracted from back skin of ILEI ind and K5‐ILEI ind mice kept on doxycycline and treated with acetone or TPA for 5 days (n = 3). Vinculin was used as loading control.
Mean mRNA expression ±SEM of K5, K10, and K16 in keratinocytes enriched for the interfollicular epithelium freshly sorted from acetone and TPA‐treated back skin of mice described in panel D (n = 3).
Immunofluorescence for Keratin 5 (K5; red) and Keratin 10 (K10; green) on in vitro acetone and TPA‐treated, doxycycline‐induced, primary keratinocytes with or without calcium‐induced differentiation (72 h) isolated from ILEI ind and K5‐ILEI ind mice. Nuclei are counterstained with DAPI (blue); scale bar, 20 μm.
Mean fold change in mRNA expression ±SEM of K5 and K10 in primary keratinocytes described in panel F (n = 5–6; 2 independent experiments).

- A
Representative images of MPO‐positive microabscesses stained on sections of acetone and TPA‐treated back skin of ILEI ind and K5‐ILEI ind mice kept on normal or doxycycline diet. Scale bar: 100 μm.
- B–D
Mean number ± SEM of (B) neutrophil‐positive microabscesses/cm skin section, (C) neutrophils (MPO+ cells)/mm2 epidermal‐dermal area and (D) epidermal CD8+ T cells/cm skin section of mice described in A (n = 3–5 (B and C), n = 1–5 (D); 3 independent experiments). N.A., not analyzed.
- E, F
Mean fold change ±SEM in mRNA expression of Tnfa, Il1α, and Cxcl1 (E) in freshly sorted keratinocytes enriched for the interfollicular epithelium (IFE) and hair follicles (HF) from acetone and TPA‐treated back skin and (F) in primary keratinocyte cultures isolated from ILEI ind and K5‐ILEI ind mice supplemented with doxycycline and treated with acetone or TPA for 96 h (n = 3 (E), n = 6 (F); F, 2 independent experiments).
- G–I
Mean fold change ±SEM in mRNA expression of (G) Tnfa, (H) Il1α, and (I) Cxcl1 in primary keratinocytes treated with acetone and TPA and with increasing concentrations (100, 250, 500, 1,000 ng/ml) of murine recombinant ILEI (mILEI) or dimerization‐disabled ILEI (mILEICA) or with empty vector (empty) for 72 h (n = 3, standing for independent keratinocyte cultures from three mice).

- A–C
Representative images of (A) Phospho‐STAT3 (Tyr727), (B) Phospho‐Erk1/2 and (C) Phospho‐Akt immunofluorescence on thin sections of acetone and TPA‐treated back skin of ILEI ind and K5‐ILEI ind mice kept on doxycycline diet. Scale bar, 50 μm.
- D
Representative western blot analysis of STAT3, Akt and Erk1/2 phosphorylation levels in primary wild‐type murine keratinocytes harvested after 0, 10, 30 min, 1 and 4 h upon acetone and TPA and simultaneous control (ctrl) and recombinant wild‐type murine ILEI (mILEI) treatments. Vinculin was used as loading control.
- E
Mean STAT3 (Ser727 and Tyr705), Akt, and Erk1/2 phosphorylation levels ±SEM over time in primary keratinocytes upon TPA and recombinant ILEI treatment as described in panel A (n = 3, standing for independent keratinocyte cultures, each a pool of isolates from two mice).
- F
Western blot analysis of STAT3 (Ser727 and Tyr705), Akt, and Erk1/2 phosphorylation levels in primary Dox‐induced K5‐ILEI ind keratinocytes treated with acetone or TPA for 4 h in the presence of the inhibitors STATTIC (10 μM), LY92004 (10 μM) and UO126 (10 μM). DMSO was used as vehicle control. Vinculin was used as loading control. Lanes are from noncontinuous parts of the same gel.
- G
Mean fold change ±SEM in mRNA expression of TNFα in primary wild‐type murine keratinocytes harvested after 7 h upon acetone and TPA and simultaneous control (ctrl) and recombinant wild‐type murine ILEI (mILEI) treatments in the presence of the inhibitors STATTIC (10 μM), LY92004 (10 μM), and UO126 (10 μM). DMSO was used as vehicle control (n = 2–3, each an independent pool of two mice). Statistical significance was determined by two‐way ANOVA with Tukey multiple comparison test and marked with asterisks (*P < 0.05; ***P < 0.001). If significance levels were different for the pairwise comparisons with combined marking, asterisks, valid only for a subset of the pairs were put into brackets.

- A–C
(A) Macroscopic appearance, (B) hematoxylin–eosin staining with a scale bar of 50 μm and (C) mean epidermal thickness ± SEM of the back skin of ILEIfl/fl and ILEI∆Ep mice treated with acetone or TPA for 5 days (n = 3–8; 3 independent experiments).
- D
Representative images of ILEI immunohistochemistry on thin sections of back skin of ILEIfl/fl and ILEI∆Ep mice treated with acetone or TPA for 5 days. Scale bar 50 μm. Inlets show a magnification of the marked regions, scale bar 20 μm.
- E
Immunofluorescence for K5 (red) and K10 (green) expression on TPA‐treated skin sections of ILEIfl/fl and ILEI∆Ep mice. Nuclei were counterstained with DAPI (blue). Scale bar, 50 μm. Inlets show a magnification of the marked regions, scale bar 20 μm.
- F–H
(F) Representative images of MPO+ microabscesses and neutrophils, (G) mean number ± SEM of MPO‐positive microabscesses/cm skin section and (H) mean number of neutrophils (MPO+ cells)/mm2 epidermal‐dermal area ± SEM on thin sections of acetone and TPA‐treated back skin of ILEI fl/fl and ILEI ∆Ep mice (n = 6–8 (G) and n = 2–8 (H); 3 independent experiments). Scale bar, 100 μm.

- A
Heatmap of nonsupervised hierarchical clustering of differentially expressed genes (DEGs) in the back skin of K5‐ILEI ind vs ILEI ind mice kept on doxycycline diet and treated with TPA for 5 days (n = 3). Gene list was filtered for an adjusted P‐value of < 0.05 and a log fold change of ≥ 1. Arrows mark Fam3c/ILEI and Plau/uPA.
- B, C
Significantly enriched (B) pathways of the Hallmark database ranked according to their normalized enrichment score and (C) terms of the GO:term database plotted in clusters after dimensionality reduction with indicated lead terms in TPA‐treated K5‐ILEI ind mouse skin computed from the gene expression profiling described in panel A.
- D–F
Mean fold change ±SEM in mRNA expression of uPA and uPAR (D) in freshly sorted keratinocytes enriched for the interfollicular epithelium from acetone and TPA‐treated back skin, (E) in primary keratinocytes isolated from ILEI ind and K5‐ILEI ind mice, supplemented with doxycycline and treated with acetone or TPA for 96 h, and (F) in primary wild‐type keratinocytes treated with acetone and TPA and with murine recombinant wild‐type ILEI (mILEI) for 8 and 96 h (n = 3 (D), n = 6 (E,F); 1–2 independent experiments).
- G
Schematic drawing of the protocol used for TPA and UK371804 combination treatment. The two compounds were topically applied daily in a 5–6‐h interval for 5 days.
- H–K
(H) Macroscopic appearance, (I) hematoxylin–eosin staining, (J) mean epidermal thickness and (K) mean uPA activity ±SEM of the back skin of ILEI ind and K5‐ILEI ind mice kept on doxycycline diet and treated with the protocol shown in (G) (n = 3–9 (J), n = 3–7 (K); 3 independent experiments). Scale bars, 100 μm.
- L
ILEI Western blot analysis of conditioned media harvested from primary keratinocytes of ILEI ind and K5‐ILEI ind mice after 48‐h doxycycline induction and treatment with TPA and DMSO or indicated concentrations of UK371804. Loading was normalized to cell count, numbers indicate relative intensities. Lanes are from noncontinuous parts of the same gel.

- A–I
Transcriptomic analysis showing (A, D, G) Differentially expressed genes (DEGs), (B, E, H) significantly enriched pathways of the Hallmark database ranked according to their normalized enrichment score and (C, F, I) significantly enriched terms of the GO:term database plotted in clusters after dimensionality reduction with indicated lead terms computed from the gene expression profiling of (A–C) the back skin of ILEI ind mice treated with acetone or TPA for 5 days (n = 3) and the human psoriasis datasets (D–F) E‐MTAB‐8149 and (G–I) GSE121212. For the volcano plot on (A, D, G), cutoff was set for an adjusted P‐value of <0.05. Genes of the K5‐ILEI ind TPA signature (60 genes) are in blue (downregulated), red (upregulated) or black (nonsignificant), top 10 significant genes of the signature marked by names, if directionality maintained, in bold.
- J
Venn diagram on the distribution of enriched GO terms in the transcriptome of the back skin of K5‐ILEI ind vs ILEI ind mice treated with TPA and the two human psoriasis datasets E‐MTAB‐8149 and GSE121212.

- A–C
Heatmap on genes expressed in TPA or acetone‐treated K5‐ILEI ind and control back skin showing (A) regulatory genes on ILEI translation, secretion, and proteolytic cleavage, (B) EGFR ligands and (C) subset of psoriasis‐relevant cytokines and cognate receptors (n = 3).
- D
Volcano plot showing differentially expressed genes (DEGs) computed from the gene expression profiling of freshly sorted keratinocytes enriched for IFE isolated 24 h after a single TPA treatment of K5‐ILEI ind and ILEI ind mice kept on doxycycline diet (n = 3). Cutoff was set for an adjusted P‐value of <0.05 and a log2FC of ≥ 1. Top 10 up and downregulated genes are marked by names.
- E–G
Heatmap on genes expressed in freshly sorted keratinocytes enriched for IFE isolated 24 h after a single TPA treatment of K5‐ILEI ind and ILEI ind mice (n = 3) showing (E) regulatory genes on ILEI translation and secretion, (F) EGFR ligands and (G) inflammatory genes. Tnf, Il1a, and Cxcl3 are marked in red. Genes with an adjusted P‐value lower than 0.05 are marked with asterisks (*P < 0.05; **P < 0.01; ***P < 0.001; ****P < 0.0001).

Principal component analysis of MINT‐integrated data of the two human datasets E‐MTAB‐8149 and GSE121212 consisting of psoriasis, atopic dermatitis (AD) patients and healthy controls based on the “ILEI signature” obtained from the mouse dataset. Circles mark clusters.
Performance of the “ILEI signature”‐based classification model on the three disease states (normal, psoriasis and AD) of above two human datasets after MINT‐PLSDA‐based data integration plotted on a ROC curve. Discrimination ratio between given status versus both other states is marked in the legend.
Heatmap of nonsupervised hierarchical clustering of the 29 “core separator genes” on MINT transformed expression data of normal and psoriasis conditions of the two human cohorts determined from the “ILEI signature” as number of genes necessary for optimal classification with lowest error rate tested by leave‐one‐out cross‐validation.
Relevance network of the “core separator genes” for normal and psoriasis conditions ranked according to the strength of regulation, considering UP as positive, DOWN as negative scores. Width of the edges depicts the strength of regulation, color marks the direction of regulation. PLAU is highlighted in bold.

- A
Representative images of PLAU immunohistochemistry on psoriatic (left panels) and normal (right panels) skin sections, scale bar 200 μm. Inlets show a magnification of the marked regions, scale bar 50 μm.
- B, C
Pearson correlation plots of K6 (upper panels) and K16 (lower panels) and PLAU gene expression in a combined set of normal and psoriatic skin (left panels) and in psoriatic lesions (right panels) of the datasets (B) MTAB‐8149 and (C) GSE121212.
- D
log2fold PLAU mRNA expression levels of the GSE53552 dataset consisting of lesional and matched nonlesional (NL) psoriatic skin (n = 25 patients) obtained at treatment start (day 1) and from the lesions as serial biopsies at 15 and 43 days after placebo (n = 5 patients) or Brodalumab therapy with doses of 140 mg (n = 4 patients), 350 mg (n = 8 patients) and 700 mg (n = 8 patients). The number of included patient samples at each condition and time points is marked under the diagram. Box‐and‐whiskers plot: Central band shows median, box extends from the 25th to 75th percentiles, and whiskers go from the smallest (min) to the largest (max) value.
- E
Pearson correlation plots of K6 (left panel) and K16 (right panel) and PLAU gene expression of the GSE53552 dataset stratified for nonlesional (NL) and lesional (L) psoriatic skin before therapy (predose) and with placebo or 140, 350, and 700 mg doses of Brodalumab therapy.
References
-
- Akira S (1997) IL‐6‐regulated transcription factors. Int J Biochem Cell Biol 29: 1401–1418 - PubMed
-
- Andres RM, Hald A, Johansen C, Kragballe K, Iversen L (2013) Studies of Jak/STAT3 expression and signalling in psoriasis identifies STAT3‐Ser727 phosphorylation as a modulator of transcriptional activity. Exp Dermatol 22: 323–328 - PubMed
Publication types
MeSH terms
Substances
LinkOut - more resources
Full Text Sources
Medical
Molecular Biology Databases
Research Materials
Miscellaneous
