Observational Study
. 2023 Sep 1;164(9):2070-2083.
doi: 10.1097/j.pain.0000000000002909. Epub 2023 Apr 27.

Multimodal hypersensitivity derived from quantitative sensory testing predicts pelvic pain outcome: an observational cohort study

Affiliations
Observational Study

Multimodal hypersensitivity derived from quantitative sensory testing predicts pelvic pain outcome: an observational cohort study

Matthew J Kmiecik et al. Pain. .

Abstract

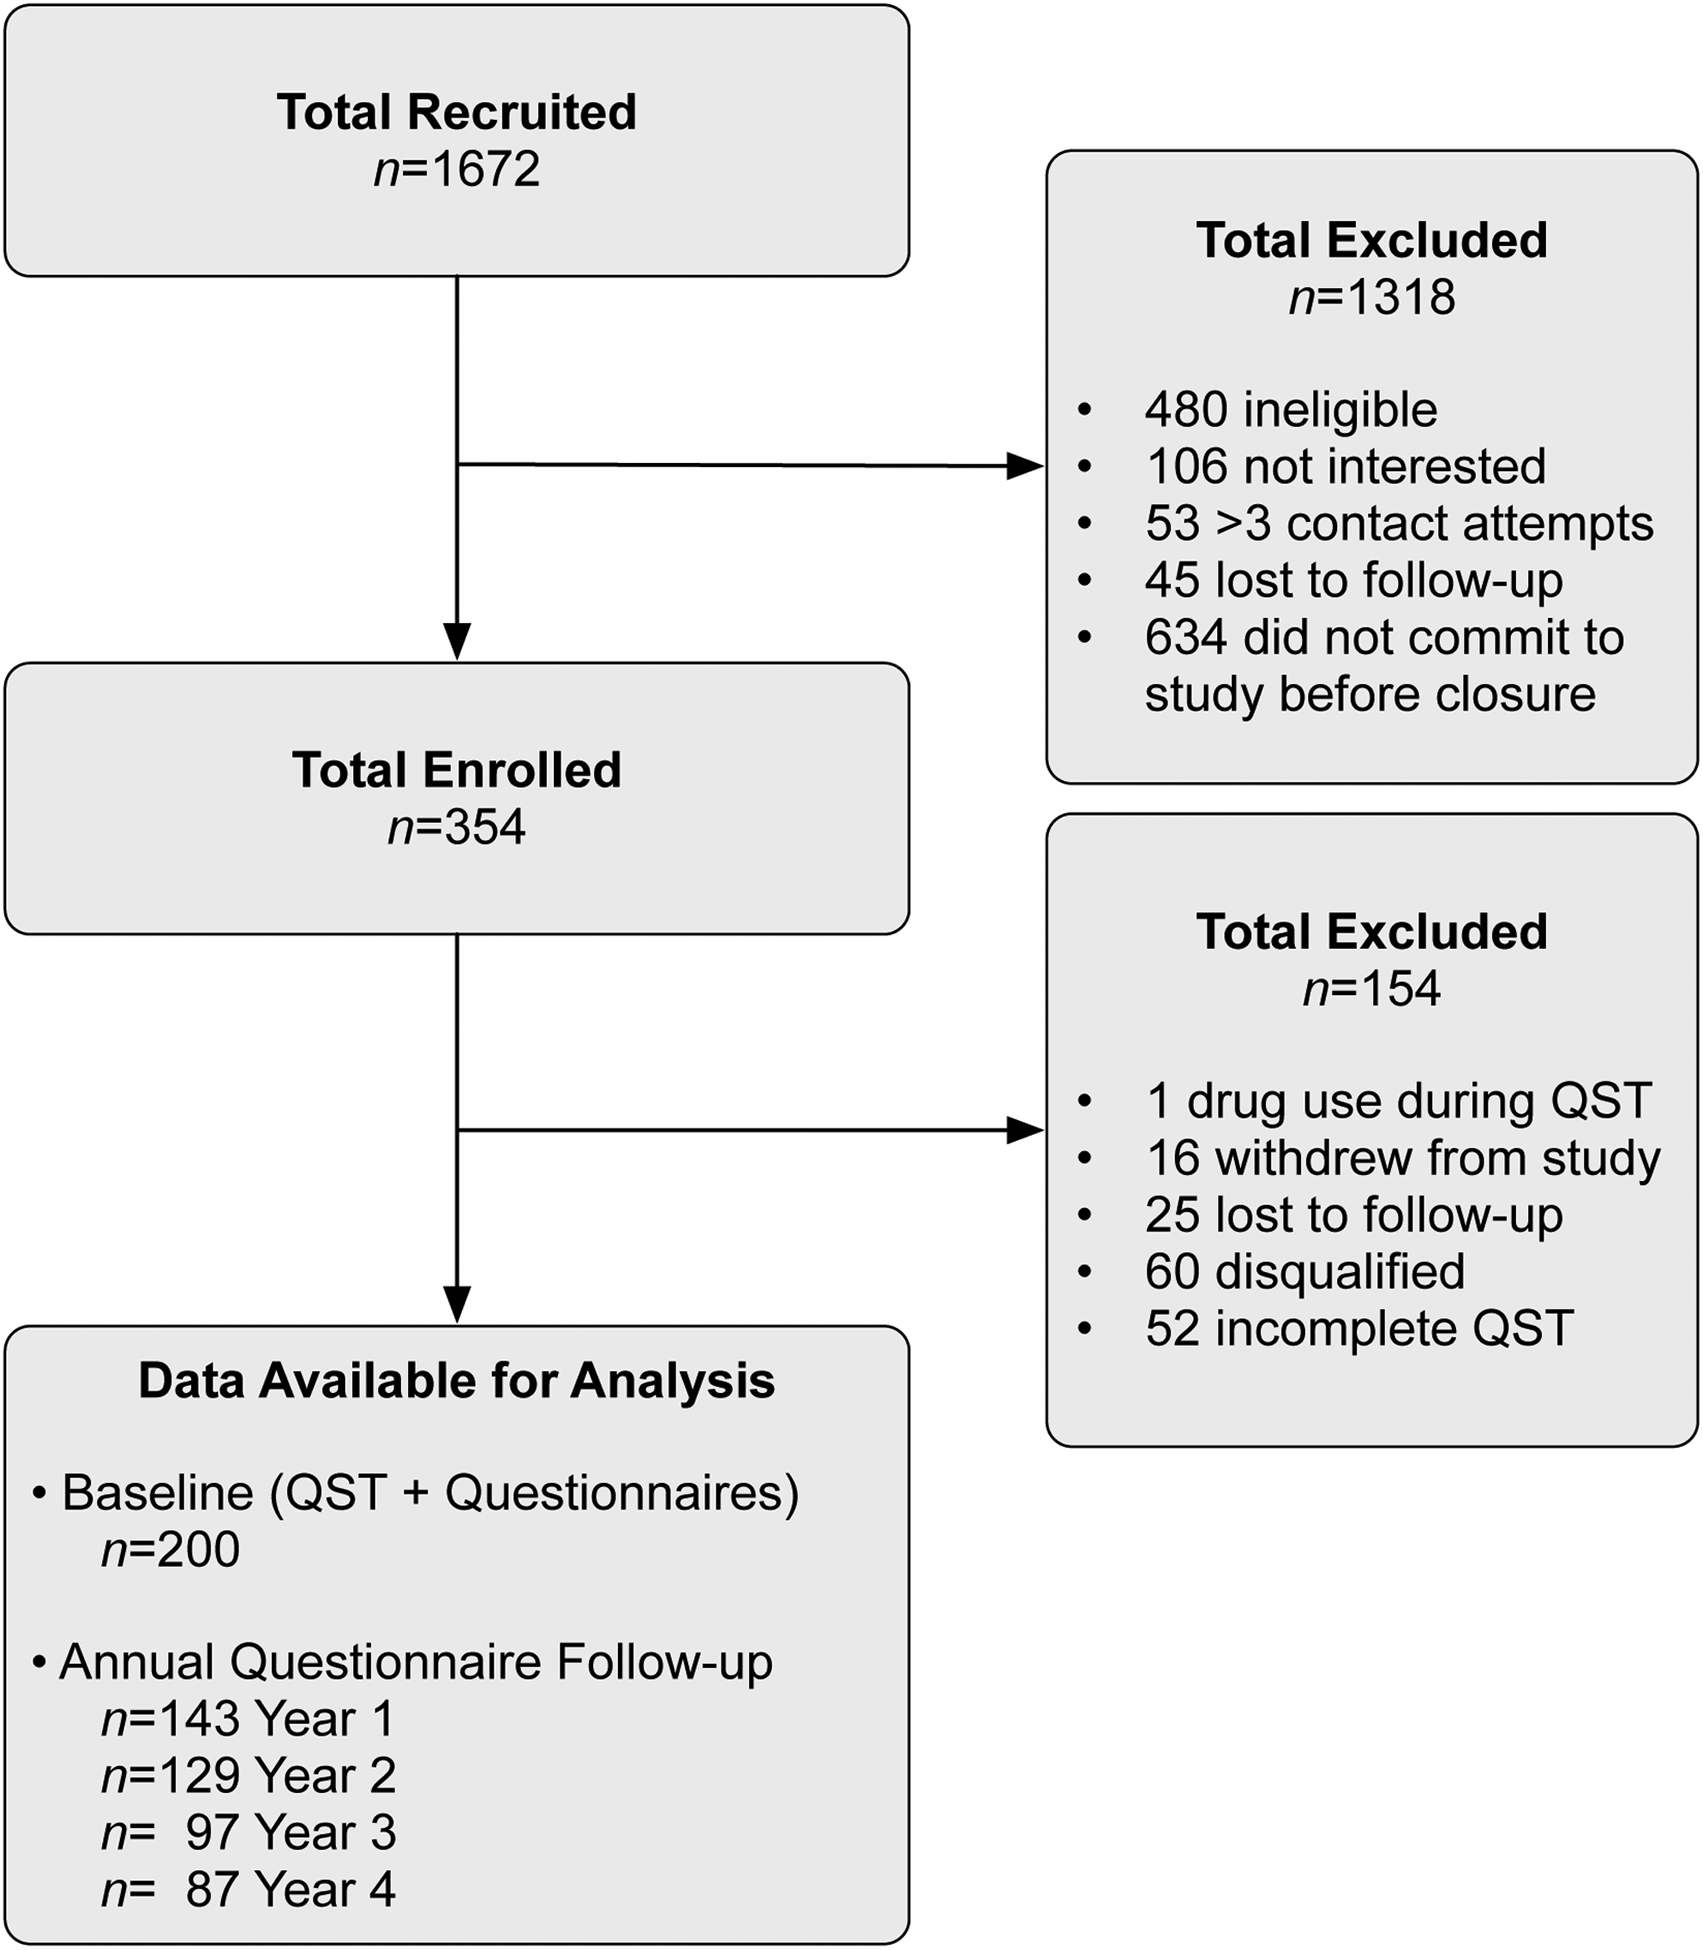
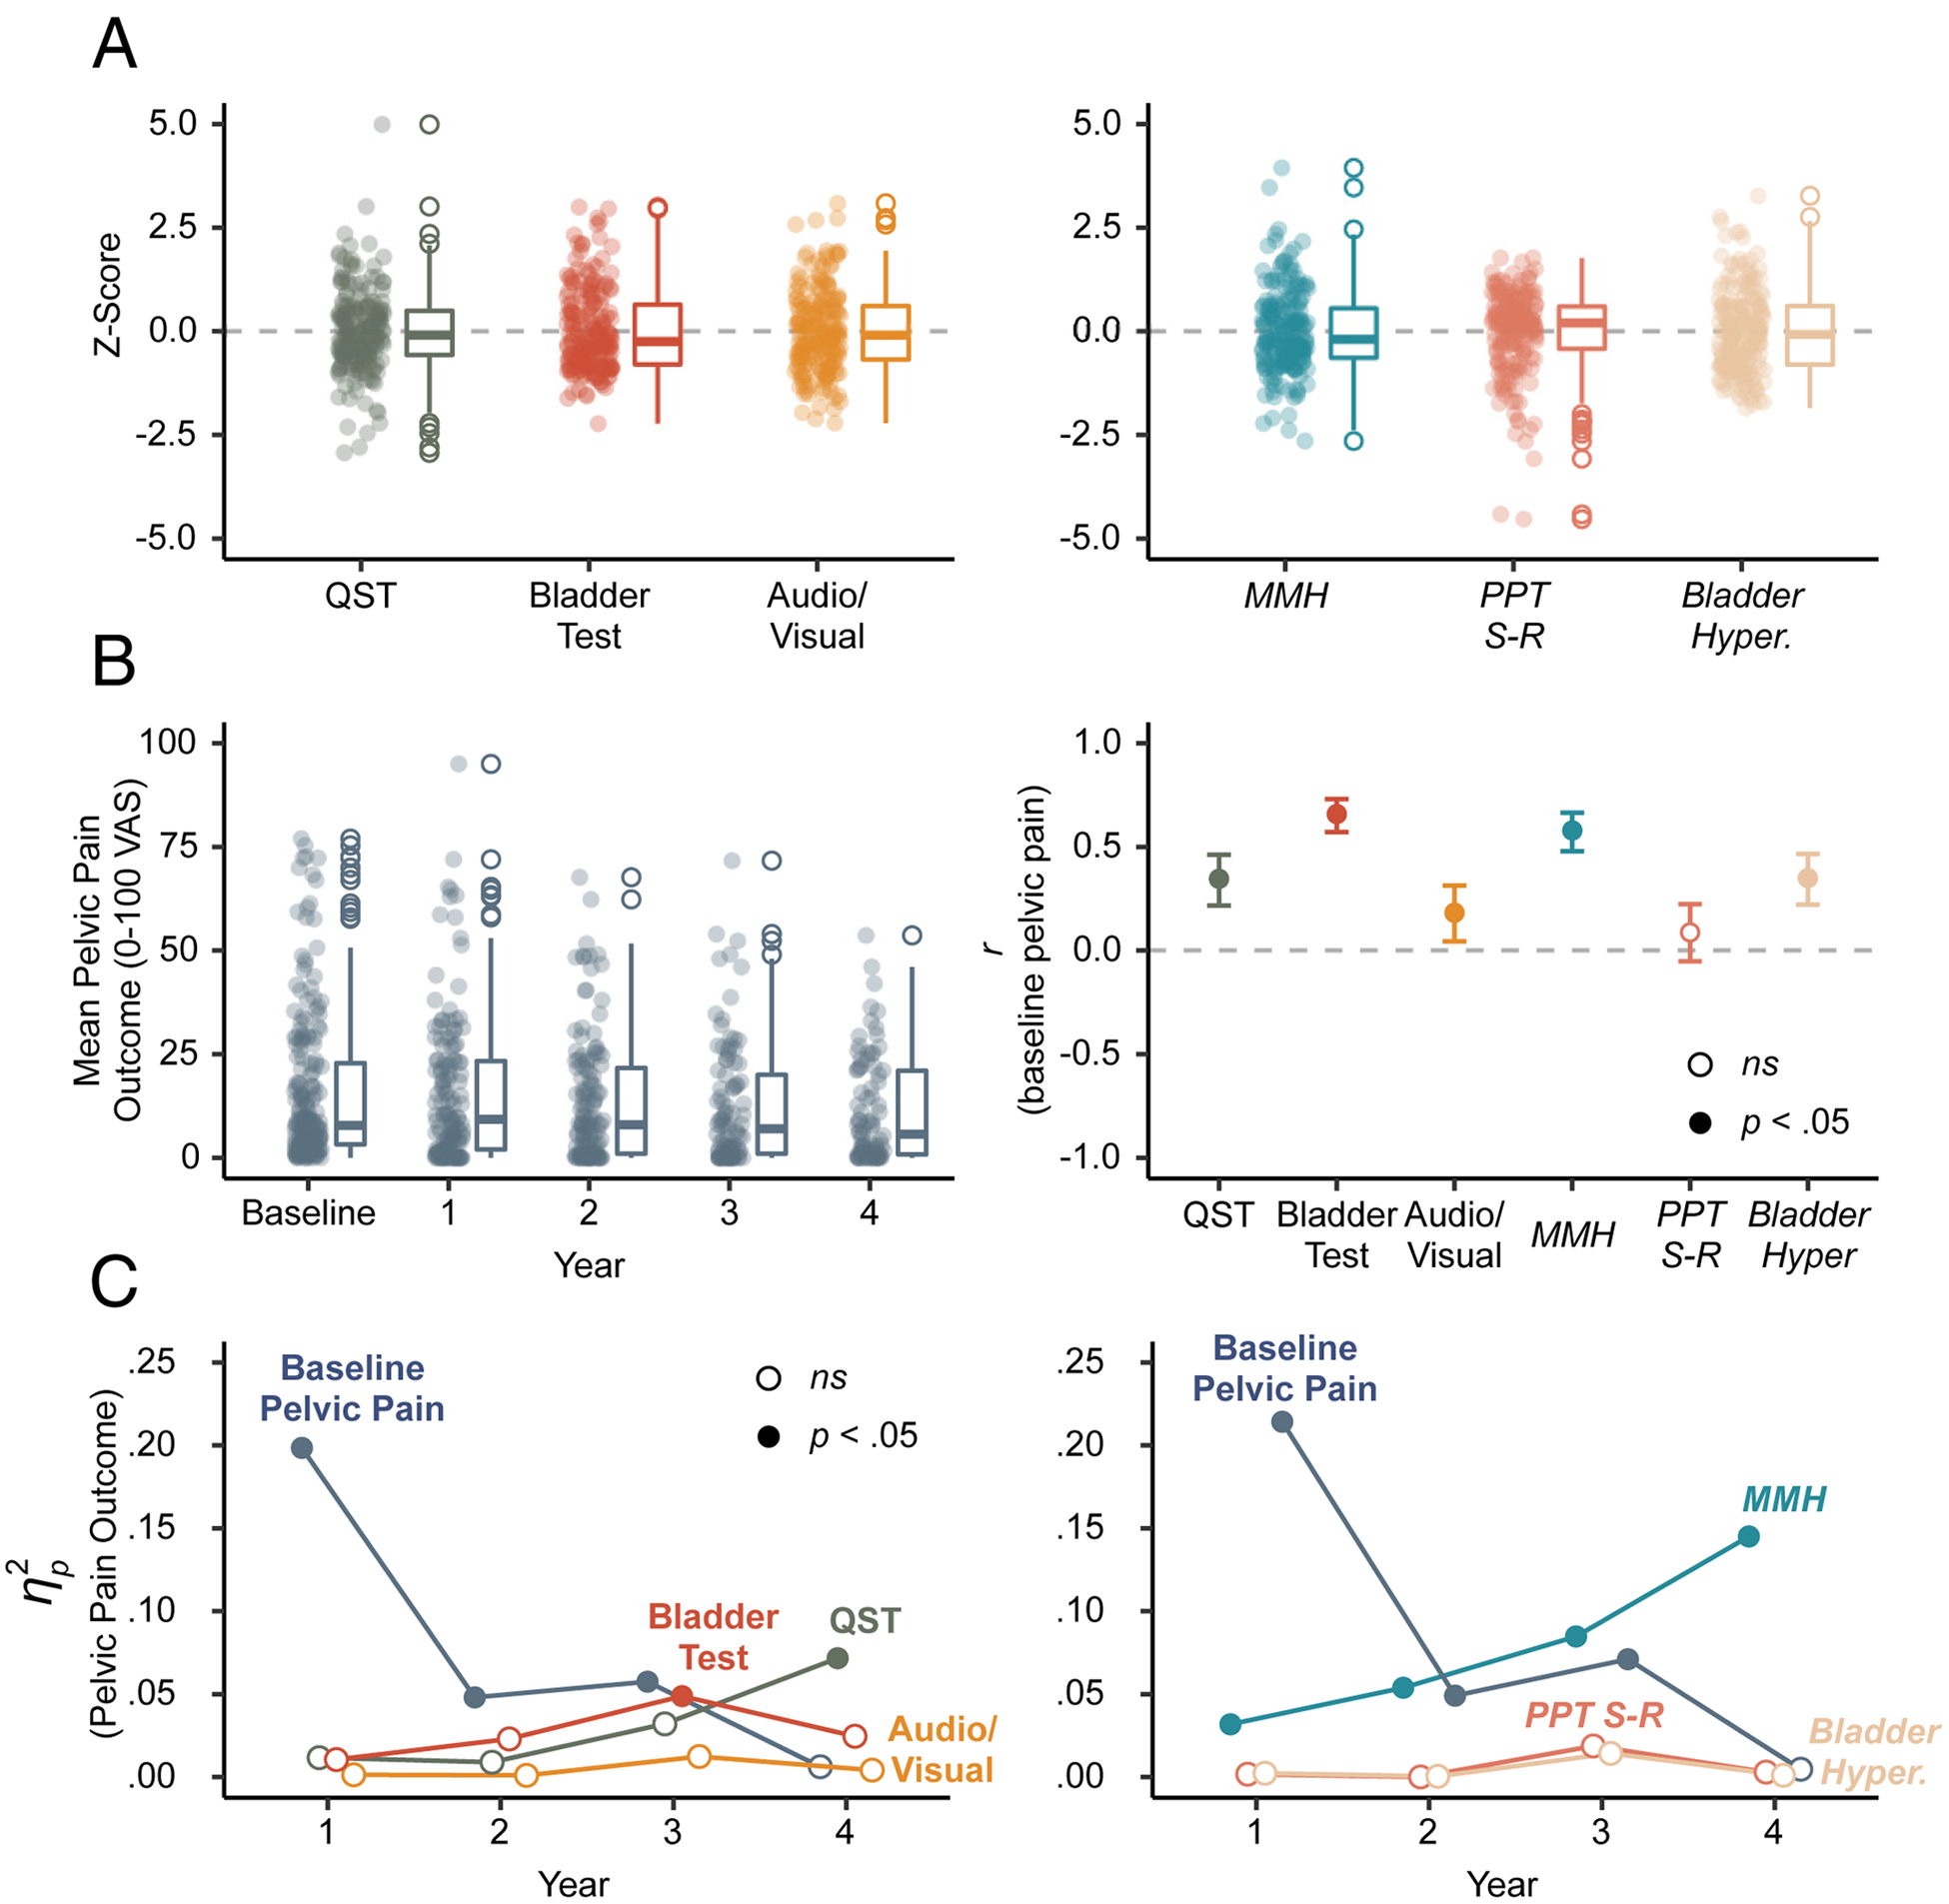
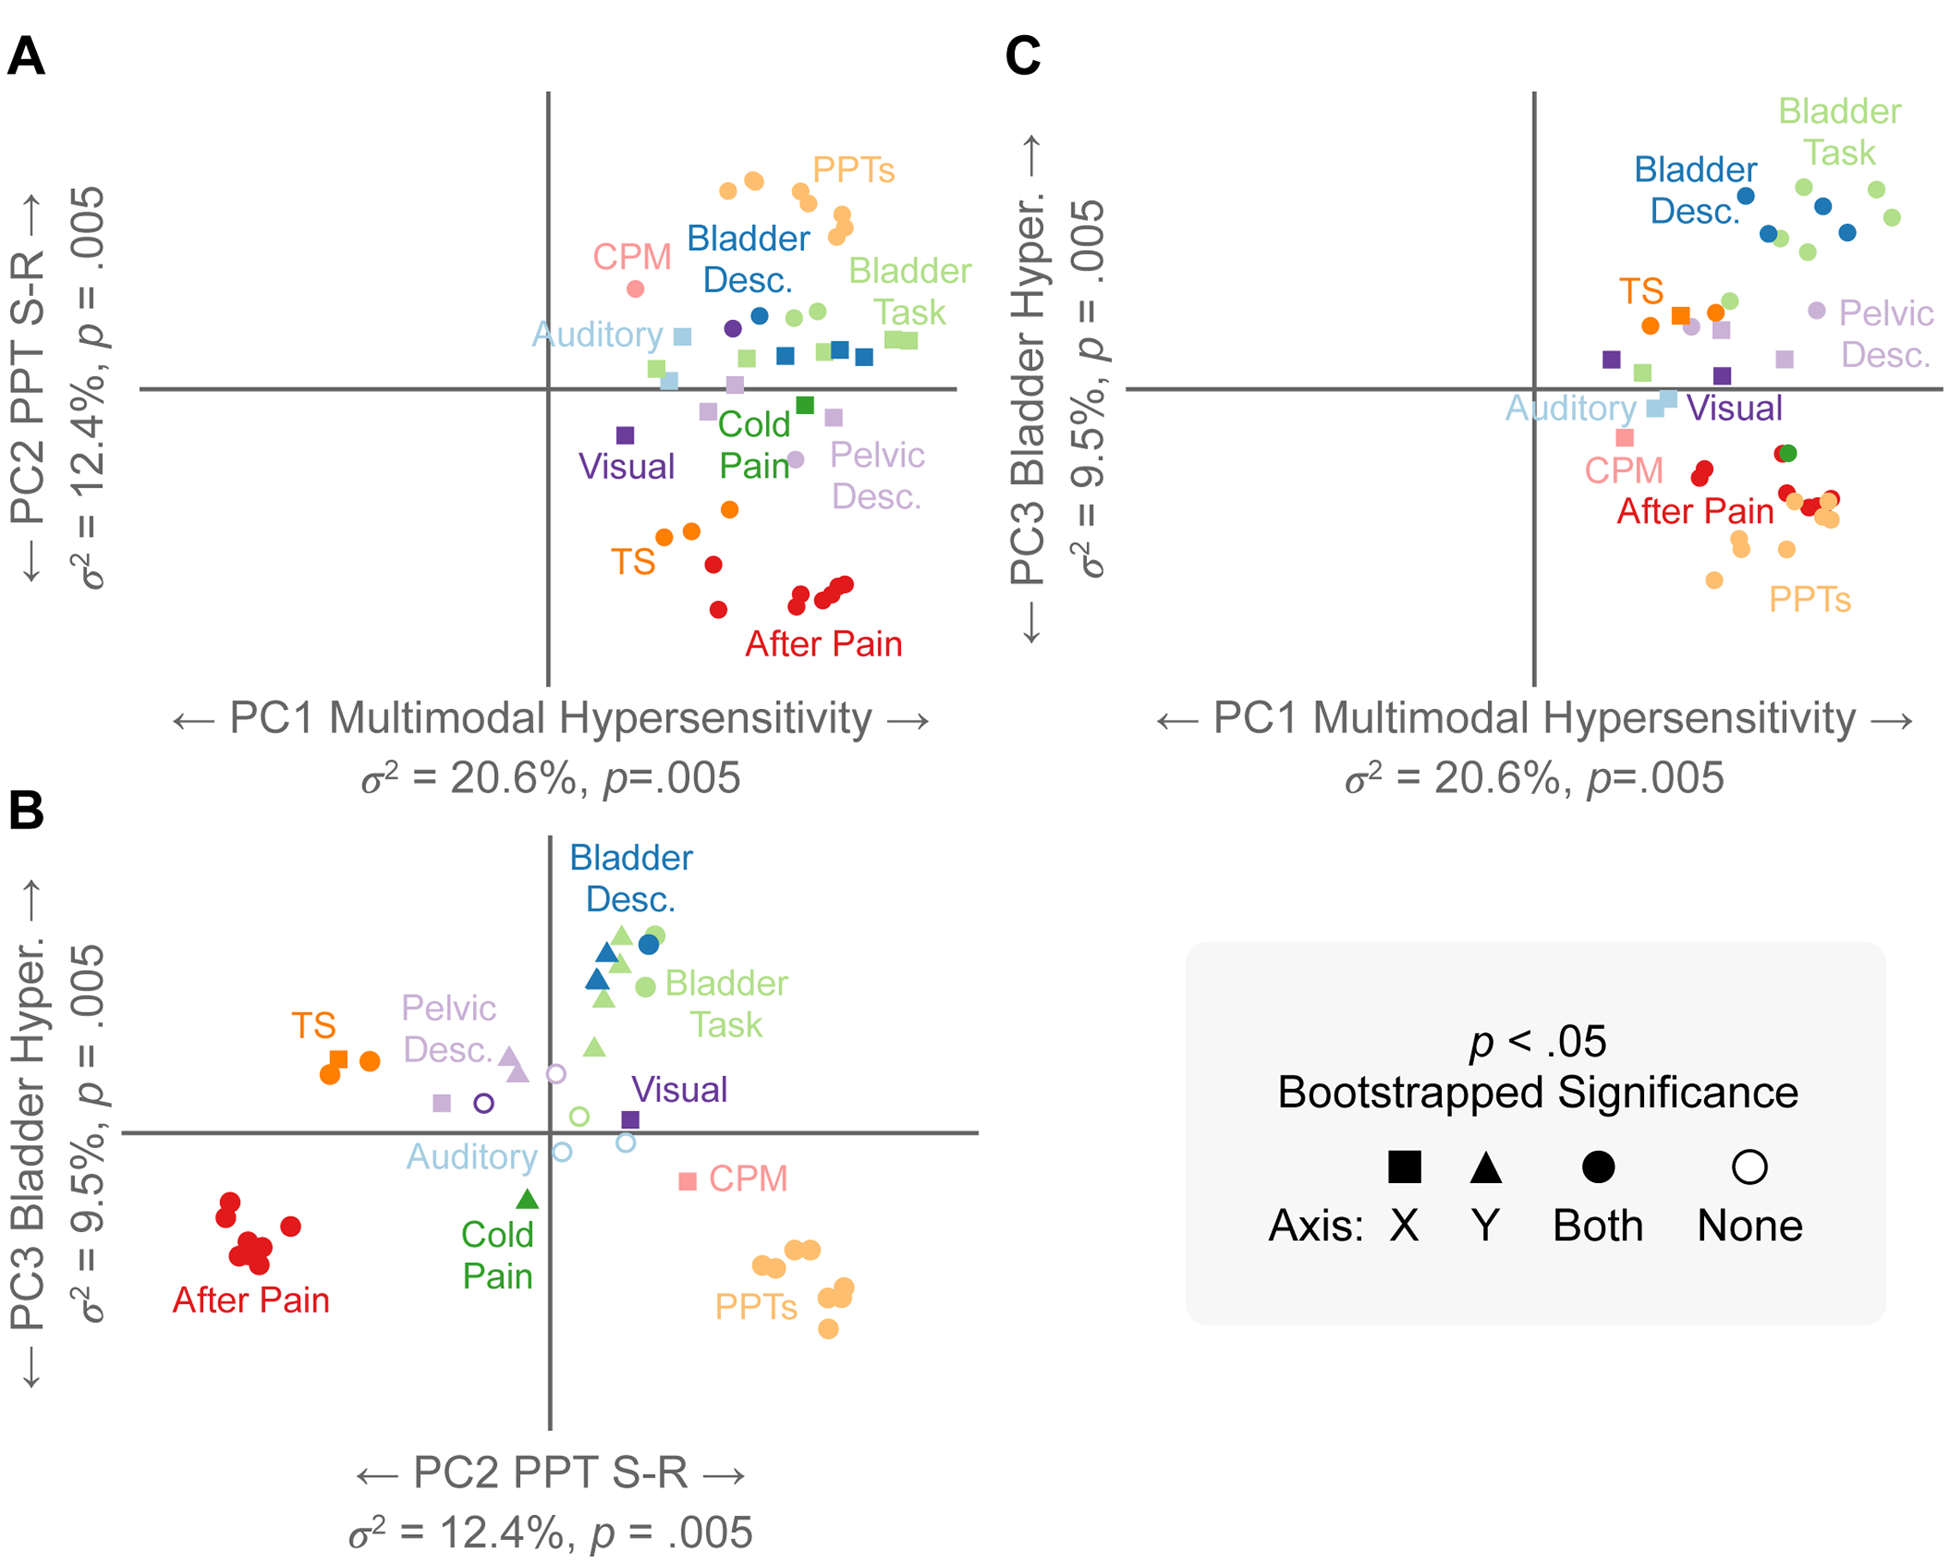
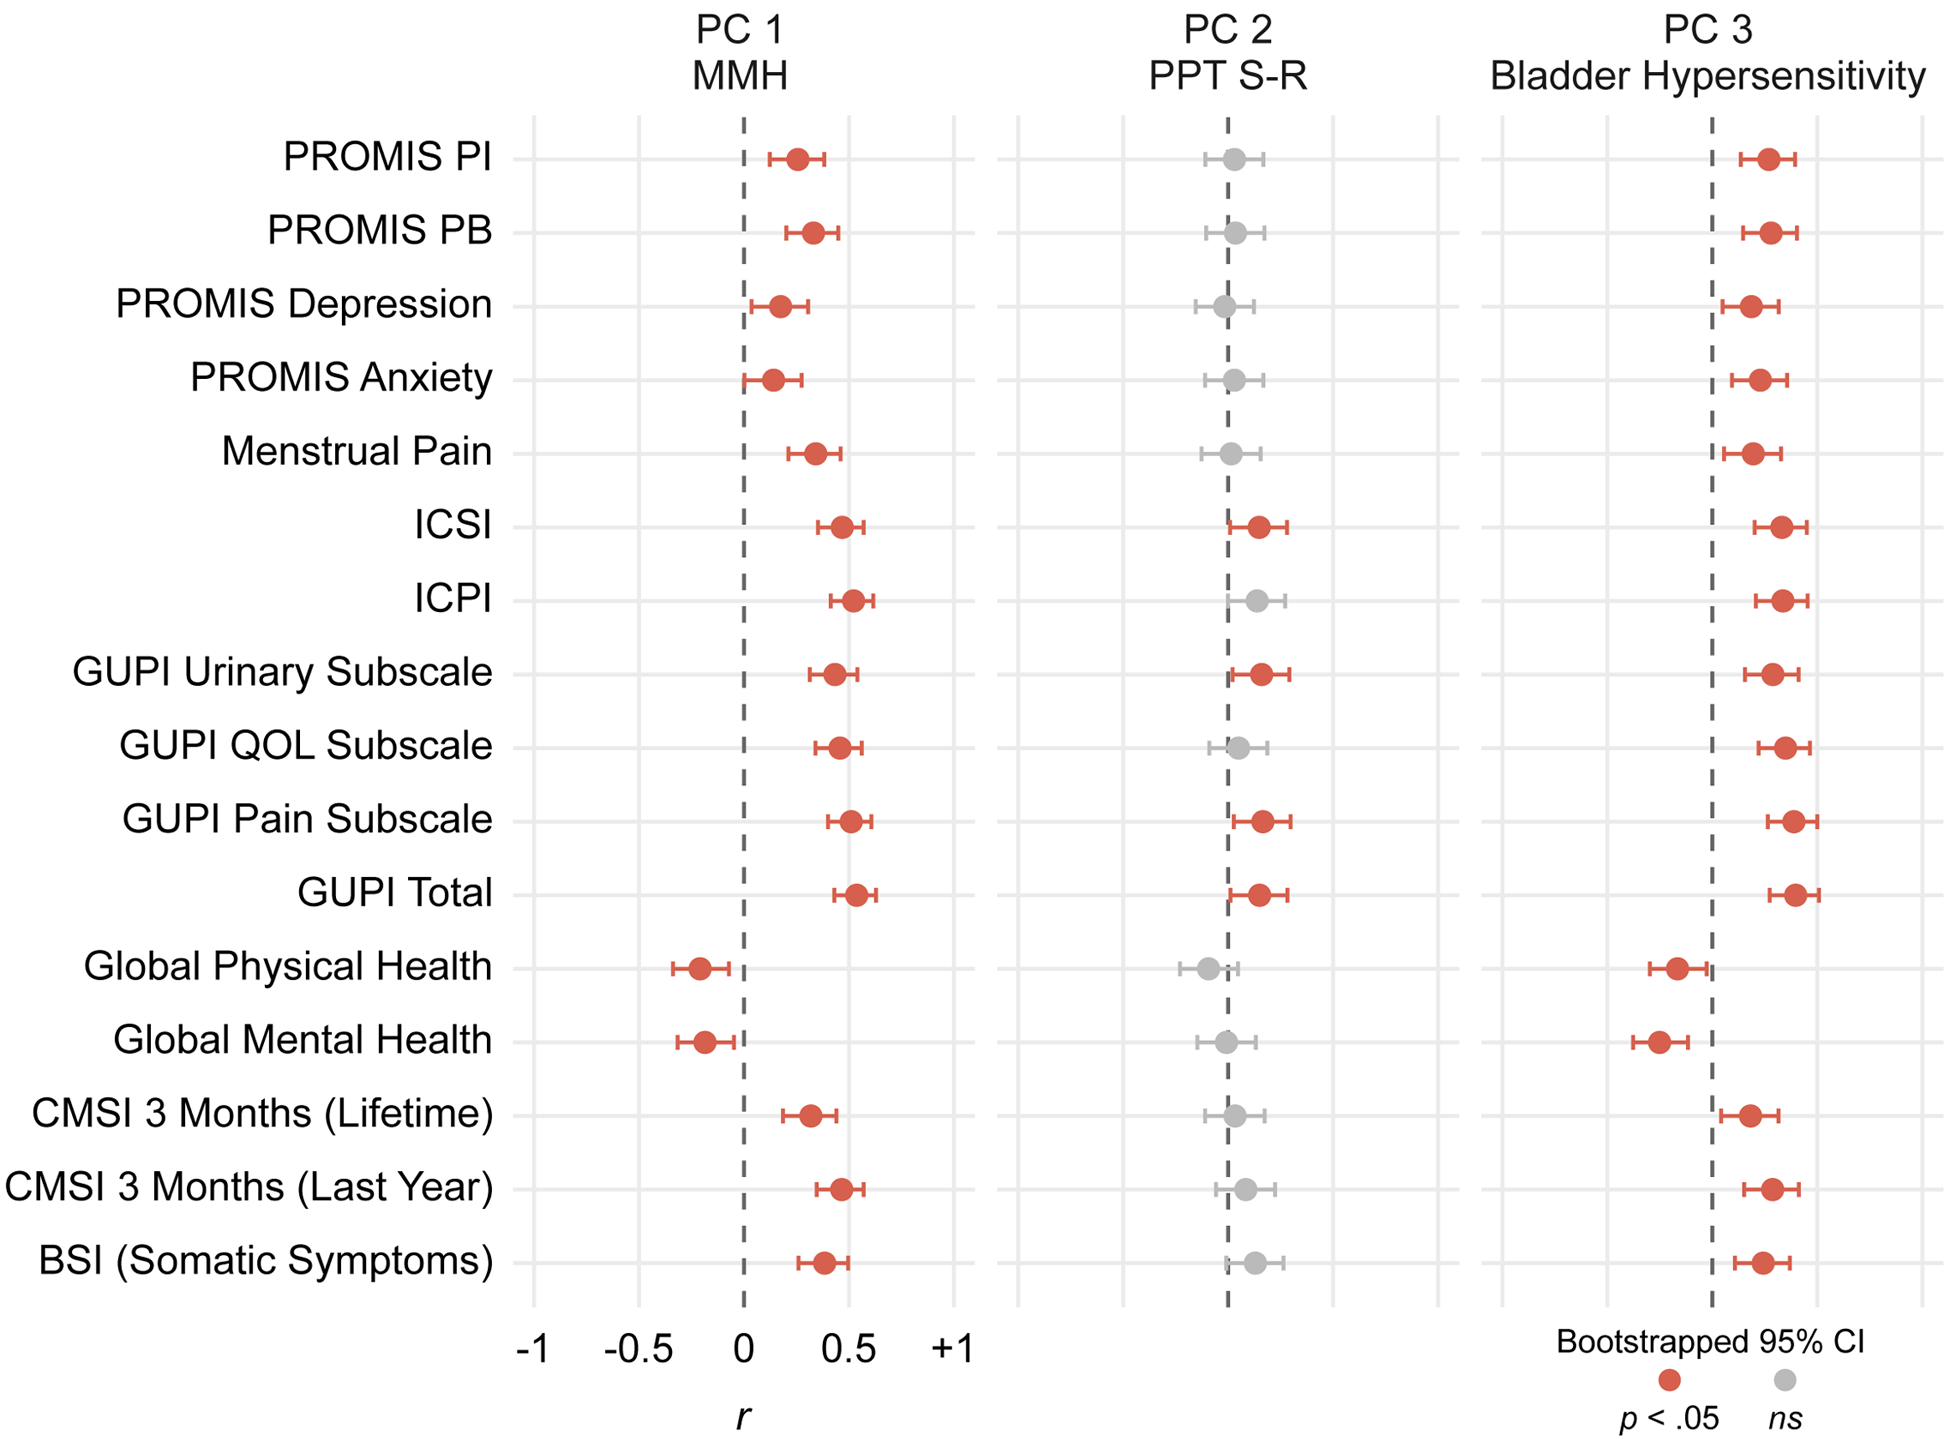
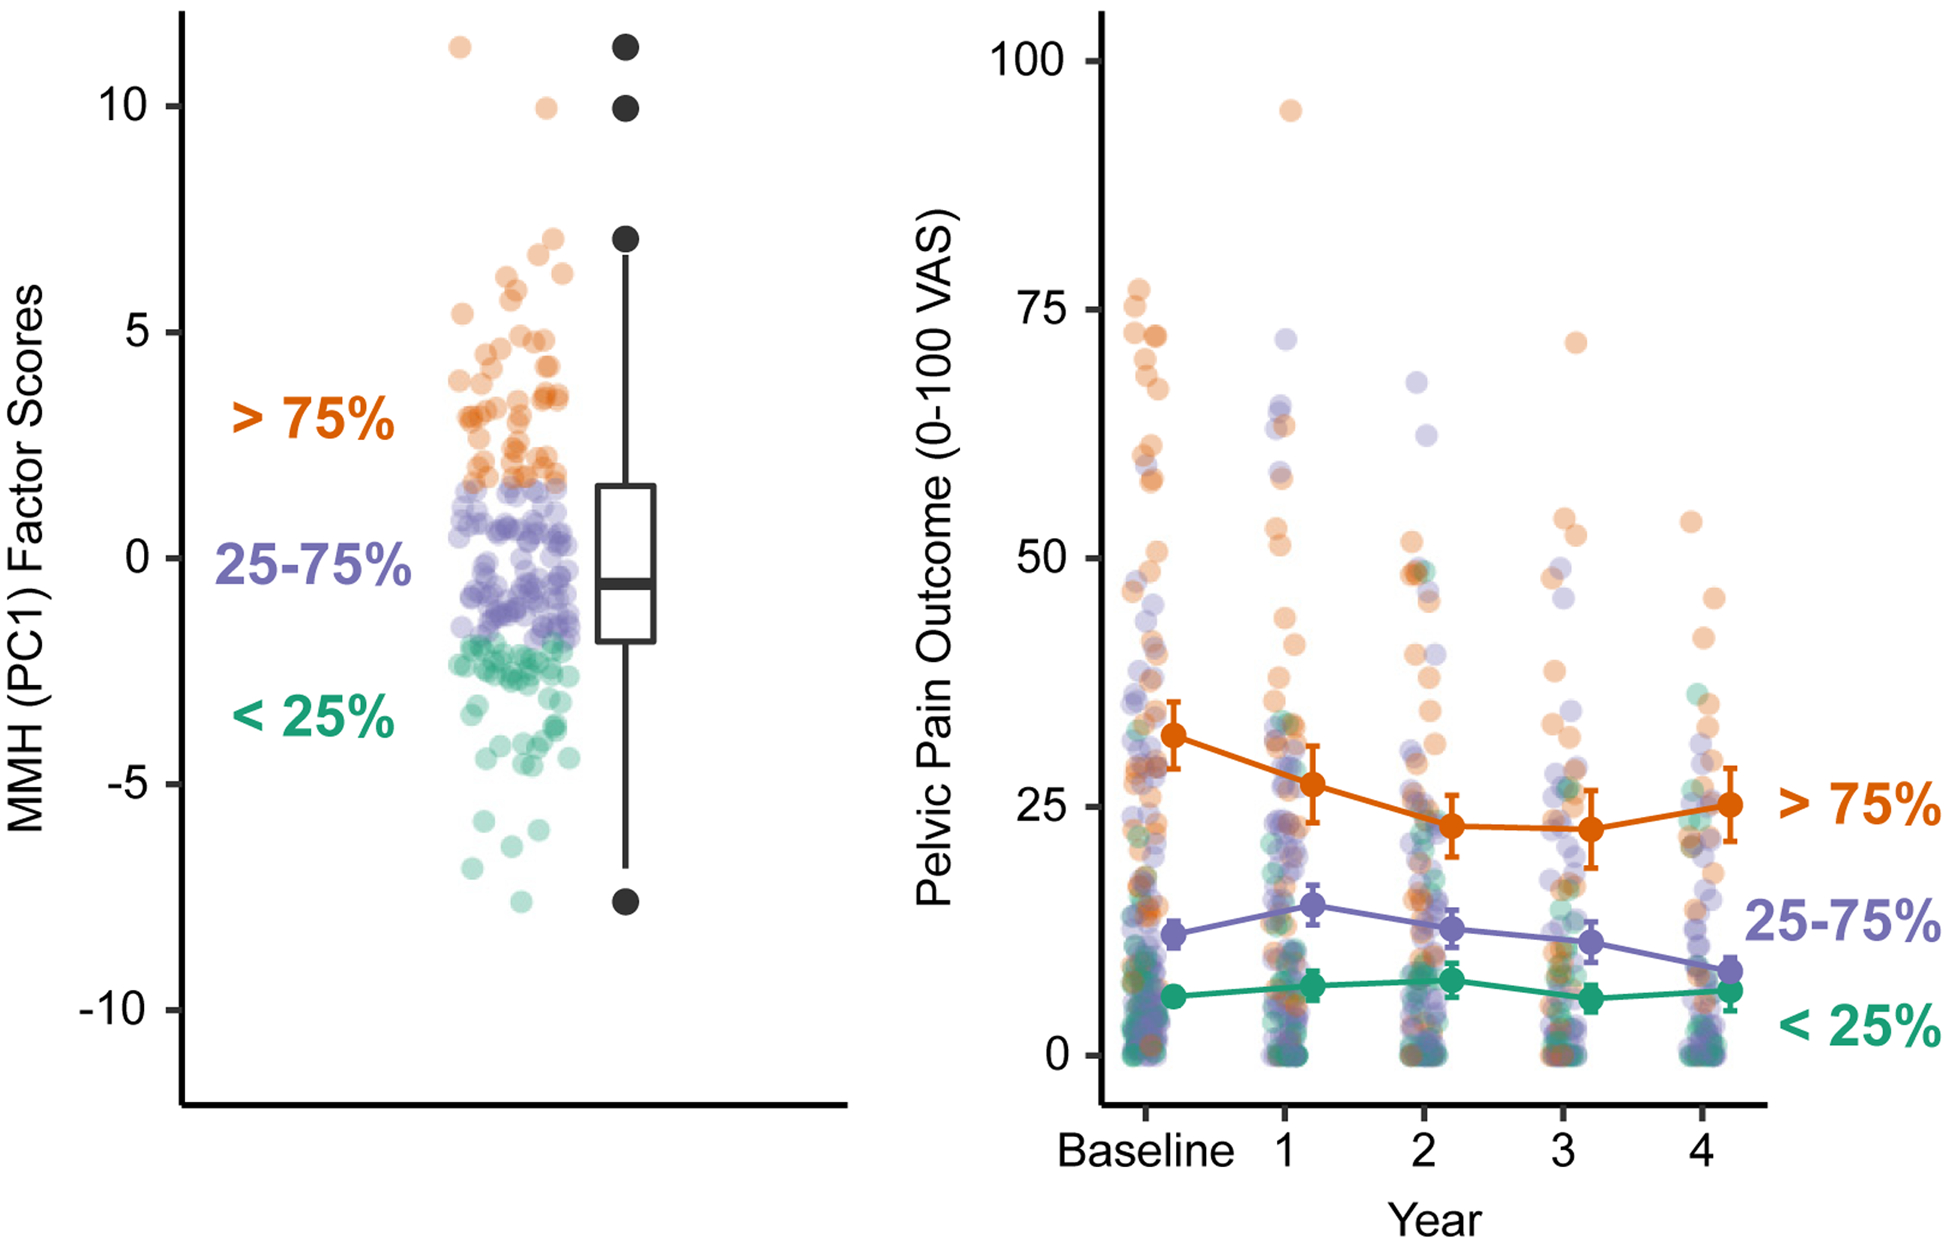
Multimodal hypersensitivity (MMH)-greater sensitivity across multiple sensory modalities (eg, light, sound, temperature, pressure)-is associated with the development of chronic pain. However, previous MMH studies are restricted given their reliance on self-reported questionnaires, narrow use of multimodal sensory testing, or limited follow-up. We conducted multimodal sensory testing on an observational cohort of 200 reproductive-aged women, including those at elevated risk for chronic pelvic pain conditions and pain-free controls. Multimodal sensory testing included visual, auditory, and bodily pressure, pelvic pressure, thermal, and bladder pain testing. Self-reported pelvic pain was examined over 4 years. A principal component analysis of sensory testing measures resulted in 3 orthogonal factors that explained 43% of the variance: MMH, pressure pain stimulus response, and bladder hypersensitivity. The MMH and bladder hypersensitivity factors correlated with baseline self-reported menstrual pain, genitourinary symptoms, depression, anxiety, and health. Over time, MMH increasingly predicted pelvic pain and was the only component to predict outcome 4 years later, even when adjusted for baseline pelvic pain. Multimodal hypersensitivity was a better predictor of pelvic pain outcome than a questionnaire-based assessment of generalized sensory sensitivity. These results suggest that MMHs overarching neural mechanisms convey more substantial long-term risk for pelvic pain than variation in individual sensory modalities. Further research on the modifiability of MMH could inform future treatment developments in chronic pain.

Trial registration: ClinicalTrials.gov NCT02214550.


Figures

Figure 1.
Figure 1.
Participant Recruitment and Enrollment Flowchart for CRAMPP.
Figure 2.
Figure 2.. MMH provides better prediction of future pelvic pain.
A) Box plots of Z-scores for each sensory testing composite variable (left) and principal component (PC) used for regression modeling (right). B) Box plots of pelvic pain outcome across the baseline visit and annual questionnaires (left); Correlations between baseline pelvic pain and predictors (i.e., sensory testing composites and PCs). Error bars are 95% confidence intervals and all correlations were significant (filled circles) except PPT S-R (right). C) Explained variance (ηp2) of pelvic pain outcome for each sensory testing composite (left) and PC (right) accounting for baseline pelvic pain. Significant predictors (filled circles) include baseline pelvic pain, bladder test, QST, and MMH. Italicized text labels refer to PCs. QST=quantitative sensory testing; MMH=multimodal hypersensitivity; PPT-SR=pressure pain threshold stimulus-response (function); Hyper.=hypersensitivity; VAS=visual analog scale.
Figure 3.
Figure 3.. Factor Score Plots of Sensory Testing Variables.
Each measure’s position denotes its relative loading/correlation with the orthogonal principal components (PCs) plotted across the x-y coordinate plane. Measures in close proximity within an axis plane depict positive relationships (concomitant sensitivity across proximal measures). Measures that are distant appear on opposite sides of the origin and depict negative relationships within an axis plane. A bootstrapping procedure quantified loading significance for each measure on each PC depicted with shapes. A) Within the x-axis plane (PC1), all measures load positively onto PC1 and are proximal, indicating positive relationships across all measures with PC1. B) Within the x-axis plane (PC2), PPTs and after-pain measures are distant from each other and are located on opposite sides of the origin. This indicates a negative relationship between PPTs and after-pain measures (this can also be seen across the y-axis in A). Within the y-axis plane (PC3), measures from the bladder task positively load onto PC3 and are distant/oppose the PPTs and after-pain measures. C) Loading patterns of PC1 (x-axis) and PC3 (y-axis). Bladder Task = pain and urgency measurements; Bladder Desc.= Bladder descriptors of Dull/Pressing/Prickling/Sharp pain; PC=Principal Component; PPTs=Pressure Pain Thresholds; CPM=Conditioned Pain Modulation; TS=Temporal Summation.
Figure 4.
Figure 4.. Correlations Between Principal Components (PCs) and Self-Report Questionnaires.
Each point depicts a Pearson’s pairwise correlation between the participants’ factor scores across the three PCs of interest and their responses to a self-report questionnaire. Error bars denote bootstrapped 95% confidence intervals; therefore, intervals crossing zero indicate non-significant correlations and are colored grey. Except for global mental/physical health, greater scores on self-report questionnaires denote worse symptoms/outcome. All MMH and bladder hypersensitivity correlations were significant and in the expected direction: greater hypersensitivity was associated with worse affective symptoms, somatic symptoms, genitourinary pain, menstrual pain, and overall pain and health. PROMIS=Patient Reported Outcomes Measurement Information System; PI=Pain Interference; PB=Pain Behavior; ICSI=Interstitial Cystitis Symptom Index; ICPI= Interstitial Cystitis Problem Index; GUPI=Genitourinary Pain Index; QOL=Quality of Life; CMSI=Complex Medical Symptoms Inventory; BSI=Brief Symptom Inventory.
Figure 5.
Figure 5.. MMH (PC1) Outer-Quartile Participants Demonstrate Different Pelvic Pain Trajectories.
Participants were first differentiated based on whether they are inside or outside the inter-quartile range for baseline MMH (PC1) factor loadings (left). Participants with MMH (PC1) factor scores > 75% of the sample demonstrated worse pelvic pain outcome at baseline that persisted across the four-year follow-up period (right). Error bars are the standard error of the mean.

Similar articles

Cited by

References

    1. Abdi H Singular Value Decomposition (SVD) and Generalized Singular Value Decomposition (GSVD). Thousand Oaks, CA: Sage, 2007.
    1. Abdi H, Williams LJ. Principal component analysis. WIREs Comp Stat 2010;2:433–459.
    1. Andersson HI. The course of non-malignant chronic pain: a 12-year follow-up of a cohort from the general population. European Journal of Pain 2004;8:47–53. - PubMed
    1. Apkarian AV, Bushnell MC, Treede R-D, Zubieta J-K. Human brain mechanisms of pain perception and regulation in health and disease. European Journal of Pain 2005;9:463–463. - PubMed
    1. Arendt-Nielsen L Mechanistic similarities between fibromyalgia and other chronic pain conditions. PAIN Reports 2017;2:3.

Publication types

Associated data