

Lipomatous Metaplasia Facilitates Slow Conduction in Critical Ventricular Tachycardia Corridors Within Postinfarct Myocardium
- PMID: 37227343
- PMCID: PMC11168467
- DOI: 10.1016/j.jacep.2023.02.014
Lipomatous Metaplasia Facilitates Slow Conduction in Critical Ventricular Tachycardia Corridors Within Postinfarct Myocardium
Abstract
Background: Myocardial lipomatous metaplasia (LM) has been reported to be associated with post-infarct ventricular tachycardia (VT) circuitry.
Objectives: This study examined the association of scar versus LM composition with impulse conduction velocity (CV) in putative VT corridors that traverse the infarct zone in post-infarct patients.
Methods: The cohort included 31 post-infarct patients from the prospective INFINITY (Intra-Myocardial Fat Deposition and Ventricular Tachycardia in Cardiomyopathy) study. Myocardial scar, border zone, and potential viable corridors were defined by late gadolinium enhancement cardiac magnetic resonance (LGE-CMR), and LM was defined by computed tomography. Images were registered to electroanatomic maps, and the CV at each electroanatomic map point was calculated as the mean CV between that point and 5 adjacent points along the activation wave front.
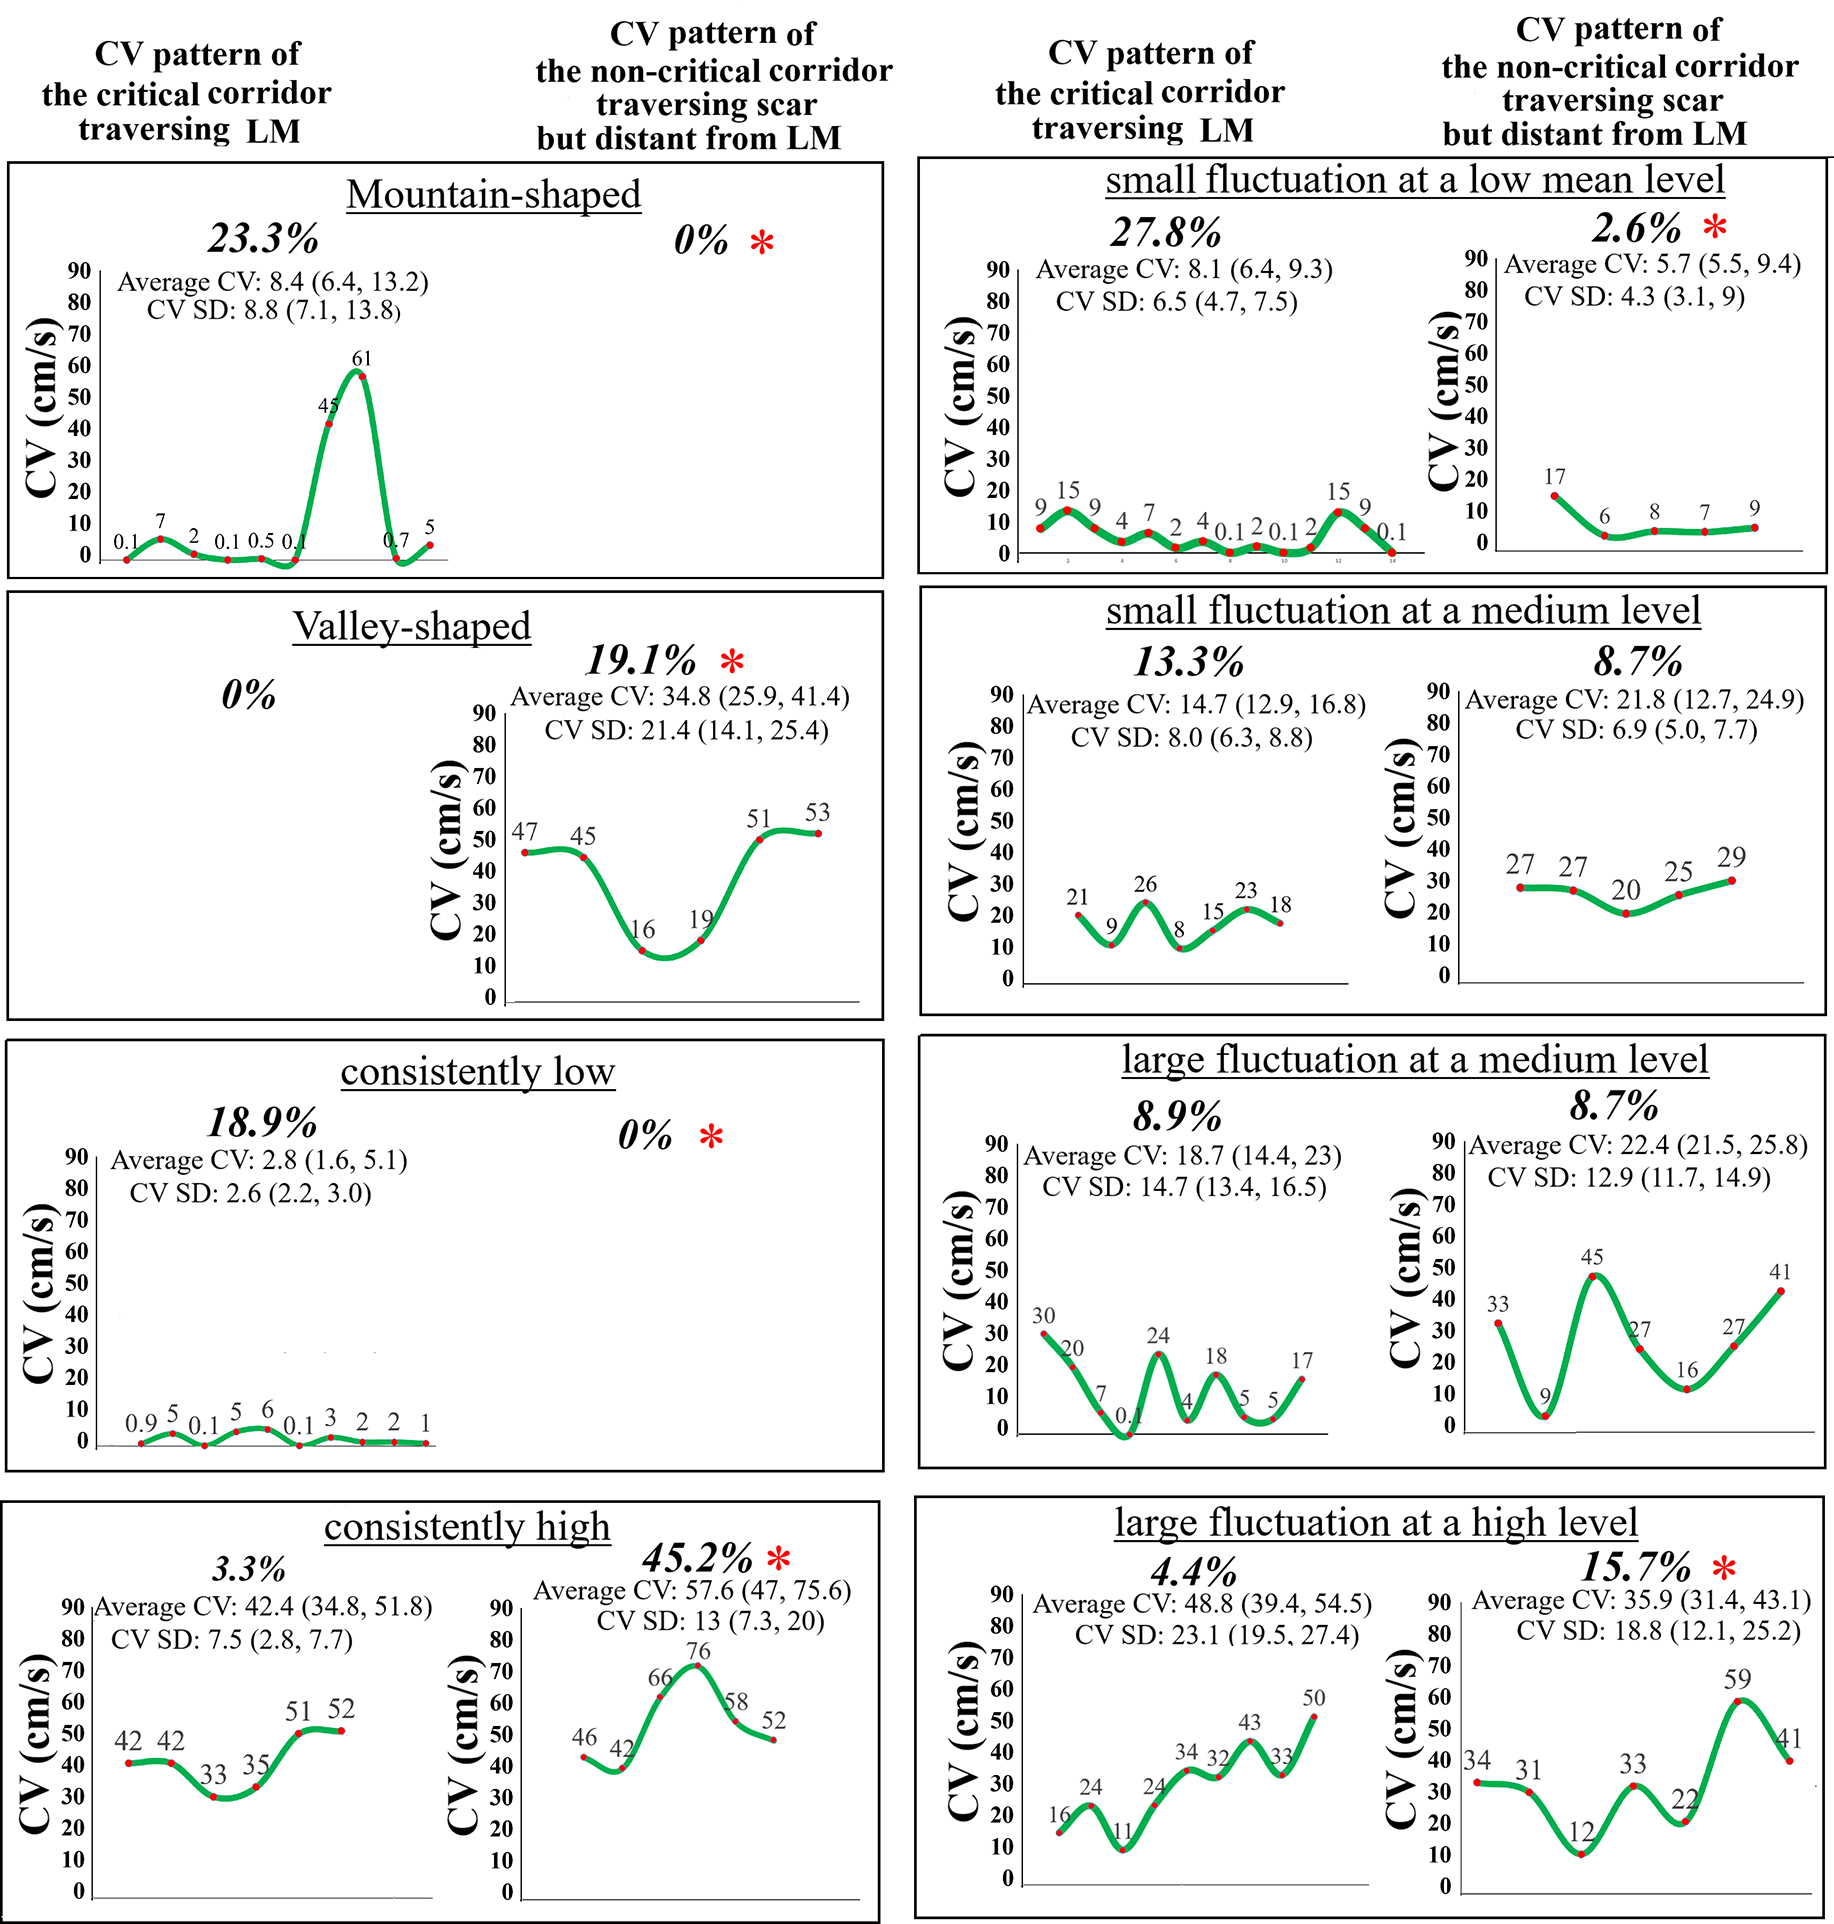
Results: Regions with LM exhibited lower CV than scar (median = 11.9 vs 13.5 cm/s; P < 0.001). Of 94 corridors computed from LGE-CMR and electrophysiologically confirmed to participate in VT circuitry, 93 traversed through or near LM. These critical corridors displayed slower CV (median 8.8 [IQR: 5.9-15.7] cm/s vs 39.2 [IQR: 28.1-58.5]) cm/s; P < 0.001) than 115 noncritical corridors distant from LM. Additionally, critical corridors demonstrated low-peripheral, high-center (mountain shaped, 23.3%) or mean low-level (46.7%) CV patterns compared with 115 noncritical corridors distant from LM that displayed high-peripheral, low-center (valley shaped, 19.1%) or mean high-level (60.9%) CV patterns.
Conclusions: The association of myocardial LM with VT circuitry is at least partially mediated by slowing nearby corridor CV thus facilitating an excitable gap that enables circuit re-entry.
Keywords: conduction velocity; ischemic cardiomyopathy; lipomatous metaplasia; myocardial infarction; ventricular tachycardia.
Copyright © 2023 American College of Cardiology Foundation. Published by Elsevier Inc. All rights reserved.
Conflict of interest statement
Funding Support and Author Disclosures The INFINITY study is funded by the National Institute of Health grant 1R01HL142893-01. The authors received support from support from ADAS Software and from the Mark Marchlinski Electrophysiology Research and Education Fund. Dr Xu is funded by an American Heart Association postdoctoral fellowship. The University of Pennsylvania Conflict of Interest Committee manages all commercial arrangements. Dr Nazarian is a consultant for CardioSolv and Circle CVI; and is a principal investigator for research funding from Biosense Webster, ImriCor, Siemens, ADAS software, and the U.S. National Institutes of Health. Dr Marchlinski has served as consultant for Abbott Medical, Biosense Webster, Biotronik, and Medtronic Inc. All other authors have reported that they have no relationships relevant to the contents of this paper to disclose.
Figures


Comment in
-
Scar, Fat, and Fibrosis: Rethinking Re-Entry.JACC Clin Electrophysiol. 2023 Aug;9(8 Pt 1):1246-1247. doi: 10.1016/j.jacep.2023.06.007. JACC Clin Electrophysiol. 2023. PMID: 37558286 No abstract available.
References
-
- Chang PC, Wo HT, Lee HL et al. Sacubitril/Valsartan Therapy Ameliorates Ventricular Tachyarrhythmia Inducibility in a Rabbit Myocardial Infarction Model. J Card Fail 2020;26:527–537. - PubMed
-
- Debakker JMT, Vancapelle FJL, Janse MJ et al. Reentry as a Cause of Ventricular-Tachycardia in Patients with Chronic Ischemic Heart-Disease - Electrophysiologic and Anatomic Correlation. Circulation 1988;77:589–606. - PubMed
-
- Pouliopoulos J, Chik WW, Kanthan A et al. Intramyocardial adiposity after myocardial infarction: new implications of a substrate for ventricular tachycardia. Circulation 2013;128:2296–308. - PubMed
Publication types
MeSH terms
Substances
Grants and funding
LinkOut - more resources
Full Text Sources
Medical
Miscellaneous
