. 2023 Aug;9(8 Pt 1):1248-1261.
doi: 10.1016/j.jacep.2023.03.009. Epub 2023 May 24.

Functional Epicardial Conduction Disturbances Due to a SCN5A Variant Associated With Brugada Syndrome

Affiliations

Functional Epicardial Conduction Disturbances Due to a SCN5A Variant Associated With Brugada Syndrome

Estelle Renard et al. JACC Clin Electrophysiol. 2023 Aug.

Abstract

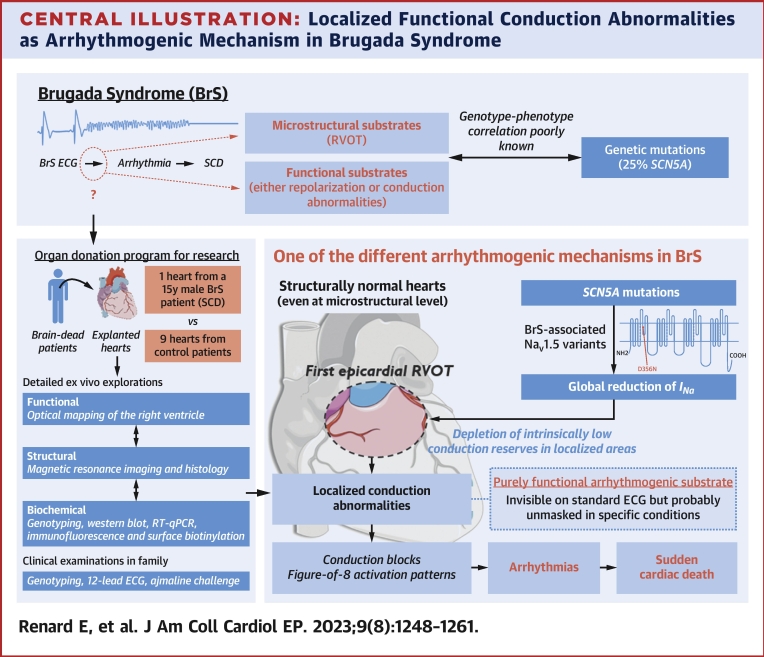
Background: Brugada syndrome is a significant cause of sudden cardiac death (SCD), but the underlying mechanisms remain hypothetical.

Objectives: This study aimed to elucidate this knowledge gap through detailed ex vivo human heart studies.

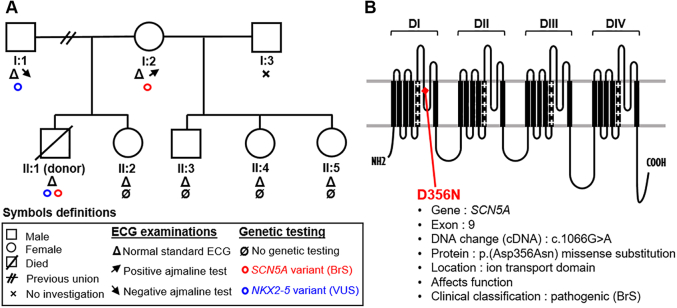
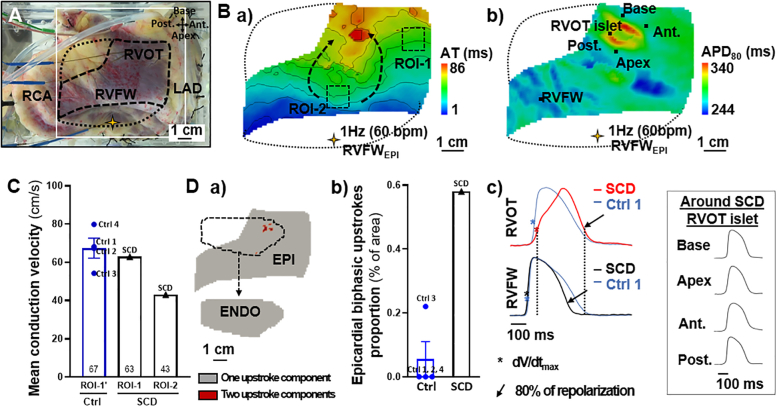
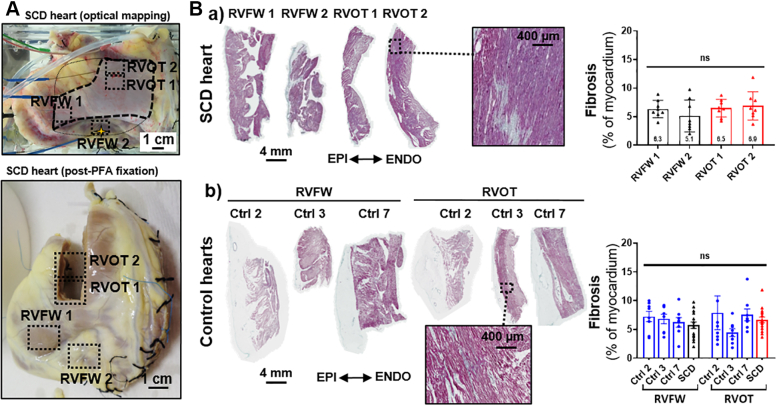
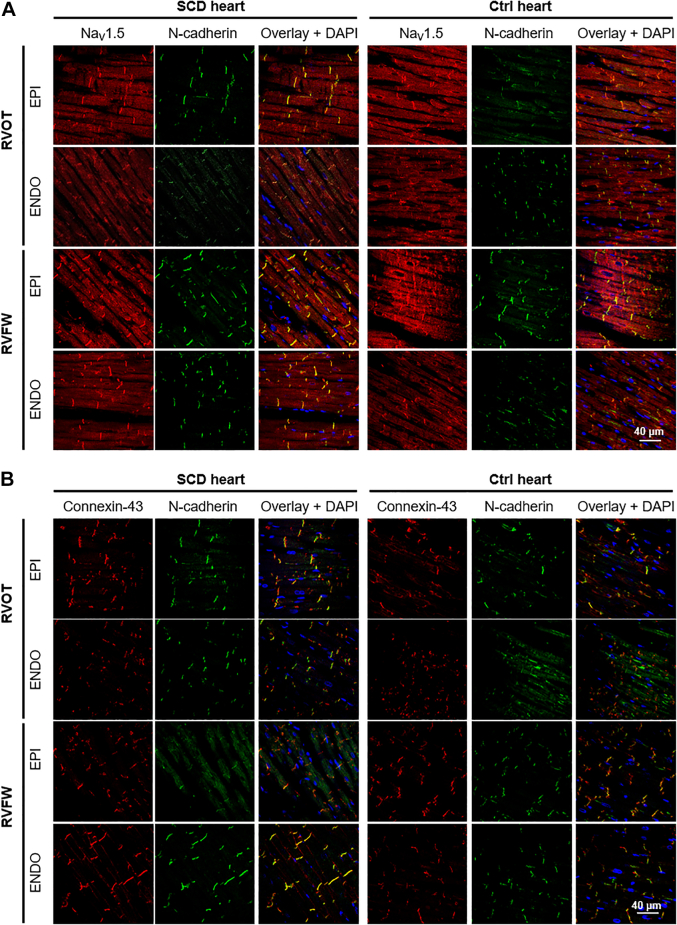
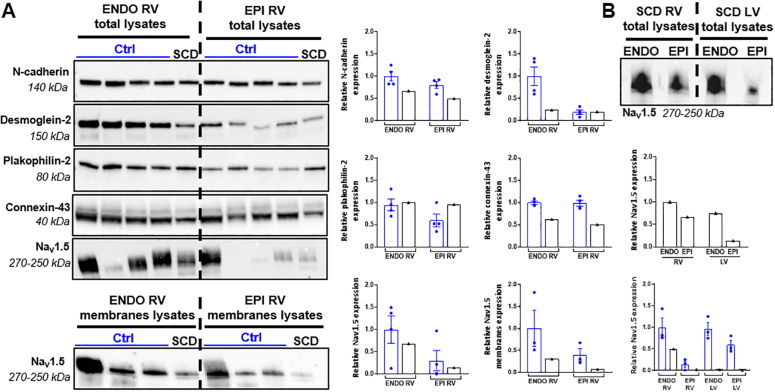
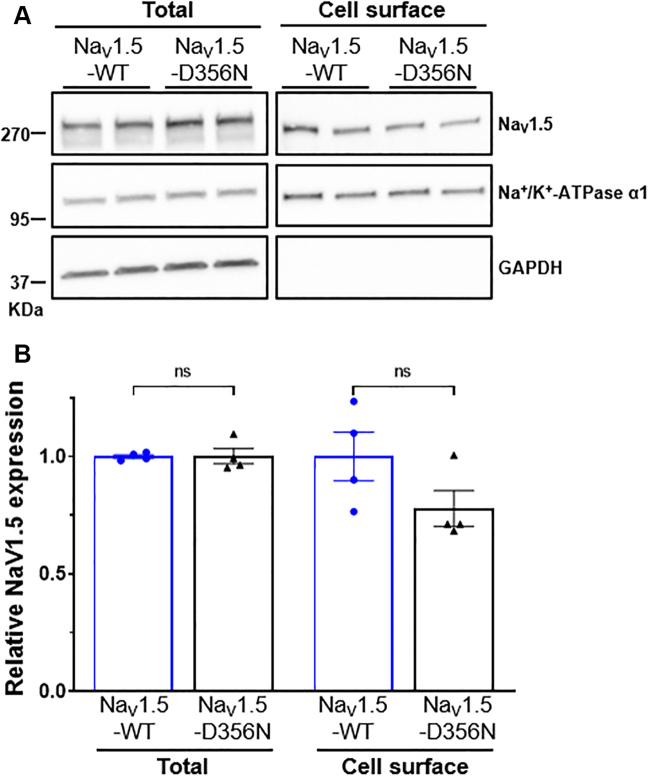
Methods: A heart was obtained from a 15-year-old adolescent boy with normal electrocardiogram who experienced SCD. Postmortem genotyping was performed, and clinical examinations were done on first-degree relatives. The right ventricle was optically mapped, followed by high-field magnetic resonance imaging and histology. Connexin-43 and NaV1.5 were localized by immunofluorescence, and RNA and protein expression levels were studied. HEK-293 cell surface biotinylation assays were performed to examine NaV1.5 trafficking.

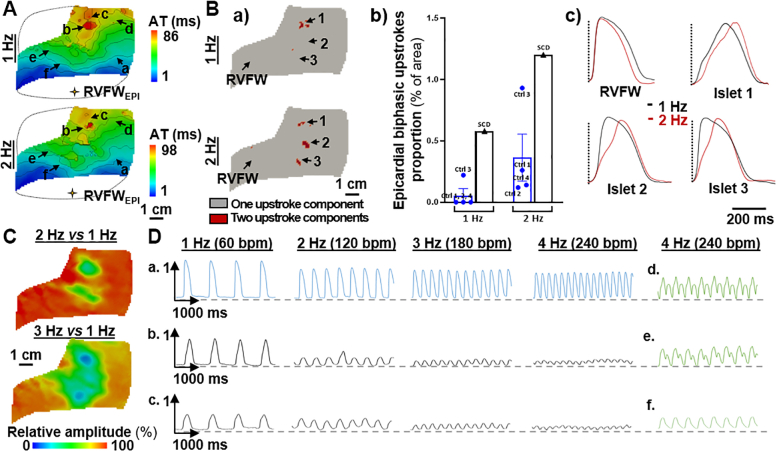
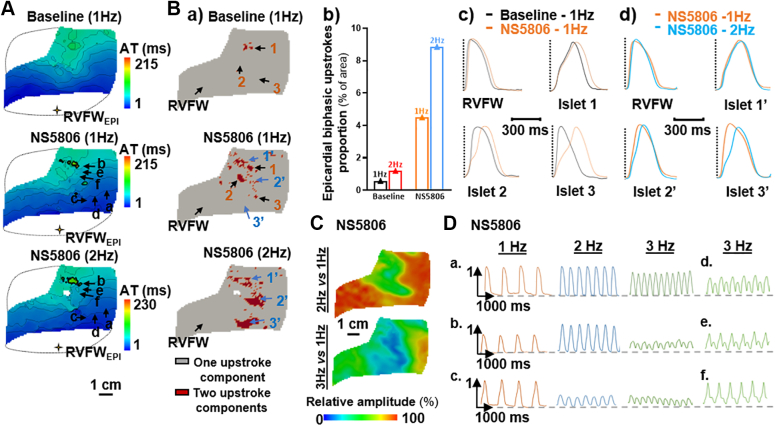
Results: A Brugada-related SCD diagnosis was established for the donor because of a SCN5A Brugada-related variant (p.D356N) inherited from his mother, together with a concomitant NKX2.5 variant of unknown significance. Optical mapping demonstrated a localized epicardial region of impaired conduction near the outflow tract, in the absence of repolarization alterations and microstructural defects, leading to conduction blocks and figure-of-8 patterns. NaV1.5 and connexin-43 localizations were normal in this region, consistent with the finding that the p.D356N variant does not affect the trafficking, nor the expression of NaV1.5. Trends of decreased NaV1.5, connexin-43, and desmoglein-2 protein levels were noted; however, the RT-qPCR results suggested that the NKX2-5 variant was unlikely to be involved.

Conclusions: This study demonstrates for the first time that SCD associated with a Brugada-SCN5A variant can be caused by localized functionally, not structurally, impaired conduction.

Keywords: Brugada syndrome; SCN5A variant; epicardial arrhythmogenic conduction substrate; right ventricle; sudden cardiac death.


Conflict of interest statement

Funding Support and Author Disclosures This work received financial support from the French Government as part of the “Investments of the Future” program managed by the National Research Agency (ANR-10-IAHU04-LIRYC), the Leducq-Foundation (RHYTHM network, 16CVD02), and the Fondation Coeur et Artères (FC17T2). Dr Barc is supported by the ANR JCJC LEARN (R21006NN, RPV21014NNA). Dr Schott is supported by IRP-, an I-SITE NExT health and engineering initiative (Ecole Centrale & Nantes University) and by the IRP- GAINES funded by INSERM and CNRS. Dr Marionneau is supported by the ANR-16-CE92-0013-01 and the National Institutes of Health (R01-HL148803). All other authors have reported that they have no relationships relevant to the contents of this paper to disclose.

Figures

None
Graphical abstract
Figure 1
Figure 1
Clinical and Genotyping Data of Heart Donor and His Family (A) SCD heart donor’s family tree summarizing ECG and genetic testing. (B) Location of the p.D356N variant in the ion transport domain of NaV1.5. ECG = electrocardiogram; SCD = sudden cardiac death.
Figure 2
Figure 2
Right Ventricular Conduction and Upstroke Abnormalities of the SCD Heart (A) Epicardial view of the RV preparation (yellow star: stimulation; open square: recorded optical window; solid dotted line: noise-free optical signals mask). (B) Epicardial a) activation time and b) APD80 maps. (C) Epicardial mean conduction velocities in a “normal” conduction area (ROI-1) compared with an “impaired” conduction area (ROI-2). ROI-1′ is equivalent to the ROI-1 in control hearts (ROIs localizations in B.a and Supplemental Figure 2). (D) a) Binary maps for optical upstroke morphology from SCD heart (epicardial and endocardial masks detailed in Supplemental Figure 3), and b) epicardial biphasic upstroke proportions in SCD and control hearts.; c) optical action potential traces from SCD and control 1 hearts’ RVFW and RVOT (other control hearts shown in Supplemental Figure 2), and from areas bordering the SCD RVOT islet (pixels indicated in B.b). Data presented for 1 Hz (60 beats/min) pacing in epicardial RVFW (RVFWEPI). Data from control hearts (n = 4) are presented as mean ± SEM. Ant = anterior; AT = activation time; EPI = epicardial; ENDO = endocardial; LAD = left anterior descending artery; Post = posterior; RCA = right coronary artery; ROI = region of interest; RVFWEPI = pacing site in epicardial right ventricular free wall.
Figure 3
Figure 3
Impact of Increasing Pacing Frequency RV conduction parameters in the SCD heart in response to epicardial RVFW pacing at 1, 2, 3, and 4 Hz. (A) Activation time maps. (B) a) Binary maps for optical upstroke morphology with b) corresponding biphasic upstroke proportions for SCD and control hearts (1 and 2 Hz only; maps of control hearts are available in Supplemental Figure 2) and c) averaged action potential traces from 4 areas. (C) Relative optical signal amplitude maps and (D) amplitude variations of nonaveraged optical action potential traces from different pixels (localizations in A). Data from control hearts (n = 4) are presented as mean ± SEM. Abbreviations as in Figure 2.
Figure 4
Figure 4
Impact of Ito Current Activation Epicardial conduction parameters in baseline versus NS5806 perfusion (10 µM) when pacing in epicardial RVFW at 1 Hz, and impact of increasing pacing frequency under NS5806 perfusion (1, 2, and 3 Hz pacing). (A) Activation time maps. (B) a) Binary maps of optical upstroke morphology with b) associated epicardial biphasic upstroke proportions; averaged optical action potential traces from different regions; localizations in B.a are represented in c) for baseline versus NS5806 (1 Hz) and in d) for NS5806 1 Hz versus 2 Hz. (C) Relative optical signal amplitude maps and (D) amplitude variations of nonaveraged optical action potential traces from different regions at 1, 2, and 3 Hz under NS5806 perfusion (localizations of pixels in A). Abbreviations as in Figure 2.
Figure 5
Figure 5
Histologic Examination of Fibrosis Levels (A) RV sampling from the SCD heart in relation to optical mapping results (RVOT 1 and RVOT 2 were collected in RVOT biphasic upstrokes islet and RVFW 1 and RVFW 2 in areas without conduction abnormalities; dashed squares). (B) Masson’s trichrome stained transmural sections (6 μm) from a) SCD heart and b) 3 control hearts (for control hearts, 1 sample from each RVOT and RVFW) and associated quantification of fibrosis as percentage of myocardium (each section divided in 8 areas, so n = 8 for each area of each individual; mean ± SEM; ns indicates a nonsignificant difference; fixed P = 0.05; Kruskall-Wallis test followed by the Dunn’s posthoc test). Abbreviations as in Figure 2.
Figure 6
Figure 6
Subcellular Localization of NaV1.5 and Connexin-43 in SCD Heart Representative confocal fluorescent images (objective ×20, oil immersion) of 6-μm-thick longitudinal sections of myocardial paraffin pre-embedded blocks from RVOT epicardium (EPI), RVOT endocardium (ENDO); RVFW EPI and RVFW ENDO of SCD and control 3 hearts immunolabeled for (A) NaV1.5 and N-cadherin or for (B) connexin-43 and N-cadherin. Abbreviations as in Figure 2.
Figure 7
Figure 7
Cardiac Conduction Related–Protein Expression in Tissue Samples (A) Relative expression of N-cadherin, desmoglein-2, plakophilin-2, connexin-43, and NaV1.5 in SCD and control hearts endocardial and epicardial RV total and membrane lysates. (B) NaV1.5 relative expression in RV versus LV ENDO and EPI total lysates of SCD (black) and control (blue) hearts. Relative protein expression was normalized by stain free technology. Data from control hearts (n = 3 to 4) are presented as mean ± SEM. LV = left ventricular; other abbreviations as in Figure 2.
Figure 8
Figure 8
Total and Cell Surface Expression of NaV1.5-D356N in HEK-293 Cells (A) Representative western blots of total and cell surface NaV1.5 from HEK-293 cells transfected with NaV1.5-WT (wild type) + NaVβ1 or NaV1.5-D356N + NaVβ1. Samples were probed in parallel with the anti–Na+/K+-ATPase α1 and anti-GAPDH (glyceraldehyde 3-phosphate dehydrogenase) antibodies. (B) Quantitative data (mean ± SEM) of total and cell surface NaV1.5 protein relative expression (n = 4 in 2 different experiments). The expression of NaV1.5 in each sample was first normalized to the Na+/K+-ATPase α1 in the same blot and then expressed relative to NaV1.5 protein expression (total or cell surface) in cells transfected with NaV1.5-WT + NaVβ1 (ns indicates nonsignificant differences; Mann-Whitney tests with fixed P = 0.05).
Central Illustration
Localized Functional Conduction Abnormalities as Arrhythmogenic Mechanism in Brugada Syndrome Aiming to help understand the arrhythmogenic mechanisms of Brugada syndrome (BrS), this study provides detailed ex vivo functional, structural, and biochemical explorations of a human heart with a BrS-associated SCN5A variant. The functional consequences of this variant were optically mapped in a human heart, showing for the first time that the arrhythmogenic substrate can be of purely functional origin and involve localized conduction abnormalities prone to appear in the epicardial right ventricular outflow tract. INa = sodium current; NaV1.5 = sodium channel protein type 5 subunit alpha; RVOT = right ventricular outflow tract; SCD = sudden cardiac death; SCN5A = NaV1.5-encoding gene.

Comment in

References

    1. Brugada J., Campuzano O., Arbelo E., Sarquella-Brugada G., Brugada R. Present status of Brugada syndrome: JACC state-of-the-art review. J Am Coll Cardiol. 2018;72(9):1046–1059. - PubMed
    1. Ten Sande J.N., Coronel R., Conrath C.E., Driessen A.H.G., de Groot J.R., Tan H.L., et al. ST-segment elevation and fractionated electrograms in Brugada syndrome patients arise from the same structurally abnormal subepicardial RVOT area but have a different mechanism. Circ Arrhythm Electrophysiol. 2015;8(6) - PubMed
    1. Nademanee K., Veerakul G., Chandanamattha P., Chaothawee L., Ariyachaipanich A., Jirasiriojanakorn K., et al. Prevention of ventricular fibrillation episodes in Brugada syndrome by catheter ablation over the anterior right ventricular outflow tract epicardium. Circulation. 2011;123(12):1270–12794. - PubMed
    1. Ciconte G., Monasky M.M., Santinelli V., Micaglio E., Vicedomini G., Anastasia L., et al. Brugada syndrome genetics is associated with phenotype severity. Eur Heart J. 2021;42(11):1082–1090. - PMC - PubMed
    1. Pieroni M., Notarstefano P., Oliva A., Campuzano O., Santangeli P., Coll M., et al. Electroanatomic and pathologic right ventricular outflow tract abnormalities in patients with Brugada syndrome. J Am Coll Cardiol. 2018;72 - PubMed

Publication types