. 2023 Jun 6;62(11):1670-1678.
doi: 10.1021/acs.biochem.3c00094. Epub 2023 May 25.

Folding of Staphylococcal Nuclease Induced by Binding of Chemically Modified Substrate Analogues Sheds Light on Mechanisms of Coupled Folding/Binding Reactions

Affiliations

Folding of Staphylococcal Nuclease Induced by Binding of Chemically Modified Substrate Analogues Sheds Light on Mechanisms of Coupled Folding/Binding Reactions

Yujiro Mori et al. Biochemistry. .

Abstract

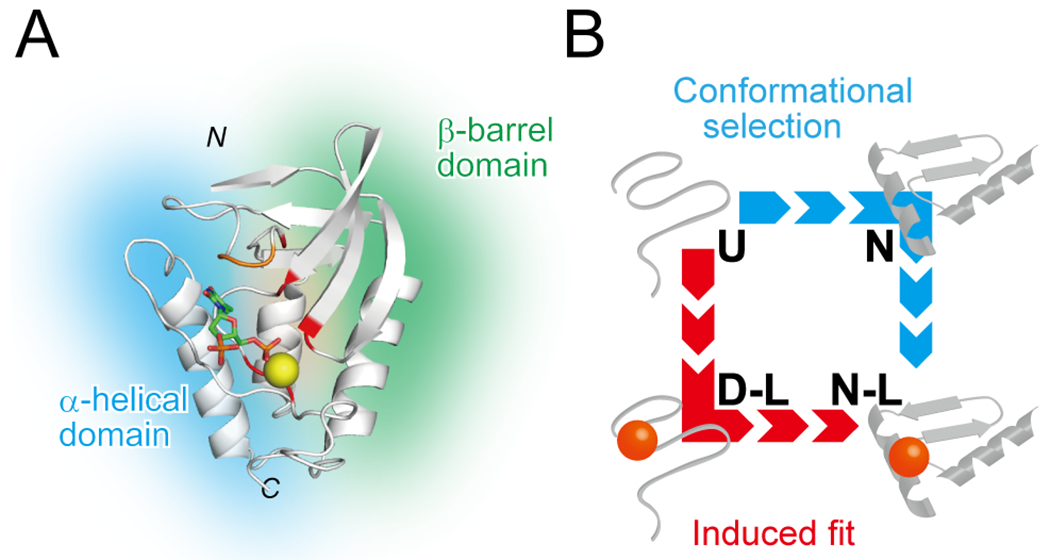
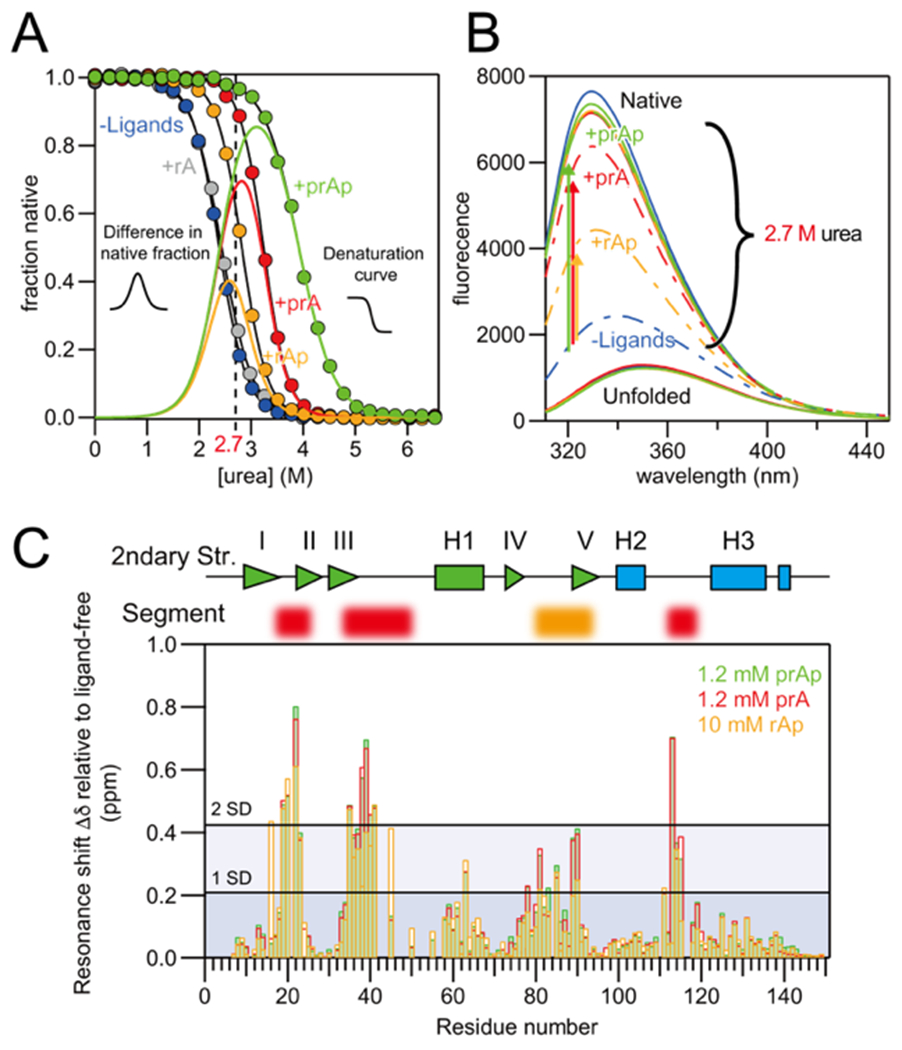
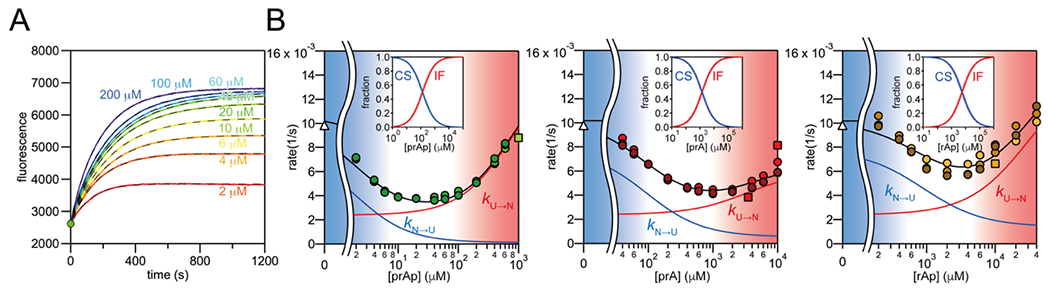
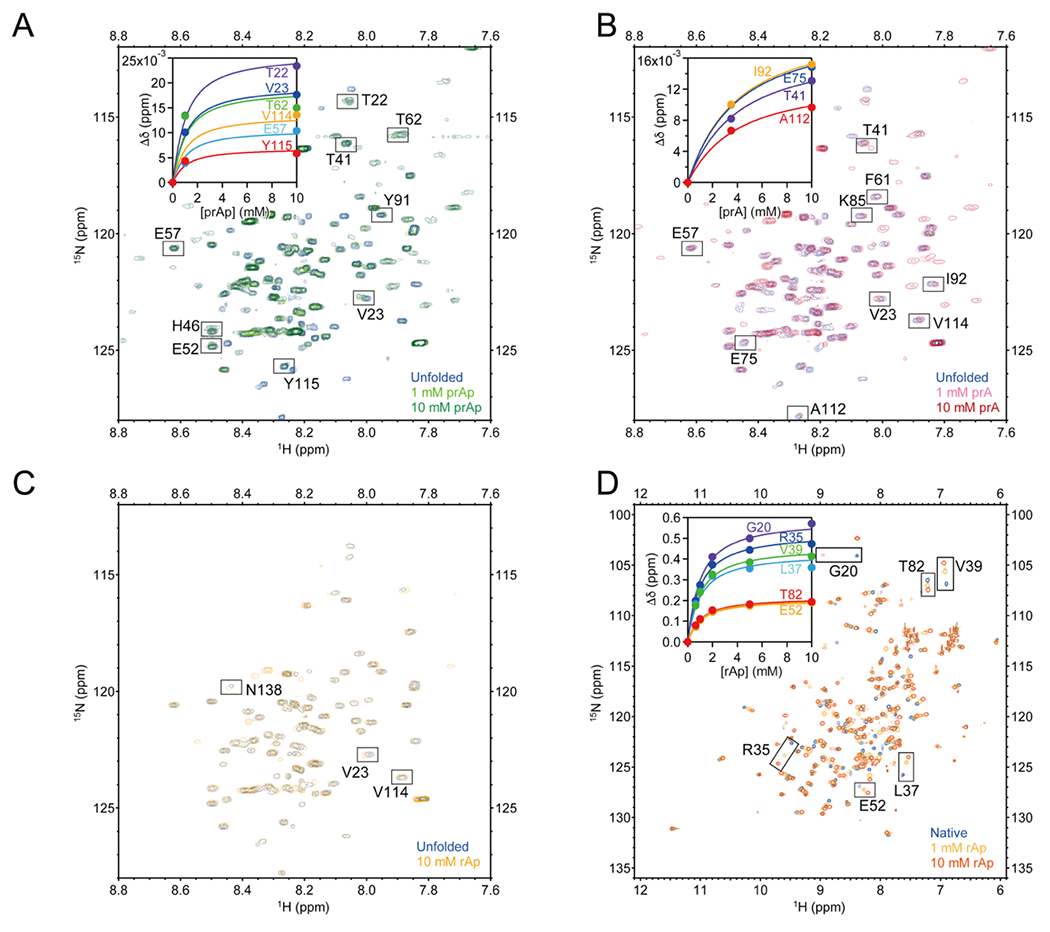
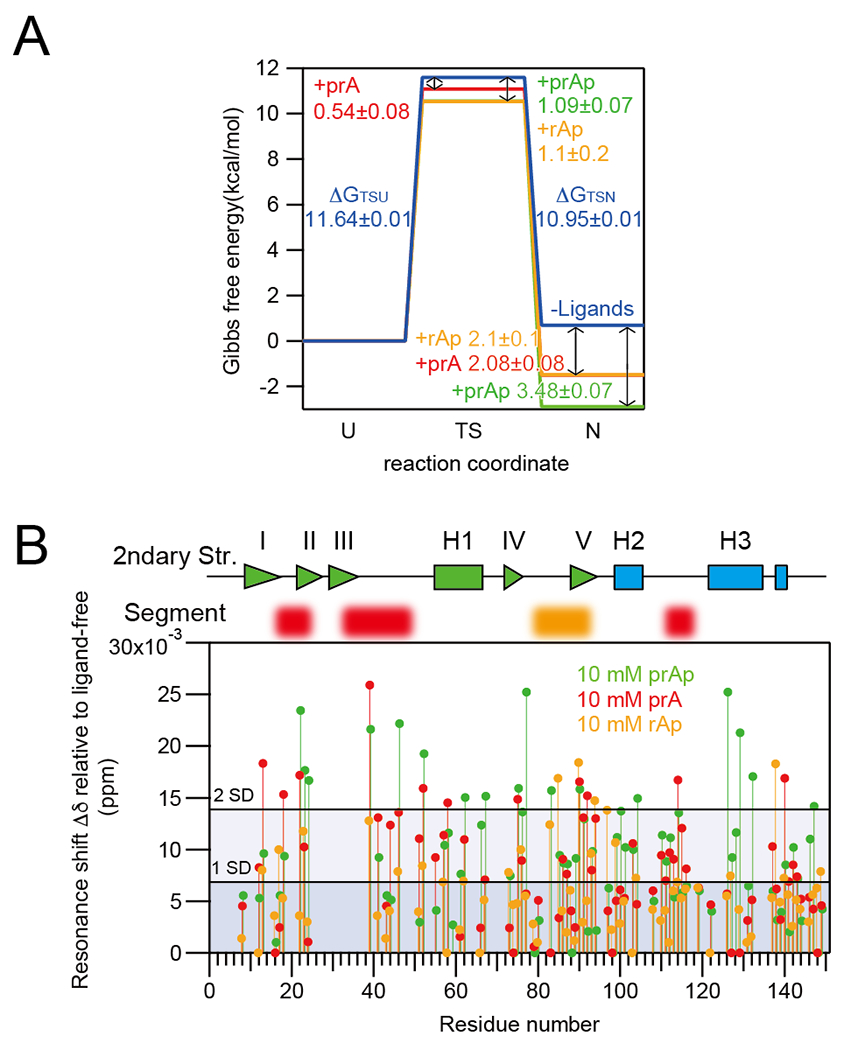
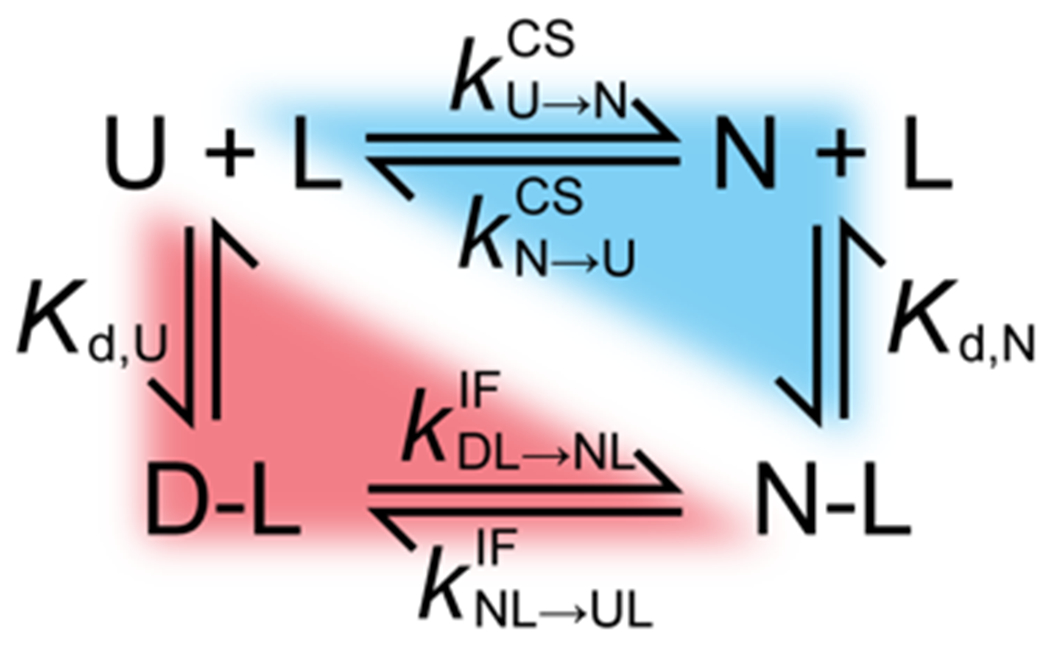
Several proteins have been shown to undergo a shift in the mechanism of ligand binding-induced folding from conformational selection (CS; folding precedes binding) to induced fit (IF; binding precedes folding) with increasing ligand concentration. In previous studies of the coupled folding/binding reaction of staphylococcal nuclease (SNase) in the presence of a substrate analogue, adenosine-3',5'-diphosphate (prAp), we found that the two phosphate groups make important energetic contributions toward stabilizing its complex with the native protein as well as transient conformational states encountered at high ligand concentrations favoring IF. However, the structural contributions of each phosphate group during the reaction remain unclear. To address this question, we relied on fluorescence, nuclear magnetic resonance (NMR), absorption, and isothermal titration calorimetry to study the effects of deletion of the phosphate groups of prAp on the kinetics of ligand-induced folding, using a strategy analogous to mutational ϕ-value analysis to interpret the results. Kinetic measurements over a wide range of ligand concentrations, together with structural characterization of a transient protein-ligand encounter complex using 2D NMR, indicated that, at high ligand concentrations favoring IF, (i) the 5'-phosphate group interacts weakly with denatured SNase during early stages of the reaction, resulting in loose docking of the two domains of SNase, and (ii) the 3'-phosphate group engages in some specific contacts with the polypeptide in the transition state prior to formation of the native SNase-prAp complex.


Figures

Figure 1.
Figure 1.
(A) Ribbon diagram of SNase-Ca2+-pdTp ternary complex (PDB ID: 1SNC) (36). The N-terminal β-barrel and C-terminal α-helical domains are highlighted by green and blue backgrounds, respectively. Explicitly shown are the substrate analog, pdTp (stick representation), and Ca2+ ion (yellow sphere). The structure was drawn by using PyMol (37). (B) Schematic diagram of ligand-coupled folding via conformational selection (CS: blue) and induced-fit (IF: red) pathways.
Figure 2.
Figure 2.
(A) Normalized transition curves for the urea-unfolding equilibria at 180 μM prAp (green), 3 mM prA (red), 3 mM rAp (orange), 10 mM rA (gray), and in the ligand-absence (blue) at pH 7.0 and 22°C. Black curves show the transition curves predicted by the global fitting. Bell-shaped curves show the difference in the native fraction in the presence and absence of prAp, prA, and rAp, using the same color codes as the transition curves. (B) Fluorescence spectra of SNase in the absence and presence of prAp, prA, and rAp. Solid curves: Spectra of the N/N-L and U/D-L extrapolated to zero urea obtained by the global fitting. Broken curves: Spectra experimentally obtained at 2.7 M urea. Arrows indicate expected changes in fluorescence at 326 nm upon ligand-induced folding at 2.7 M urea. (C) Chemical shift changes for resolved and assigned cross peaks in the 1H-15N HSQC spectrum of native SNase in the presence of ~1 mM prAp (green), ~1 mM prA (red), and ~10 mM rAp (orange), relative to those in the absence of the ligand (see Supplementary Materials and Methods in Supporting Information). The lower and upper horizontal lines indicate Δδ = 1 SD (0.203 ppm) and 2 SD, respectively. The secondary structure and segments of the binding pocket (segments associated with 5′- and 3′-phosphate groups are colored in red and orange, respectively) for pdTp in the crystal structure of native complex (27) are shown on the top.
Figure 3.
Figure 3.
(A) Kinetic traces of prAp binding-coupled folding monitored by Trp fluorescence at 326 nm at representative prAp concentrations ranging from 2 μM to 200 μM under our standard denaturing condition (2.7 M urea, pH 7.0 at 22°C). The black dashed and solid lines were obtained by non-linear least-squares fitting and by the model analysis, respectively. The green circle at t = 0 indicates the fluorescence intensity under the standard condition in the absence of ligands. (B) Ligand concentration dependence of the apparent rate of the ligand-coupled folding kinetics, and the apparent rate constants of folding (kU→N; red curves) and unfolding (kN→U; blue curves) (see eq 1 in the text for detail). Circles and squares show the apparent rates obtained by the fluorescence and NMR experiments, respectively (left: prAp, middle: prA, and right: rAp) (for kinetic traces, see Panel A and Fig. S2), and triangles shows apparent rate of urea-induced unfolding kinetics to 2.7 M urea in absence of ligands (see Panel A and Fig. S3C), and black curves show those calculated on the basis of the kinetic analysis. Blue and red background colors indicate the CS- and IF-dominant regions of ligand concentration, respectively. (Insets) Blue and red curves (with errors) show relative fluxes through the CS- and IF-pathways as a function of ligand concentration.
Figure 4.
Figure 4.
(A-C) Comparison of HSQC spectra in the unfolded state (U) of SNase (blue) and the first data point of ligand-coupled folding kinetics at ~100 s after the initiation of the reaction in the presence of (A) 1 mM (light green) and 10 mM prAp (green), (B) 3.5 mM (pink) and 10 mM prA (red), and (C) 10 mM rAp (orange). Representative residues with ligand concentration-dependent resonance shifts (rectangular box) are explicitly shown. (D) rAp titration probed by HSQC spectra. HSQC spectrum of the native state (N) in the absence of ligands (blue), and in the presence of 1 mM (orange) and 10 mM rAp (red) are shown. Insets: (A, B) Ligand-dependence of chemical shift changes for representative peaks in the denatured species at ~100 s of the reaction. (D) rAp con-centration dependence of the resonance shifts in the native state for representative peaks. The solid lines are obtained by global fitting using the dissociation constant as the global parameter.
Figure 5.
Figure 5.
(A) Free energy diagram of ligand-coupled folding of SNase along the CS pathway (blue) and IF pathway (prAp: green, prA: red, and rAp: orange) at sufficiently high ligand-concentrations where IF is the dominant folding pathway. The free energies of the native (N/N-L) and transition state (TS/TS-L) species relative to the corresponding denatured states are shown under each ligand condition. Arrows show the free energy differences between the ligand-bound (TS-L/N-L) and the corresponding ligand-free (TS/N) species for each ligand. (B) Comparison of the resonance shifts in the presence of 10 mM prAp (green), prA (red), and rAp (orange). The upper and lower horizontal lines indicate Δδ = 1 SD (0.007 ppm) and 2 SD, respectively. The secondary structure and segments of the binding pocket (segments associated with 5′- and 3′-phosphate groups are colored in red and orange, respectively) for pdTp in the crystal structure of the native complex are shown on the top.
Scheme 1.
Scheme 1.
Folding reactions via CS and IF pathways.

Similar articles

Cited by

References

    1. Perutz MF (1970) Stereochemistry of cooperative effects in haemoglobin, Nature 228, 726739. - PubMed
    1. Müller CW, Schlauderer GJ, Reinstein J, and Schulz GE (1996) Adenylate kinase motions during catalysis: an energetic counterweight balancing substrate binding, Structure 4, 147–156. - PubMed
    1. Ferguson KM, Berger MB, Mendrola JM, Cho HS, Leahy DJ, and Lemmon MA (2003) EGF activates its receptor by removing interactions that autoinhibit ectodomain dimerization, Mol. Cell 11, 507–517. - PubMed
    1. Wright PE, and Dyson HJ (1999) Intrinsically unstructured proteins: re-assessing the protein structure-function paradigm, J. Mol. Biol 293, 321–331. - PubMed
    1. Dunker AK, Lawson JD, Brown CJ, Williams RM, Romero P, Oh JS, Oldfield CJ, Campen AM, Ratliff CM, Hipps KW, Ausio J, Nissen MS, Reeves R, Kang C, Kissinger CR, Bailey RW, Griswold MD, Chiu W, Garner EC, and Obradovic Z (2001) Intrinsically disordered protein, J. Mol. Graph. Model 19, 26–59. - PubMed

Publication types