

Reliability and agreement of the timed up and go test in children and teenagers with autism spectrum disorder
- PMID: 37227499
- PMCID: PMC10209578
- DOI: 10.1007/s00431-023-05027-8
Reliability and agreement of the timed up and go test in children and teenagers with autism spectrum disorder
Abstract
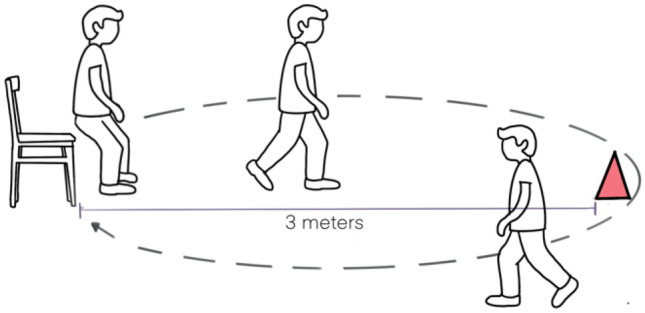
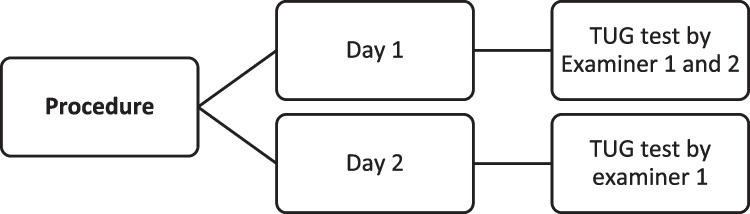
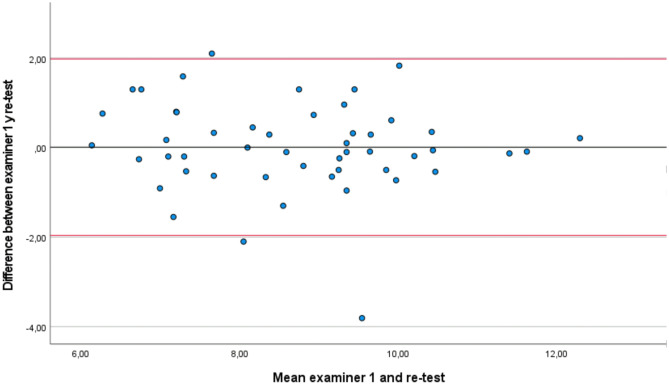
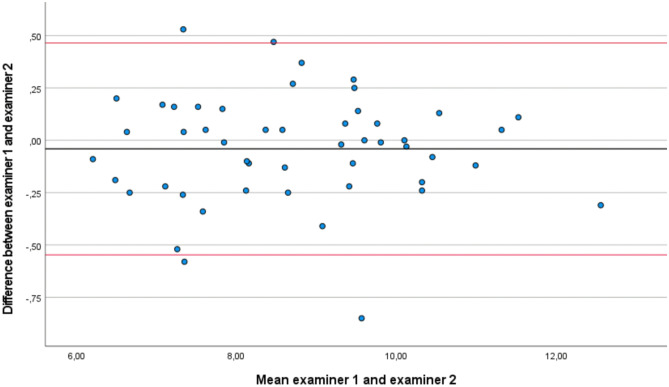
ASD patients include a variety of motor deficits; however, these issues have received less scientific attention than other ASD symptoms. Due to understanding and behavioral difficulties, it might be difficult to administer motor assessment measures to children and adolescents with ASD. To evaluate motor challenges in this population, including gait and dynamic balance issues, the timed up and go test (TUG) may be a simple, easy to apply, quick, and inexpensive tool. This test measures in seconds the time it takes for an individual to get up from a standard chair walk 3 m, turn around, walk back to the chair, and sit down again. The study purpose was to evaluate the inter- and intra-rater reliability of TUG test in children and teenagers with ASD. A total of 50 children and teenagers with ASD (43 boys and 7 girls) between 6 and 18 years were included. Reliability was verified by the intraclass correlation coefficient, standard error of measurement, and minimum detectable change. The agreement was analyzed by the Bland-Altman method. A good intra-rater reliability (ICC = 0.88; 95% CI = 0.79-0.93) and an excellent inter-rater reliability (ICC = 0,99; 95% CI = 0.98 to 0.99) were observed. Additionally, Bland-Altman plots demonstrated that there was no evidence of bias in either the replicates or between examiners. Furthermore, the limits of agreement (LOAs) between the testers and test replicates were close, indicating that there was little variation between measurements. Conclusions: The test TUG showed strong intra- and inter-rater reliability values, low proportion of measurement errors, and lack of significant bias based on by test repetition in children and teenagers with ASD. These results could be clinically useful for assessing balance and the risk of falls in children and teenagers with ASD. However, the present study is not free of limitations, such as the use of a non-probabilistic sampling. What is Known: • People with ASD have a variety of motor deficits that have a prevalence rate almost as common as intellectual disability. In our knowledge, there are no studies that provide data on the reliability of the use of scales or assessment tests in children and adolescents with ASD to measure motor difficulties, such as gait and dynamic balance, in children and teenagers with ASD. • Timed up and go test (TUG) could be a possible tool to measure this motor skills. What is New: • The reliability and agreement of the Timed up and go test in 50 children and teenagers with autism spectrum disorder showed strong intra- and inter-rater reliability values, low proportion of measurement errors, and lack of significant bias based on by test repetition.
Keywords: Autism spectrum disorder; Balance; Children; Gait; Measure; Reliability.
© 2023. The Author(s).
Conflict of interest statement
The authors declare no competing interests.
Figures
References
-
- American Psychiatric Association . Diagnostic and Statistical Manual of Mental Disorders (DSM-5) 5. Washington, DC: American Psychiatric Association Publishing; 2013.
MeSH terms
LinkOut - more resources
Full Text Sources
Medical
