

Determining the linear correlation between dielectric spectroscopy and viable biomass concentration in filamentous fungal fermentations
- PMID: 37227599
- PMCID: PMC10275802
- DOI: 10.1007/s10529-023-03384-w
Determining the linear correlation between dielectric spectroscopy and viable biomass concentration in filamentous fungal fermentations
Abstract
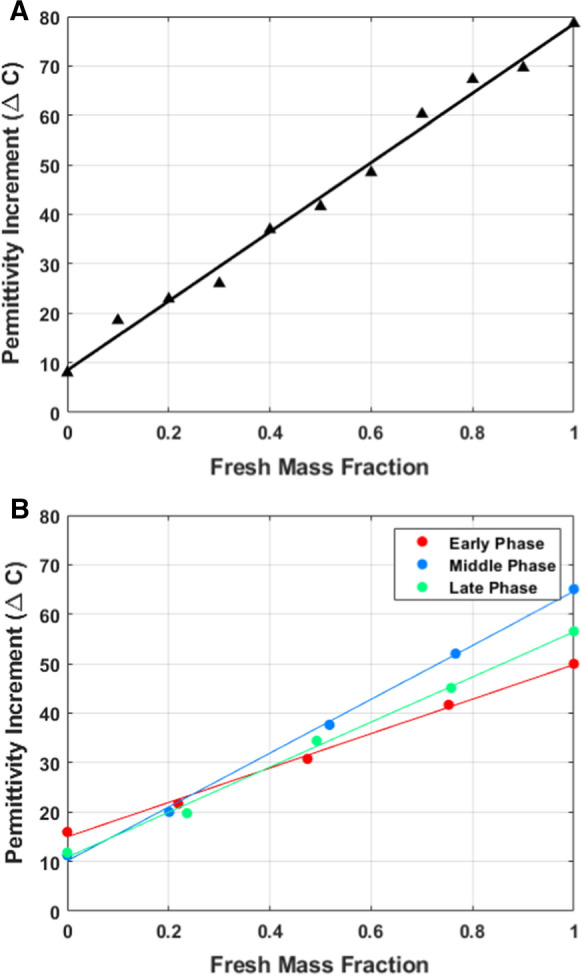
Objectives: Dielectric spectroscopy is commonly used for online monitoring of biomass growth. It is however not utilized for biomass concentration measurements due to poor correlation with Cell Dry Weight (CDW). A calibration methodology is developed that can directly measure viable biomass concentration in a commercial filamentous process using dielectric values, without recourse to independent and challenging viability determinations.
Results: The methodology is applied to samples from the industrial scale fermentation of a filamentous fungus, Acremonium fusidioides. By mixing fresh and heat-killed samples, linear responses were verified and sample viability could be fitted with the dielectric [Formula: see text] values and total solids concentration. The study included a total of 26 samples across 21 different cultivations, with a legacy at-line viable cell analyzer requiring 2 ml samples, and a modern on-line probe operated at-line with 2 different sample presentation volumes, one compatible with the legacy analyzer, a larger sample volume of 100 ml being compatible with calibration for on-line operation. The linear model provided an [Formula: see text] value of 0.99 between [Formula: see text] and viable biomass across the sample set using either instrument. The difference in ∆C when analyzing 100 mL and 2 mL samples with an in-line probe can be adjusted by a scalar factor of 1.33 within the microbial system used in this study, preserving the linear relation with [Formula: see text] of 0.97.
Conclusions: It is possible to directly estimate viable biomass concentrations utilizing dielectric spectroscopy without recourse to extensive and difficult to execute independent viability studies. The same method can be applied to calibrate different instruments to measure viable biomass concentration. Small sample volumes are appropriate as long as the sample volumes are kept consistent.
Keywords: Dielectric spectroscopy; Fermentation; Sensor calibration; Viable biomass.
© 2023. The Author(s).
Conflict of interest statement
None.
Figures


Similar articles
-
A Novel Application for Low Frequency Electrochemical Impedance Spectroscopy as an Online Process Monitoring Tool for Viable Cell Concentrations.Sensors (Basel). 2016 Nov 11;16(11):1900. doi: 10.3390/s16111900. Sensors (Basel). 2016. PMID: 27845720 Free PMC article.
-
Application of a mechanistic model as a tool for on-line monitoring of pilot scale filamentous fungal fermentation processes-The importance of evaporation effects.Biotechnol Bioeng. 2017 Mar;114(3):589-599. doi: 10.1002/bit.26187. Epub 2016 Sep 26. Biotechnol Bioeng. 2017. PMID: 27642140
-
Newly designed and validated impedance spectroscopy setup in microtiter plates successfully monitors viable biomass online.Biotechnol J. 2015 Aug;10(8):1259-68. doi: 10.1002/biot.201400534. Epub 2015 Jul 30. Biotechnol J. 2015. PMID: 26014759
-
Application of dielectric spectroscopy to unravel the physiological state of microorganisms: current state, prospects and limits.Appl Microbiol Biotechnol. 2020 Jul;104(14):6101-6113. doi: 10.1007/s00253-020-10677-x. Epub 2020 May 21. Appl Microbiol Biotechnol. 2020. PMID: 32440707 Review.
-
Upflow anaerobic sludge blanket reactor--a review.Indian J Environ Health. 2001 Apr;43(2):1-82. Indian J Environ Health. 2001. PMID: 12397675 Review.
References
-
- Dahene WV, Jahnsen S, Kirk I, Larsen R, Lorck H. Fusidic acid: Properties, biosynthesis, and fermentation. In: Vandamme EJ, editor. Biotechnology of industrial antibiotics. New York: Illustrated, Marcel Dekker; 1984. pp. 427–450.
-
- Ehgartner D, Hartmann T, Heinzl S, Frank M, Veiter L, Kager J, Herwig C, Fricke J. Controlling the specific growth rate via biomass trend regulation in filamentous fungi bioprocesses. Chem Eng Sci. 2017;172:32–41. doi: 10.1016/j.ces.2017.06.020. - DOI
-
- Flores-Cosío G, Herrera-López EJ, Arellano-Plaza M, Gschaedler-Mathis A, Sanchez A, Amaya-Delgado L. Dielectric property measurements as a method to determine the physiological state of Kluyveromyces marxianus and Saccharomyces cerevisiae stressed with furan aldehydes. Appl Microbiol Biotechnol. 2019;103(23–24):9633–9642. doi: 10.1007/s00253-019-10152-2. - DOI - PubMed
-
- Kell DB, Kaprelyants AS, Weichart DH, Harwood CR, Barer MR. Viability and activity in readily culturable bacteria: A review and discussion of the practical issues. Antonie Van Leeuwenhoek, International Journal of General and Molecular Microbiology. 1998;73(2):169–187. doi: 10.1023/A:1000664013047. - DOI - PubMed
MeSH terms
Grants and funding
LinkOut - more resources
Full Text Sources
