

Software-based quantitative CT analysis to predict the growth trend of persistent nonsolid pulmonary nodules: a retrospective study
- PMID: 37227661
- PMCID: PMC10264528
- DOI: 10.1007/s11547-023-01648-z
Software-based quantitative CT analysis to predict the growth trend of persistent nonsolid pulmonary nodules: a retrospective study
Abstract
Purpose: Persistent nonsolid nodules (NSNs) usually exhibit an indolent course and may remain stable for several years; however, some NSNs grow quickly and require surgical excision. Therefore, identifying quantitative features capable of early discrimination between growing and nongrowing NSNs is becoming a crucial aspect of radiological analysis. The main purpose of this study was to evaluate the performance of an open-source software (ImageJ) to predict the future growth of NSNs detected in a Caucasian (Italian) population.
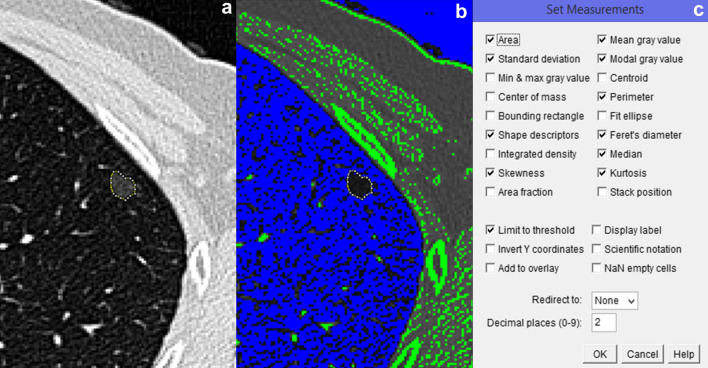
Material and methods: We retrospectively selected 60 NSNs with an axial diameter of 6-30 mm scanned with the same acquisition-reconstruction parameters and the same computed tomography (CT) scanner. Software-based analysis was performed on thin-section CT images using ImageJ. For each NSNs, several quantitative features were extracted from the baseline CT images. The relationships of NSN growth with quantitative CT features and other categorical variables were analyzed using univariate and multivariable logistic regression analyses.
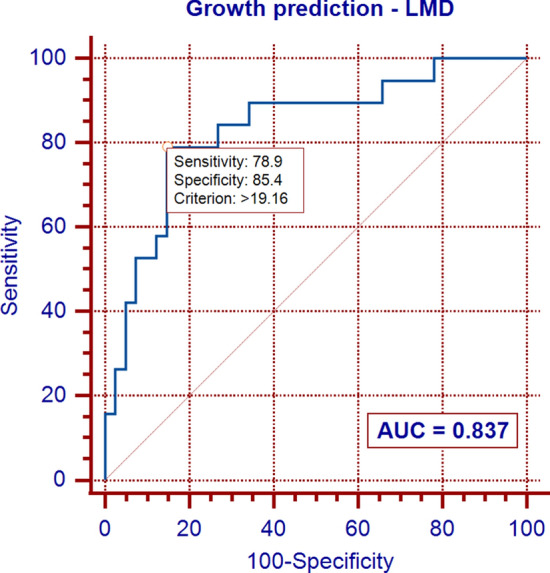
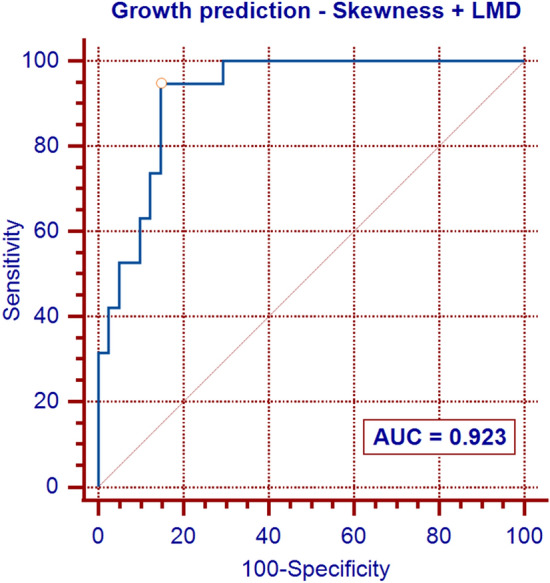
Results: In multivariable analysis, only the skewness and linear mass density (LMD) were significantly associated with NSN growth, and the skewness was the strongest predictor of growth. In receiver operating characteristic curve analyses, the optimal cutoff values of skewness and LMD were 0.90 and 19.16 mg/mm, respectively. The two predictive models that included the skewness, with or without LMD, exhibited an excellent power for predicting NSN growth.
Conclusion: According to our results, NSNs with a skewness value > 0.90, specifically those with a LMD > 19.16 mg/mm, should require closer follow-up due to their higher growth potential, and higher risk of becoming an active cancer.
Keywords: Computed tomography; Computer-assisted image analysis; Nonsolid nodule; Pulmonary nodule; Pure ground-glass nodule; Subsolid nodule.
© 2023. The Author(s).
Conflict of interest statement
The authors declare that they have no conflict of interest.
Figures


References
-
- Kobayashi Y, Sakao Y, Deshpande GA, Fukui T, Mizuno T, Kuroda H, Sakakura N, Usami N, Yatabe Y, Mitsudomi T. The association between baseline clinical-radiological characteristics and growth of pulmonary nodules with ground-glass opacity. Lung Cancer. 2014;83:61–66. doi: 10.1016/j.lungcan.2013.10.017. - DOI - PubMed
-
- Silva M, Prokop M, Jacobs C, Capretti G, Sverzellati N, Ciompi F, van Ginneken B, Schaefer-Prokop CM, Galeone C, Marchianò A, Pastorino U. Long-term active surveillance of screening detected subsolid nodules is a safe strategy to reduce overtreatment. J Thorac Oncol. 2018;13:1454–1463. doi: 10.1016/j.jtho.2018.06.013. - DOI - PubMed
-
- Rundo L, Ledda RE, di Noia C, Sala E, Mauri G, Milanese G, Sverzellati N, Apolone G, Gilardi MC, Messa MC, Castiglioni I, Pastorino U. A low-dose CT-based radiomic model to improve characterization and screening recall intervals of indeterminate prevalent pulmonary nodules. Diagnostics. 2021;11:1610. doi: 10.3390/diagnostics11091610. - DOI - PMC - PubMed
MeSH terms
LinkOut - more resources
Full Text Sources
Medical
