. 2023 May 1;64(5):24.
doi: 10.1167/iovs.64.5.24.

Identification of Hif1α as a Potential Participant in Autoimmune Uveitis Pathogenesis Using Single-Cell Transcriptome Analysis

Affiliations

Identification of Hif1α as a Potential Participant in Autoimmune Uveitis Pathogenesis Using Single-Cell Transcriptome Analysis

Lei Zhu et al. Invest Ophthalmol Vis Sci. .

Abstract

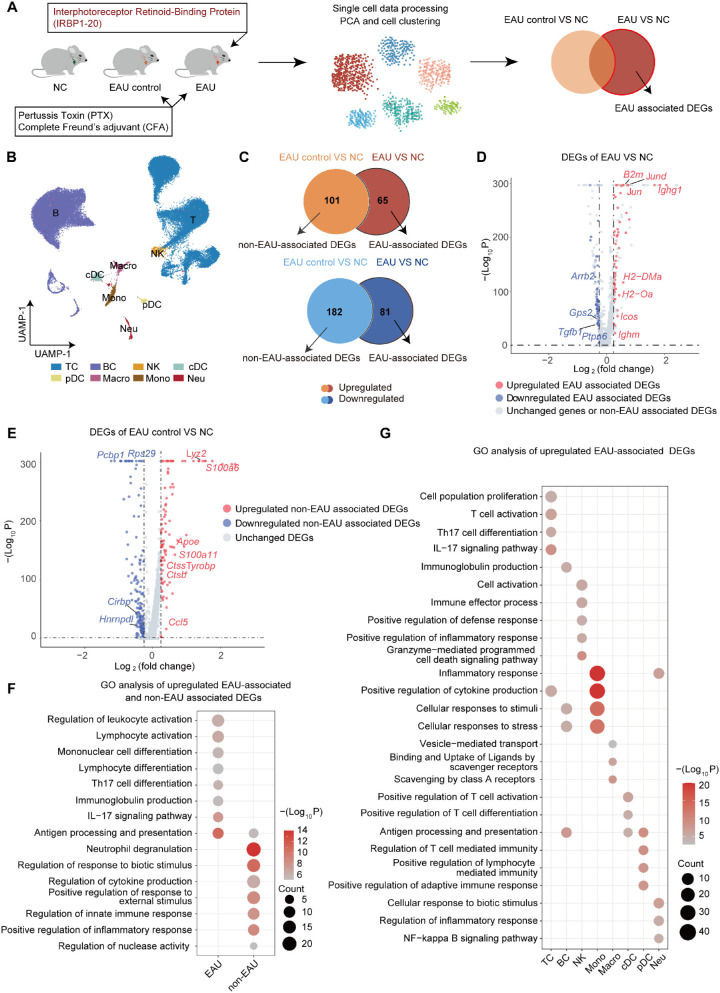
Purpose: This study purposed to depict the transcriptional changes associated with autoimmune uveitis (AU) pathogenesis and identify potential therapeutic targets of this disease.

Methods: An experimental AU (EAU) model was established with retina antigen and adjuvants. An EAU control group was established with adjuvant only to eliminate nonspecific effects. We conducted single-cell RNA sequencing (scRNA-seq) on cervical draining lymph node cells of EAU, EAU control, and normal mice to identify the EAU-associated transcriptional changes and the potential pathogenic molecules. Subsequent flow cytometry, adoptive transfer experiment, scRNA-seq analysis of human uveitis, and proliferation assessment were conducted to verify the function of the interested molecule in uveitis.

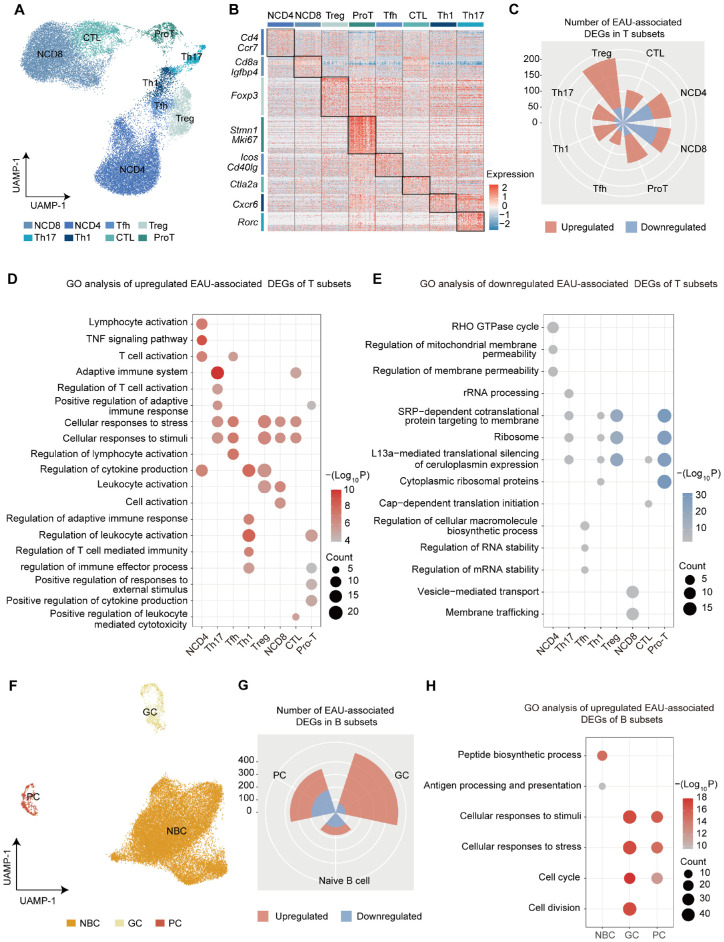
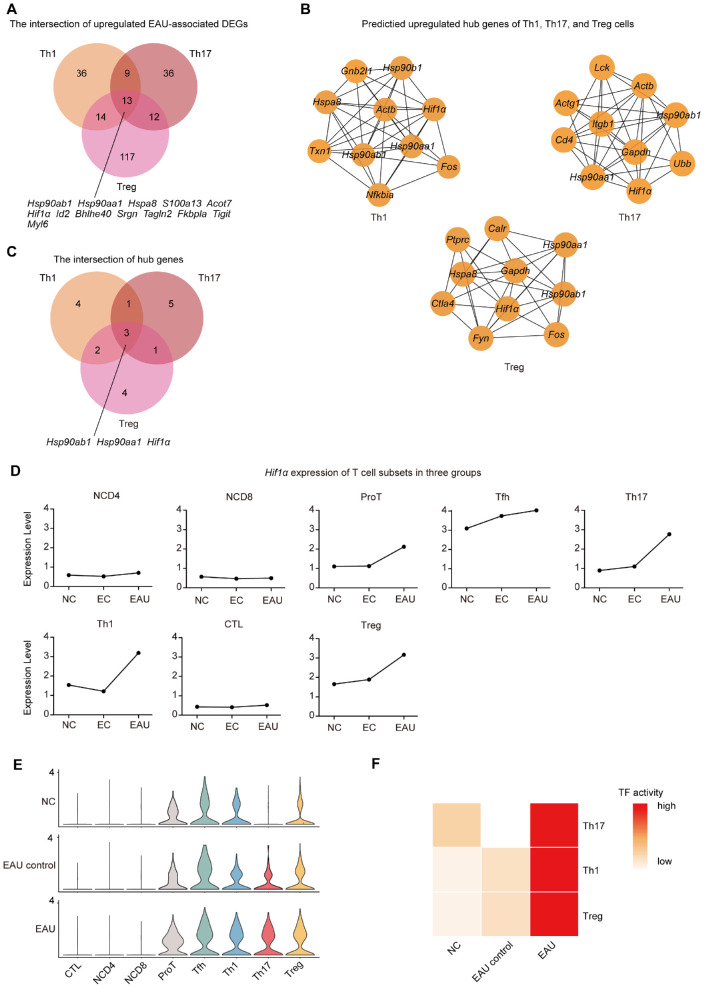
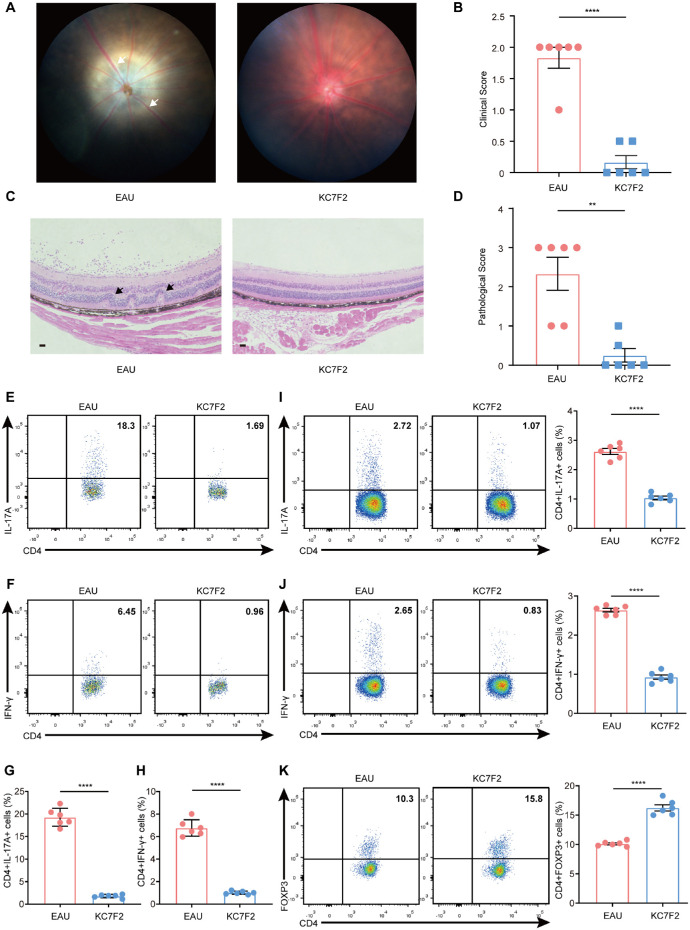
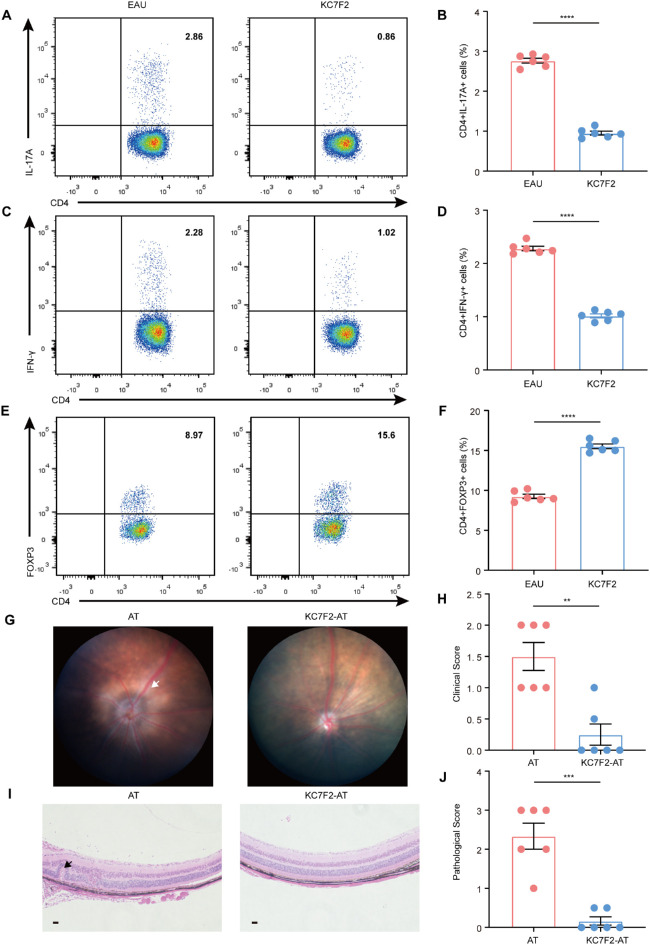
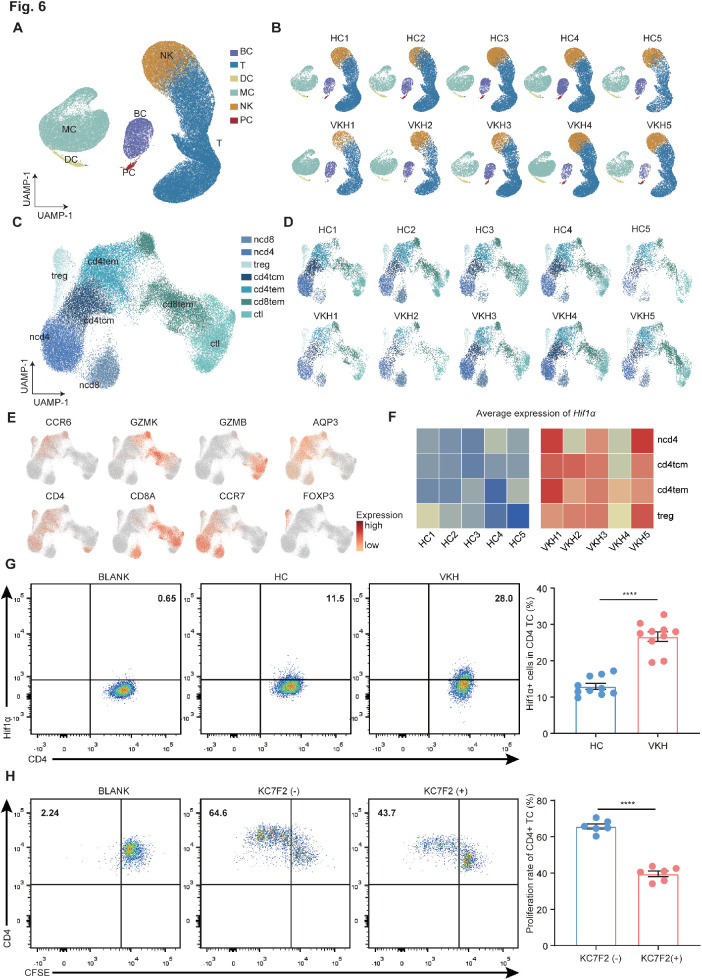
Results: The scRNA-seq data suggested that hypoxia-inducible factor 1 alpha (Hif1α) may participate in EAU pathogenesis via regulating T helper (Th)-17, Th1, and regulatory T cells. Hif1α inhibition alleviated EAU symptoms and regulated Th17, Th1, and regulatory T cell proportions. CD4+ T cells with repressed Hif1α expression failed to transfer EAU to naïve mice. In Vogt-Koyanagi-Harada disease, which is a human uveitis, Hif1α was also increased in CD4+ T cells and regulated their proliferation.

Conclusions: The results indicate that Hif1α may participate in AU pathogenesis and are, thus, a potential therapeutic target.


Conflict of interest statement

Disclosure: L. Zhu, None; H. Li, None; R. Wang, None; Z. Li, None; S. Zhao, None; X. Peng, None; W. Su, None

Figures

Figure 1.
Figure 1.
scRNA-seq and identification of EAU-associated transcriptional changes. (A) Schematic diagram of experimental design. CDLN cells were collected from normal, EAU control, and EAU mice and were subject to scRNA-seq. The normal mice (NC) group and EAU group contained two samples and the EAU control group contained 1 sample. Each sample included three mice from the same group. (B) Umap plot of CDLN cells from all mice groups. (C) Venn plots showing the number of up- or down-regulated non-EAU and EAU-associated DEGs. (D) Volcano plot showing the up- and down-regulated DEGs in EAU/NC comparison group. (E) Volcano plot showing the up- and down-regulated DEGs in EAU control/NC comparison group. (F) Representative GO terms enriched by the up-regulated EAU and non–EAU-associated DEGs of total CDLN cells. (G) Representative GO terms enriched by the up-regulated EAU-associated DEGs of the major immune cell types.
Figure 2.
Figure 2.
Identification of EAU-associated transcriptional changes in T- and B-cell subsets. (A) Umap plot of T cells from all mice groups. (B) Heatmap showing marker gene expression by each T-cell subset. (C) Rose plot showing the number of up- and down-regulated EAU-associated DEGs in each T-cell subset. (D) Representative GO terms enriched by the up-regulated EAU-associated DEGs of the T-cell subsets. (E) Representative GO terms enriched by the down-regulated EAU-associated DEGs of the T-cell subsets. (F) Umap plot of B cells from all mice groups. (G) Rose plot showing the number of up- and down-regulated EAU-associated DEGs in each B-cell subset. (H) Representative GO terms enriched by the up-regulated EAU-associated DEGs of the B-cell subsets.
Figure 3.
Figure 3.
Identification of Hif1α as a potential pathogenic molecule in uveitis. (A) Venn plots showing the common up-regulated EAU-associated DEGs of Th1, Th17, and Treg cells. (B) Network of predicted top 10 up-regulated hub genes of Th1, Th17, and Treg cells. (C) Venn plots showing the commonly up-regulated hub genes of Th1, Th17, and Treg cells. (D) Line plots showing the mean expression of Hif1α in T-cell subsets of NC, EAU control, and EAU mice. (E) Violin plots showing the Hif1α expression by T-cell subsets in NC, EAU control, and EAU mice. (F) Heatmap showing Hif1α TF activity in Th1, Th17, and Treg cells in NC, EAU control, and EAU mice.
Figure 4.
Figure 4.
Hif1α inhibition ameliorated EAU symptoms, decreased the proportion of Teff, and increased that of Treg cells. (A) Representative fundus photographs of EAU mice and KC7F2 treated EAU mice at day 14 after immunization. White arrows mark inflammatory exudation. (B) Clinical scores of EAU mice and KC7F2-treated EAU mice (n = 6). Data were expressed as mean ± SEM. Significance was evaluated by unpaired two-tailed Student t-test. ****P < 0.0001. (C) Representative hematoxylin and eosin staining plots of the fundus of EAU mice and KC7F2 treated EAU mice at day 14 after immunization. Black arrows mark retinal folding and inflammatory cell infiltration. Scale bars, 20 mm. (D) Pathological scores of EAU mice and KC7F2-treated EAU mice (n = 6). Data were expressed as mean ± SEM. Significance was evaluated by unpaired two-tailed Student t-test. **P < 0.01. (EH) The proportions of CD4+ IL-17A+ (E and G) and CD4+ IFN-γ+ T cells (F and H) infiltrated into the retina in EAU mice and KC7F2 treated EAU mice at day 14 after immunization measured by flow cytometry (n = 6). Data were expressed as mean ± SEM. Significance was evaluated by unpaired two-tailed Student t-test. ****P < 0.0001. (IK) The proportions of CD4+ IL-17A+ (I), CD4+ IFN-γ+ (J), and CD4+ Foxp3+ T cells (K) in CDLNs of EAU mice and KC7F2 treated EAU mice at day 14 after immunization measured by flow cytometry (n = 6). Data were expressed as mean ± SEM. Significance was evaluated by unpaired two-tailed Student t-test. ****P < 0.0001.
Figure 5.
Figure 5.
Inhibition of Hif1α in CD4+ T cells decreased their EAU-inducing capacity. (AF) CDLN cells of EAU mice were isolated and cultured with IRBP120 or IRBP120+ KC7F2 for 72 hours. The proportions of CD4+ IL-17A+ (A and B), CD4+ IFN-γ+ (C and D), and CD4+ Foxp3+ T cells (E and F) in CDLNs were measured by flow cytometry (n = 6). Data were expressed as mean ± SEM. Significance was evaluated by unpaired two-tailed Student t-test. ****P < 0.0001. (G) Representative fundus photographs of mice injected with CD4+ T cells cultured with IRBP120 or IRBP120+ KC7F2 at day 14. White arrows mark inflammatory exudation. (H) Clinical scores of mice injected with CD4+ T cells cultured with IRBP120 or IRBP120+ KC7F2 at day 14 (n = 6). Data were expressed as mean ± SEM. Significance was evaluated by unpaired two-tailed Student t-test. **P < 0.01. (I) Representative hematoxylin and eosin staining plots of mice injected with CD4+ T cells cultured with IRBP120 or IRBP120+ KC7F2 at day 14. Black arrows mark retinal folding and inflammatory cell infiltration. Scale bars, 20 mm. (J) Pathological scores of mice injected with CD4+ T cells cultured with IRBP120 or IRBP120+ KC7F2 at day 14 (n = 6). Data were expressed as mean ± SEM. Significance was evaluated by unpaired two-tailed Student t-test. ***P < 0.001.
Figure 6.
Figure 6.
Expression of Hif1α in human uveitis. (A) Umap plot of peripheral blood mononuclear cells (PBMC) from HC and VKH samples. (B) Umap plot of PBMC from each healthy control and VKH patient. HC, healthy control. (C) Umap plot of T cell from HC and VKH samples. (D) Umap plot of T cells from each healthy control and VKH patient. (E) Feature plots showing the expression of marker genes by human T cells. (F) Heatmap plots showing the average expression of Hif1α by CD4+ T cells from each healthy control and patient. (G) The proportion of Hif1α+ CD4+ T cells in healthy controls and patients with VKH measured by flow cytometry (n = 10). (H) The proliferation rate of CD4+ T cells treated or not with KC7F2 measured by flow cytometry (n = 6). Data were expressed as mean ± SEM. Significance was evaluated by unpaired two-tailed Student t-test. ****P < 0.0001.

Similar articles

Cited by

References

    1. Jabs DA. Immunosuppression for the Uveitides. Ophthalmology. 2018; 125(2): 193–202. - PMC - PubMed
    1. Krishna U, Ajanaku D, Denniston AK, Gkika T. Uveitis: a sight-threatening disease which can impact all systems. Postgrad Med J. 2017; 93(1106): 766–773. - PubMed
    1. Diedrichs-Möhring M, Kaufmann U ,Wildner G.. The immunopathogenesis of chronic and relapsing autoimmune uveitis - lessons from experimental rat models. Prog Retin Eye Res. 2018; 65: 107–126. - PubMed
    1. Burkholder BM,Jabs DA.. Uveitis for the non-ophthalmologist. BMJ (Clin Res Ed). 2021; 372(m4979. - PubMed
    1. Uchiyama E, Papaliodis GN, Lobo AM, Sobrin L. Side-effects of anti-inflammatory therapy in uveitis. Semin Ophthalmol. 2014; 29(5-6): 456–467. - PubMed

Publication types

Substances