. 2023 Jul 3;133(13):e163290.
doi: 10.1172/JCI163290.

Targeting hypoxia-inducible factors with 32-134D safely and effectively treats diabetic eye disease in mice

Affiliations

Targeting hypoxia-inducible factors with 32-134D safely and effectively treats diabetic eye disease in mice

Jing Zhang et al. J Clin Invest. .

Abstract

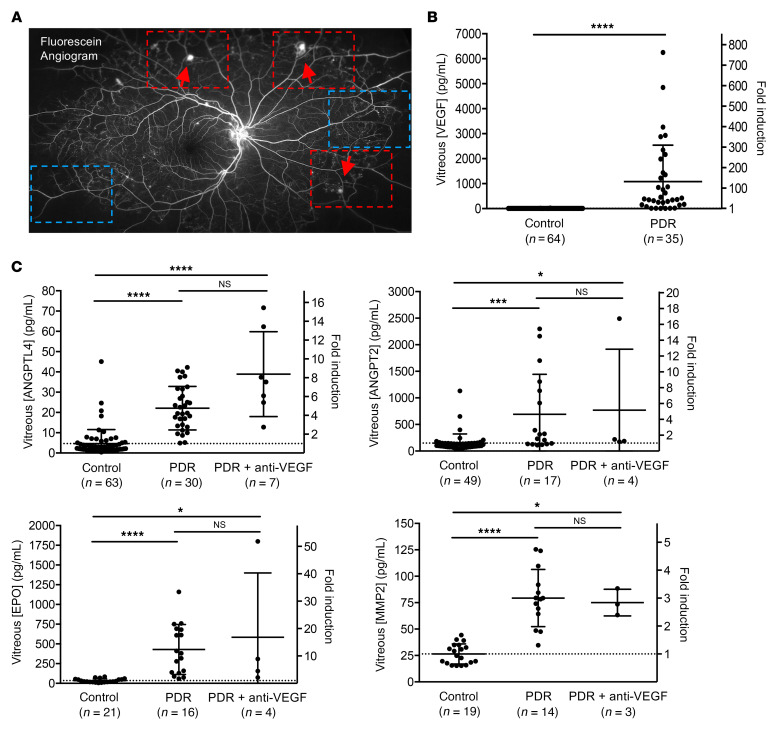
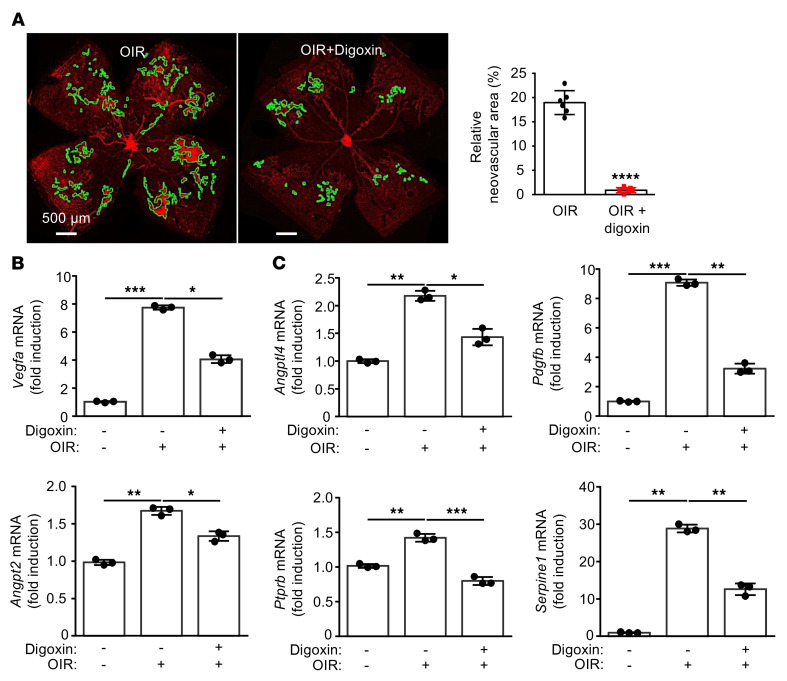
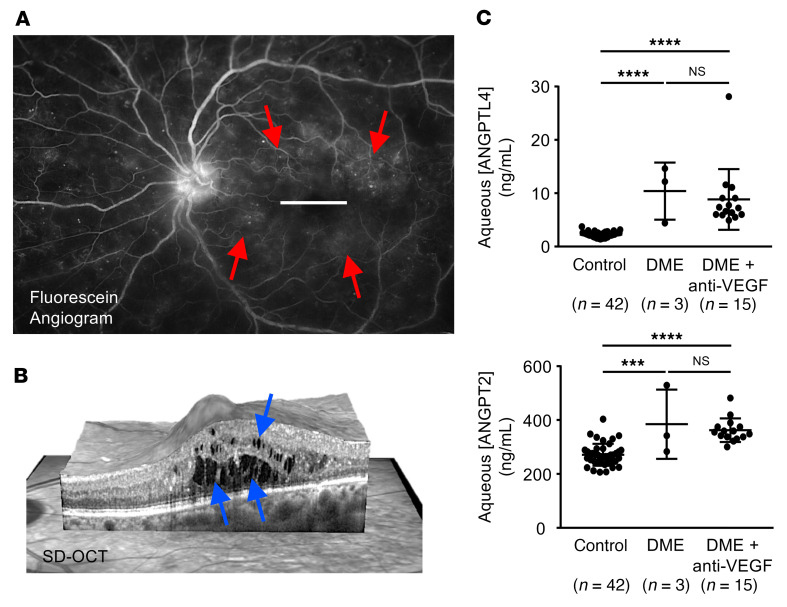
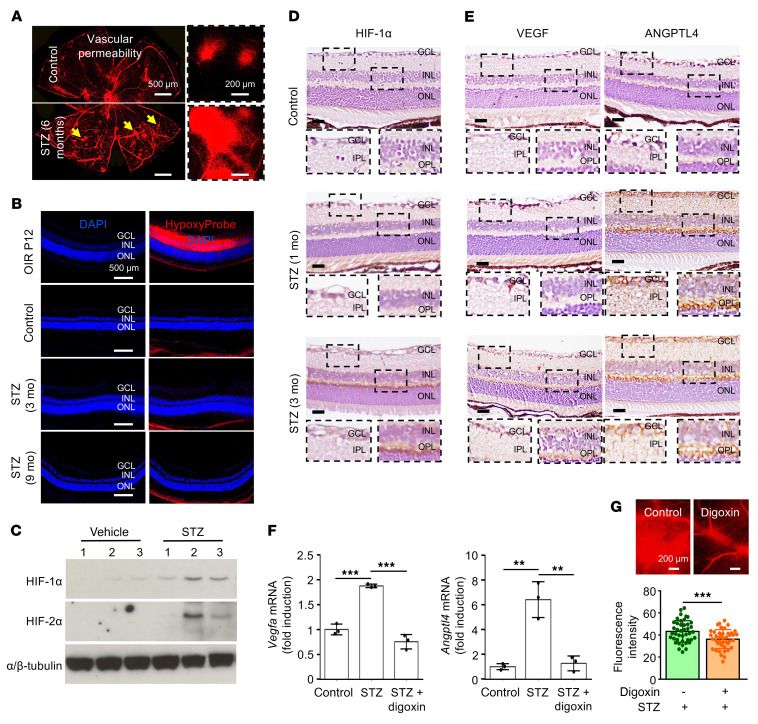
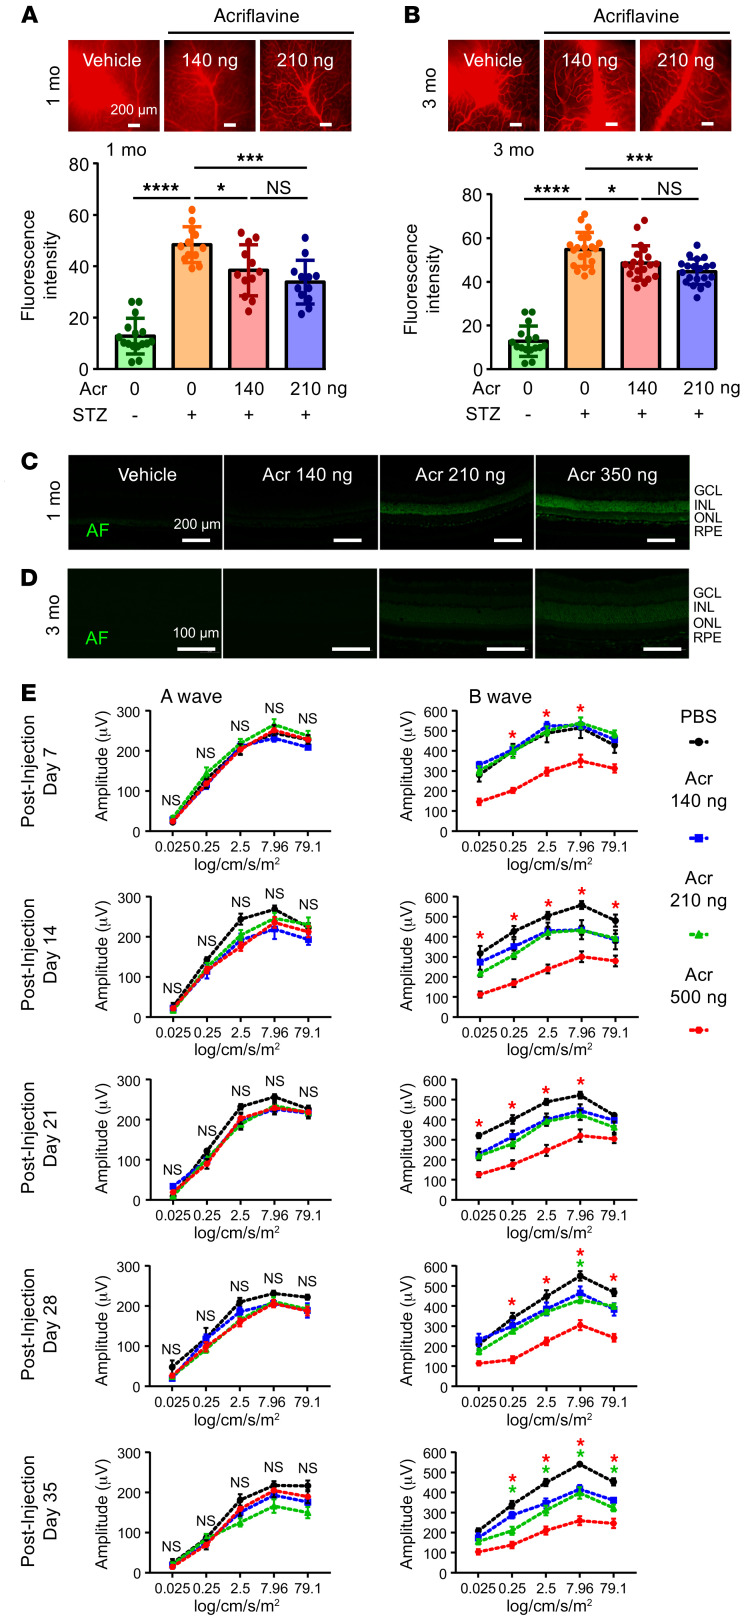
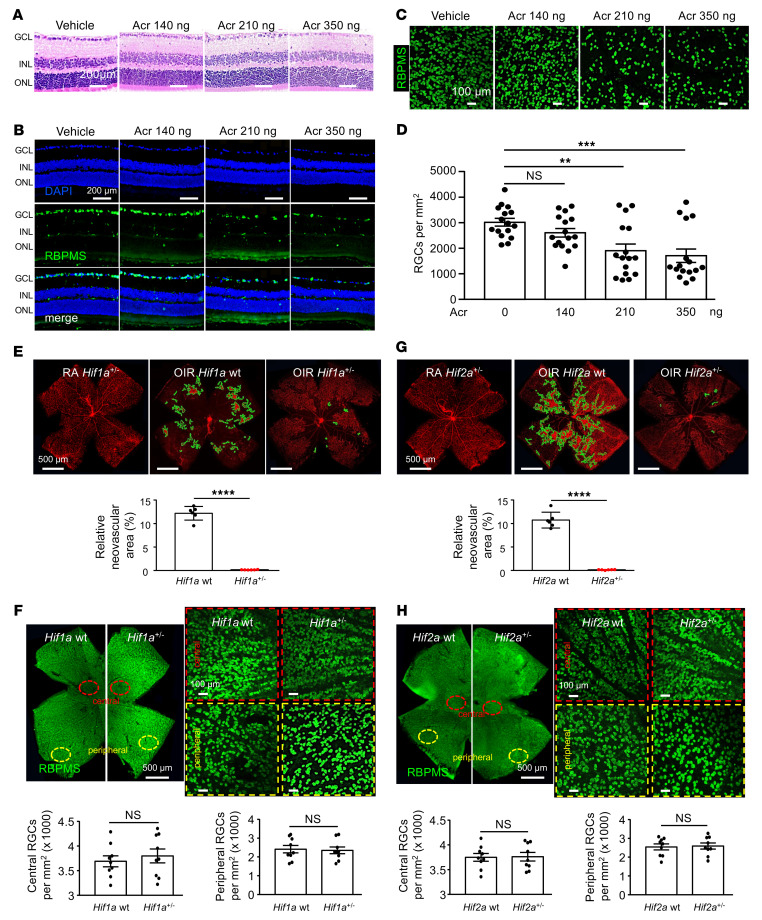
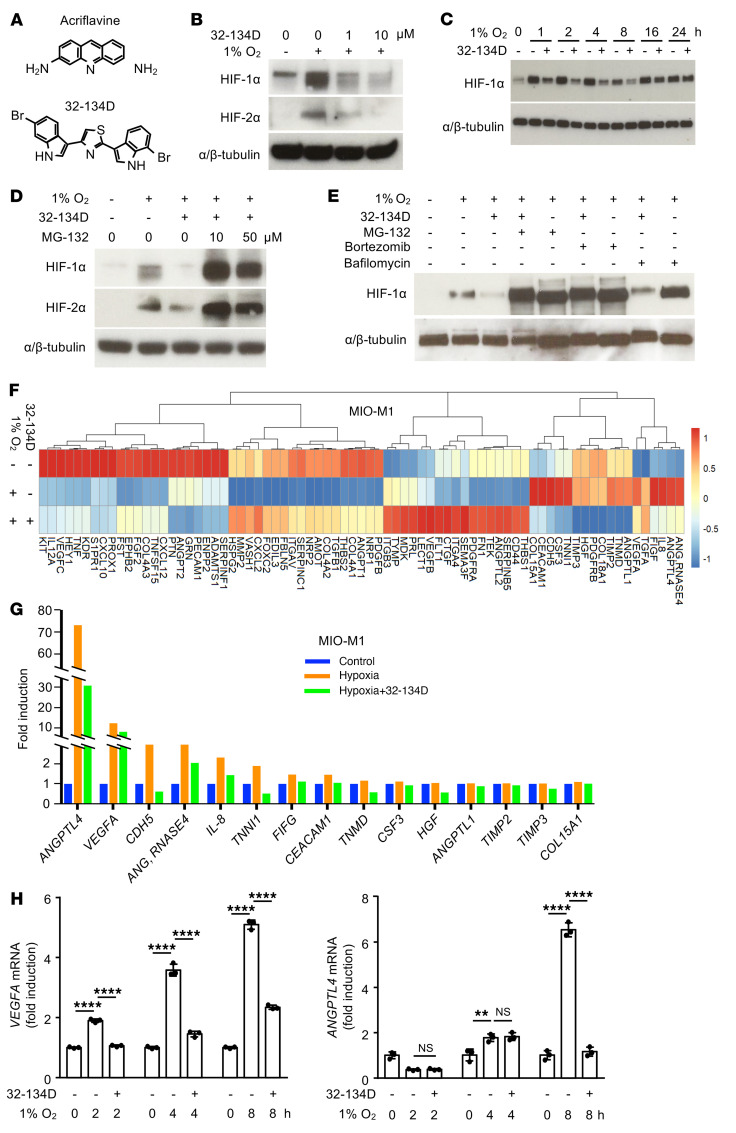
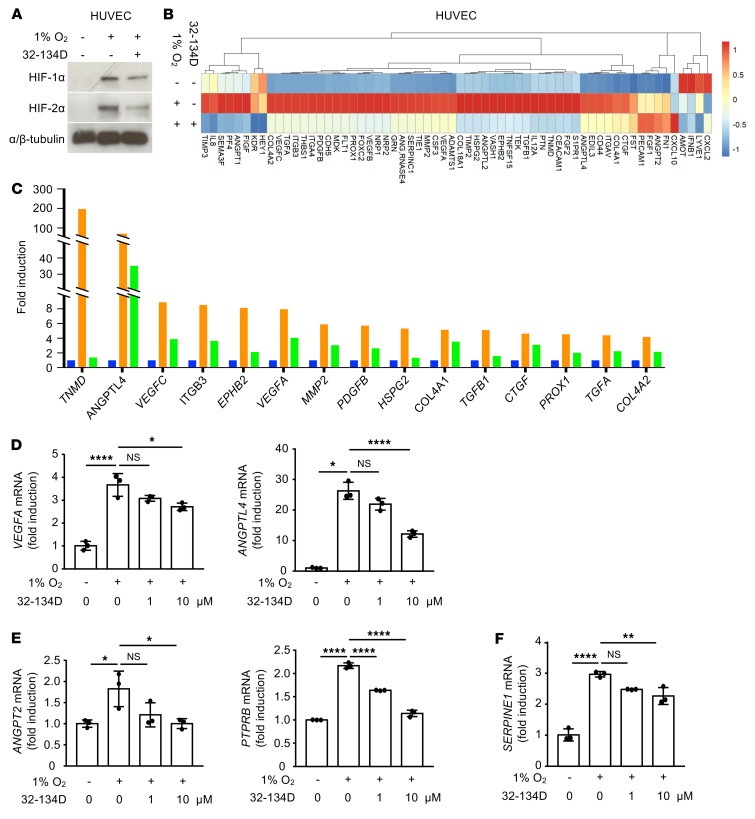
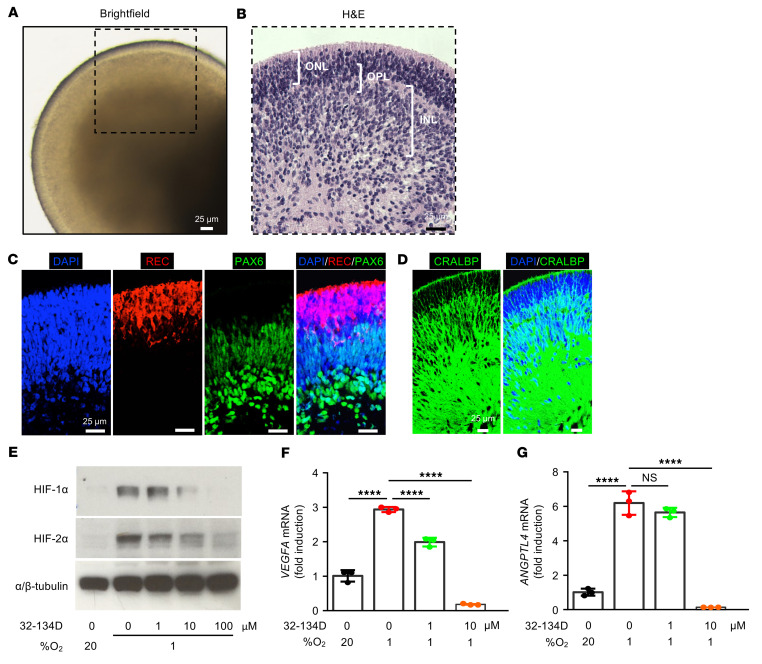
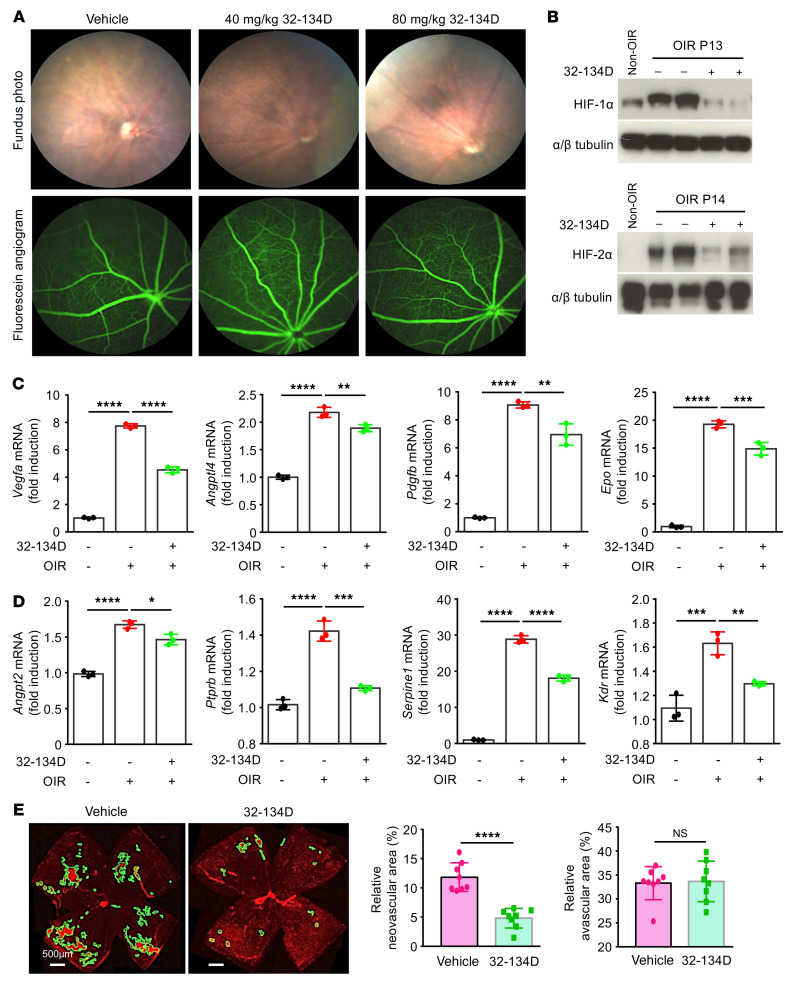
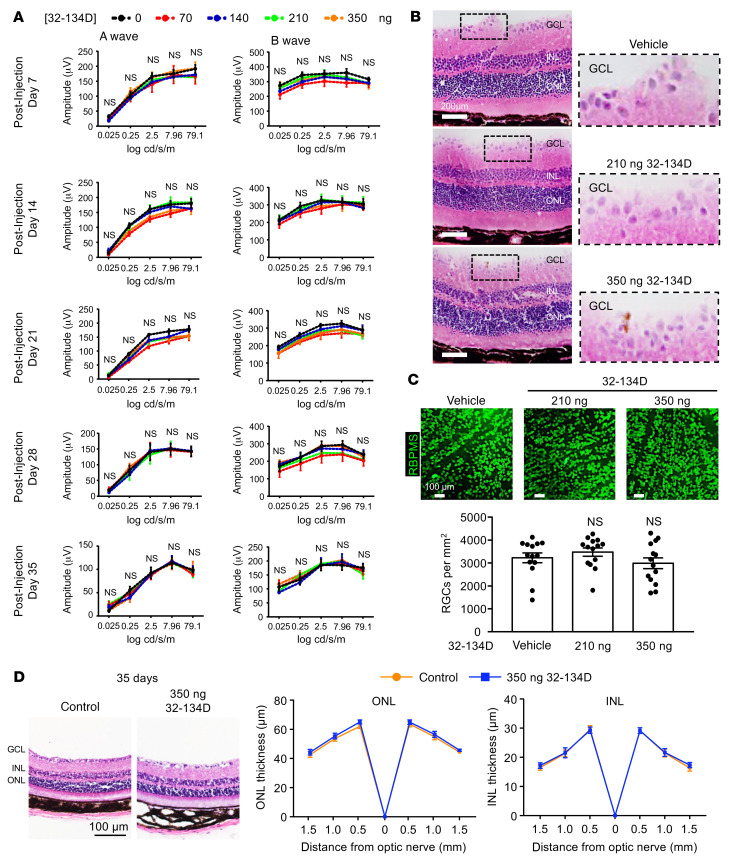
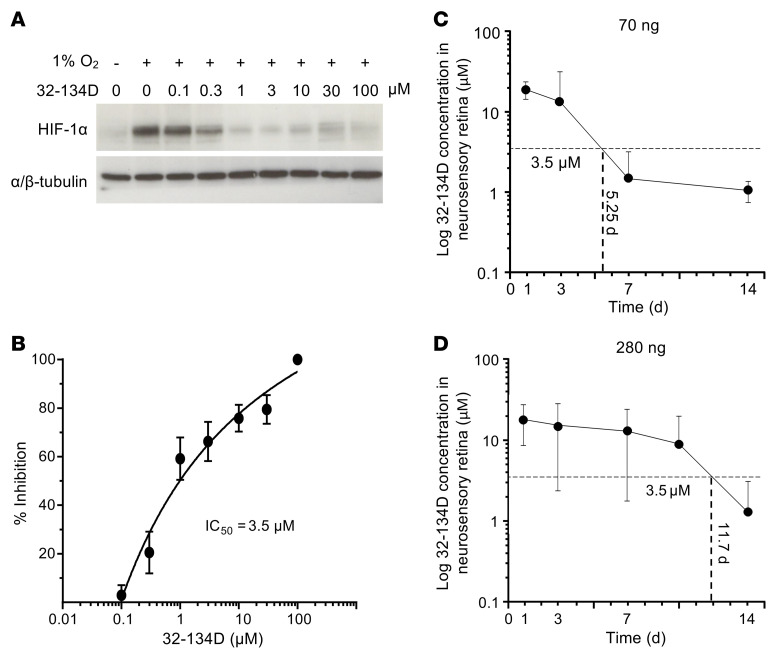
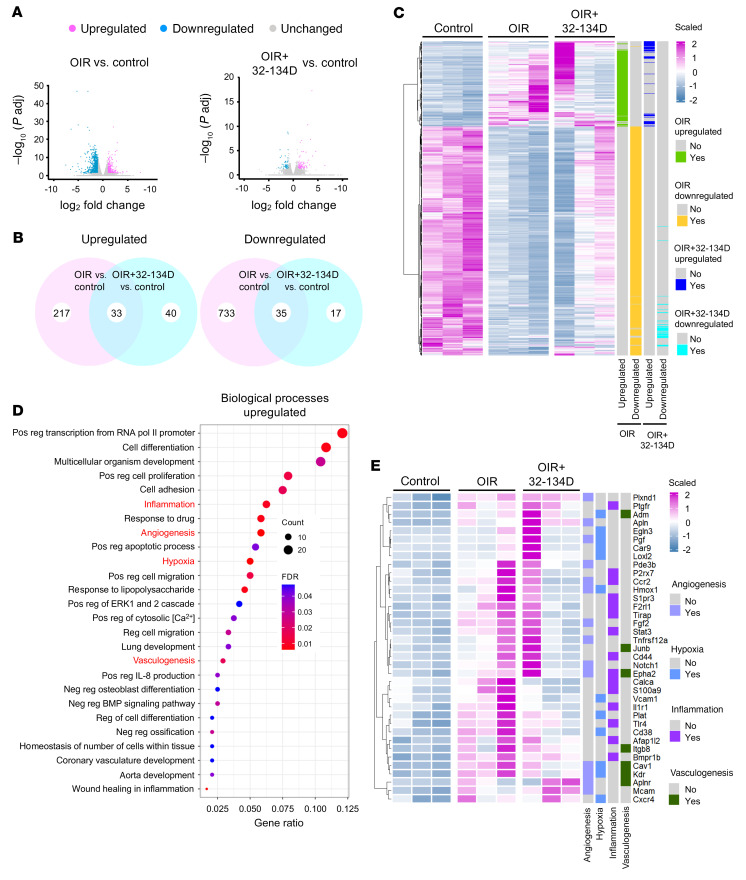
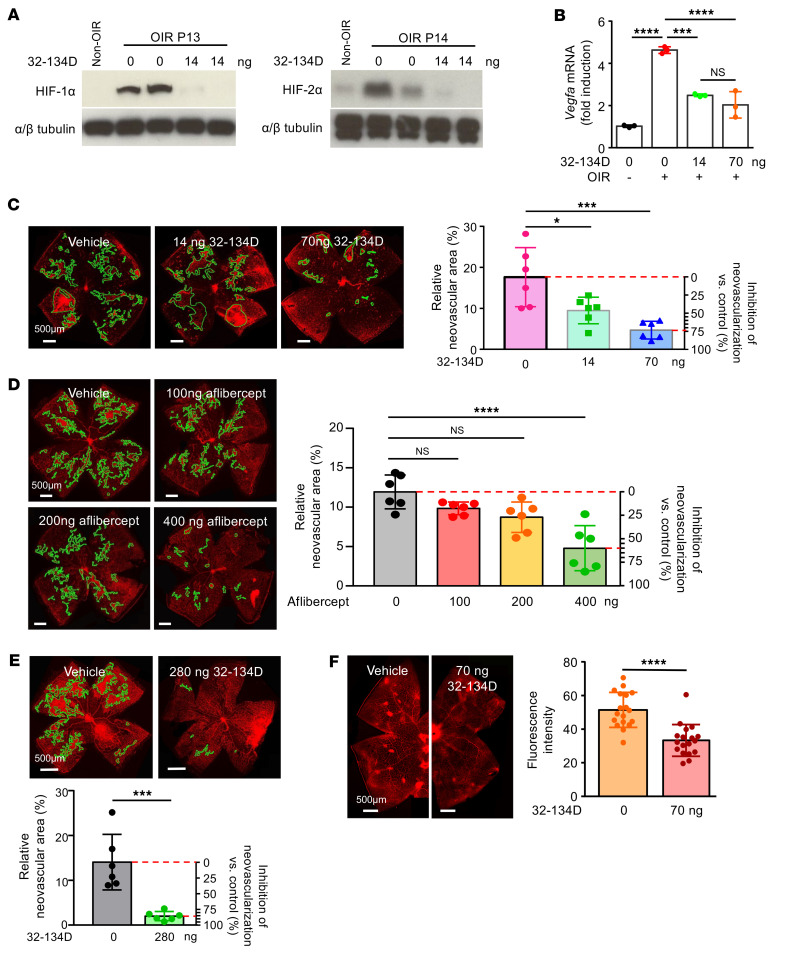
Many patients with diabetic eye disease respond inadequately to anti-VEGF therapies, implicating additional vasoactive mediators in its pathogenesis. We demonstrate that levels of angiogenic proteins regulated by HIF-1 and -2 remain elevated in the eyes of people with diabetes despite treatment with anti-VEGF therapy. Conversely, by inhibiting HIFs, we normalized the expression of multiple vasoactive mediators in mouse models of diabetic eye disease. Accumulation of HIFs and HIF-regulated vasoactive mediators in hyperglycemic animals was observed in the absence of tissue hypoxia, suggesting that targeting HIFs may be an effective early treatment for diabetic retinopathy. However, while the HIF inhibitor acriflavine prevented retinal vascular hyperpermeability in diabetic mice for several months following a single intraocular injection, accumulation of acriflavine in the retina resulted in retinal toxicity over time, raising concerns for its use in patients. Conversely, 32-134D, a recently developed HIF inhibitor structurally unrelated to acriflavine, was not toxic to the retina, yet effectively inhibited HIF accumulation and normalized HIF-regulated gene expression in mice and in human retinal organoids. Intraocular administration of 32-134D prevented retinal neovascularization and vascular hyperpermeability in mice. These results provide the foundation for clinical studies assessing 32-134D for the treatment of patients with diabetic eye disease.

Keywords: Diabetes; Mouse models; Ophthalmology; Retinopathy; Therapeutics.


Conflict of interest statement

Conflict of interest: AS and GLS are cofounders of and hold equity in HIF Therapeutics Inc. SS, YH, AS, and GLS are inventors on provisional patent application US 63/231,216.

Figures

Figure 1
Figure 1. Vitreous expression of multiple HIF-dependent vasoactive mediators is unaffected by anti-VEGF therapy in PDR.
(A) Fluorescein angiogram from a patient with PDR demonstrating areas of retinal nonperfusion with (red boxes) and without (blue boxes) retinal NV (red arrows). (B) Expression of VEGF in vitreous samples obtained from patients with PDR undergoing vitrectomy surgery who were treatment naive or who had not had anti-VEGF therapy for at least 12 weeks (PDR). (C) Expression of ANGPTL4, ANGPT2, EPO, and MMP2 in vitreous samples from patients with PDR who were treatment naive or who had not had anti-VEGF therapy for at least 12 weeks (PDR) or from patients with PDR who underwent recent treatment with anti-VEGF therapy within 6 weeks of sample collection (PDR+anti-VEGF). Vitreous samples from nondiabetic patients undergoing vitrectomy surgery for visually significant vitreous opacities (floaters) or epiretinal membranes were used as controls. Data are shown as mean ± SD. Statistical analyses were performed using 2-tailed Student’s t test (B) or 1-way ANOVA with Bonferroni’s multiple-comparison test (C). *P < 0.05; ***P < 0.001; ****P < 0.0001.
Figure 2
Figure 2. Modest inhibition of multiple HIF-dependent vasoactive mediators is sufficient for preventing retinal NV in the OIR mouse model.
(A) Left: representative images of retinal NV in P17 OIR mice following a single i.p. injection with vehicle or digoxin (2 mg/kg) at P12. Right: quantitation of retinal NV at P17. (B and C) mRNA expression of Vegf (B) or other key HIF-regulated angiogenic mediators (C) expressed by Müller glial and/or vascular cells of OIR mice at P17 following treatment with vehicle or digoxin at P12 compared with control mice. n = 4–6 animals for each condition. Data are represented as mean ± SD. Statistical analyses were performed using 2-tailed Student’s t test (A) or 1-way ANOVA with Bonferroni’s multiple-comparison test (B and C). *P < 0.05; **P < 0.01; ***P < 0.001; ****P < 0.0001. Scale bars: 500 μm.
Figure 3
Figure 3. Aqueous expression of HIF-dependent vasoactive mediators is unaffected by anti-VEGF therapy in DME.
(A) Fluorescein angiogram from a patient with NPDR and DME demonstrating diffuse leakage of fluid (red arrows) from retinal microaneurysms. (B) Spectral-domain optical coherence tomography (SD-OCT), providing a cross section of the macula (white line in A), demonstrating intraretinal fluid (blue arrows) in a patient with NPDR with DME. (C) Expression of ANGPTL4 and ANGPT2 in aqueous samples from patients with DME who are treatment naive or who had not been treated with anti-VEGF therapy for at least 12 weeks (DME) or from patients with DME following treatment with anti-VEGF therapy within 4 to 6 weeks of sample collection (DME+anti-VEGF). Aqueous fluid from nondiabetic patients obtained during routine cataract or vitrectomy surgery was used as control. Data are represented as mean ± SD. Statistical analyses were performed using 1-way ANOVA with Bonferroni’s multiple-comparison test. ***P < 0.001; ****P < 0.0001.
Figure 4
Figure 4. Increased expression of HIFs and HIF-regulated vasoactive mediators in a mouse model of sustained hyperglycemia in the absence of hypoxia.
(A) Representative images of vascular hyperpermeability in STZ-induced diabetic mice that have been hyperglycemic for 6 months demonstrating leakage of Evans blue dye (yellow arrows) from retinal vessels, similar to the leakage observed in the fluorescein angiogram in patients with DME. (B) Hypoxia (as measured by Hypoxyprobe) in retinal tissue in P12 OIR mice (positive control) compared with that in STZ-induced diabetic mice that have been hyperglycemic for 0 (control), 3, or 9 months. (C) Western blot demonstrating accumulation of HIF-1α or HIF-2α protein in retinal tissue in STZ-induced diabetic mice that have been hyperglycemic for 6 months; α/β-tubulin was used as a loading control. (D and E) Representative images demonstrating expression of HIF-1α (D), VEGF, and ANGPTL4 (E) by immunohistochemistry in STZ mice that were hyperglycemic for 1 month or 3 months. (F) Vegf and Angptl4 mRNA expression in STZ mice treated with digoxin. (G) Vascular hyperpermeability after digoxin treatment in STZ mice that were hyperglycemic for 6 months. n = 4–6 animals for each condition. IPL, inner plexiform layer; OPL, outer plexiform layer. Data are represented as mean ± SD. Statistical analyses were performed by 1-way ANOVA with Bonferroni’s multiple-comparison test (F) or 2-tailed Student’s t test (G). **P < 0.01; ***P < 0.001. Scale bars: 500 μm (A and B); 200 μm (D, E, and G). Original magnification, ×20 (D and E).
Figure 5
Figure 5. Acriflavine accumulates in the neurosensory retina and inhibits retinal function.
(A and B) Representative images (above) and quantitation (below) of vascular permeability in STZ mice that were hyperglycemic for 6 months and treated with a single intraocular injection with PBS (vehicle) or acriflavine (140 ng or 210 ng) 1 month (A) or 3 months (B) prior to sacrificing animals. Vascular hyperpermeability was assessed by measuring Evans blue dye leakage. (C and D) Intrinsic autofluorescence of acriflavine accumulating in the neurosensory retina 1 month (C) or 3 months (D) following a single intraocular injection at the stated doses. (E) ERG of C57BL/6 mice 7 to 35 days following a single intraocular administration with PBS (vehicle) or acriflavine (Acr) at the stated doses. n = 5 animals for each group. RPE, retinal pigment epithelium. Data are represented as mean ± SD (A and B) or mean ± SEM (E). Statistical analyses were performed using 1-way ANOVA (A and B) or 2-way ANOVA (E) with Bonferroni’s multiple-comparison test. *P < 0.05; ***P < 0.001; ****P < 0.0001. Scale bars: 200 μm (A and C); 100 μm (D). Scale bars: 100 μm.
Figure 6
Figure 6. Acriflavine induces retinal cell death.
(A) Representative images of H&E staining of retinal sections 35 days following a single intraocular injection with acriflavine at the stated doses. (B and C) Representative images of RBPMS staining of RGCs in retinal cross sections (B) and flat mounts (C) 35 days following a single intraocular injection with Acr at the stated doses. (D) Quantitation of RGCs in C. (E and G) Above: representative images of retinal NV in P17 non-OIR (RA) or OIR Hif1a+/– (E) or Hif2a+/– (G) mice compared with their WT littermates. Below: quantitation of retinal NV at P17. (F and H) Above: representative image of RBPMS staining of RGCs in central and peripheral retinal flat mounts of 6-week-old Hif1a+/– (F) or Hif2a+/– (H) mice compared with their WT littermates. Below: quantitation of RGCs in central and peripheral retinal flat mounts. n = 6 animals. Data are represented as mean ± SD. Statistical analyses were performed using 1-way ANOVA with Bonferroni’s multiple-comparison test (D) or 2-tailed Student’s t test (EH). **P < 0.01; ***P < 0.001; ****P < 0.0001. Scale bars: 100 μm (C, F and H); 200 μm (A and B); 500 μm (EH).
Figure 7
Figure 7. HIF inhibitor 32-134D effectively inhibits HIF accumulation and expression of HIF-regulated genes in MIO-M1 cells.
(A) Chemical structures of acriflavine (above) and 32-134D (below). (B) Western blot demonstrating inhibition of HIF-1α and HIF-2α accumulation by 32-134D (1 or 10 μM) in MIO-M1 cells cultured in hypoxia (1% O2) for 4 hours. (C) Western blot demonstrating inhibition of HIF-1α accumulation by 32-134D (10 μM) in MIO-M1 cells cultured in hypoxia for 1 to 24 hours. (D) Effect of MG-132 on 32-134D inhibition of HIF-1α and HIF-2α accumulation in MIO-M1 cells cultured in hypoxia for 4 hours. (E) Effect of MG-132 (10 μM), bortezomib (10 μM), or bafilomycin (10 nM) on 32-134D inhibition of HIF-1α accumulation in MIO-M1 cells cultured in hypoxia for 4 hours. (F) Clustering analysis of angiogenesis array by qPCR screening for MIO-M1 cells cultured in the absence or presence of 32-134D and 1% O2 (hypoxia) or 20% O2 (normoxia) for 8 hours. Expression values were scaled in row direction, and “complete” was the default method in clustering method. (G) Multiple angiogenic genes were upregulated in cells cultured in hypoxia compared with control in angiogenesis array. (H) VEGF and ANGPTL4 mRNA expression in MIO-M1 cells cultured in hypoxia (at indicated times) treated with vehicle or 32-134D (10 μM). Data are represented as mean ± SD. Statistical analyses were performed using 2-way ANOVA with Bonferroni’s multiple-comparison test. **P < 0.01; ****P < 0.0001.
Figure 8
Figure 8. HIF inhibitor 32-134D effectively inhibits HIF accumulation and expression of HIF-regulated genes in endothelial cells.
(A) Western blot demonstrating inhibition of HIF-1α and HIF-2α accumulation by 32-134D (10 μM) in HUVECs cultured in hypoxia for 4 hours. (B) Clustering analysis of angiogenesis array by qPCR screening for HUVECs cultured in the absence or presence of 32-134D and 1% O2 (hypoxia) or 20% O2 (normoxia) for 16 hours. Expression values were scaled in row direction, and “complete” was the default method in clustering method. (C) Multiple angiogenic genes were upregulated in cells cultured in hypoxia compared with control in angiogenesis array. (DF) VEGF, ANGPTL4 (D), ANGPT2, PTPRB (E), and SERPINE1 (F) mRNA expression in HUVECs cultured in hypoxia for 16 hours and treated with vehicle or 32-134D (10 μM). Data are represented as mean ± SD. Statistical analyses were performed using 1-way ANOVA test with Bonferroni’s multiple-comparison test. *P < 0.05; **P < 0.01; ****P < 0.0001.
Figure 9
Figure 9. 32-134D inhibits HIF accumulation and expression of HIF-regulated genes in hiPSC-derived 3D retinal organoids.
(A) Representative bright-field image of D120 retinal organoid derived from hiPSCs. (B) H&E staining of D120 hiPSC-derived retinal organoid. (C and D) Representative immunofluorescence images of D120 hiPSC-derived retinal organoid demonstrating staining for Pax6 and recoverin (REC) (C) and CRALBP (D). (E) Inhibition of HIF-1α and HIF-2α accumulation in D120 hiPSC-derived retinal organoids cultured in 1% O2 for 12 hours and treated with 32-134D at indicated doses. (F and G) VEGF (F) and ANGPTL4 (G) mRNA expression D120 hiPSC-derived retinal organoids cultured in 1% O2 for 12 hours and treated with 32-134D at indicated doses. n = 6–10 retinal organoids per condition. Data are represented as mean ± SD. Statistical analyses were performed using 1-way ANOVA with Bonferroni’s multiple-comparison test. ****P < 0.0001. Scale bars: 25 μm.
Figure 10
Figure 10. Systemic administration of a well-tolerated dose of 32-134D inhibits HIF and HIF-regulated gene expression and effectively treats retinal vascular disease in mice.
(A) Representative fundus photos (above) and fluorescein angiographic images (below) of the retina of BL/6 mice on day 30 following 5 daily i.p. injections (day 0 to day 5) with 32-134D at 40 or 80 mg/kg compared with vehicle control. n = 3 animals (6 eyes) per group. (B) HIF-1α and HIF-2α protein accumulation at P13 and P14, respectively, 24 hours after a single i.p. injection with 32-134D (20 mg/kg) in OIR mice. (C and D) mRNA expression of HIF-regulated vasoactive mediators Vegfa, Angptl4, Pdgfb, and Epo (C) and endothelial cell genes Angpt2, Ptprb, Serpine1, and Kdr (D) in OIR mice treated with 5 consecutive (P12–P16) i.p. injections with 20 mg/kg 32-134D or vehicle control. (E) Left: representative images of retinal NV (outlined) at P17 after daily treatment with 20 mg/kg 32-134D or vehicle control (P12-16). Right: quantitation of avascular retina and retinal NV at P17. n = 3–8 animals per condition. Data are represented as mean ± SD. Statistical analyses were performed using 1-way ANOVA with Bonferroni’s multiple-comparison test (C and D) or 2-tailed Student’s t test (E). *P < 0.05; **P < 0.01; ***P < 0.001; ****P < 0.0001. Scale bars: 500μm.
Figure 11
Figure 11. Intraocular administration 32-134D does not affect retinal function.
(A) ERG of C57BL/6 mice 7 to 35 days following a single intraocular administration with vehicle or 32-134D at the stated doses. (B) Representative images of H&E staining of retinal sections 35 days following a single intraocular injection with 32-134D at the stated doses. (C) Top: representative images of RBPMS staining of RGCs in retinal flat mounts 35 days following a single intraocular injection with 32-134D at the stated doses. Bottom: quantitation of RGCs. (D) Left: representative images of H&E staining of retinal sections 35 days following a single intraocular injection with 32-134D at 350 ng. Right: quantitation of ONL and INL thickness. n = 5 animals for each group. Data are represented as mean ± SEM (A) or mean ± SD (C and D). Statistical analyses were performed by 2-way ANOVA (A) or 1-way ANOVA (C) with Bonferroni’s multiple-comparison test. Scale bars: 200 μm (B); 100 μm (C and D). Original magnification, ×20.
Figure 12
Figure 12. Calculations for effective dose of 32-134D following intraocular administration.
(A) Accumulation of HIF-1α protein in MIO-M1 cells cultured in hypoxia and treated with 32-134D at indicated does. (B) Quantitation of immunoblots of HIF-1α protein accumulation in 32-134D–treated MIO-M1 cells cultured in hypoxia demonstrated an IC50 of 3.5 μM. (C) Concentration-time profiles of 32-134D in mice treated with a single intraocular injection with 32-134D (70 ng). The concentration of 32-134D in the neurosensory retina exceeded the in vitro IC50 of 3.5 μM for at least 5.25 days. (D) Concentration-time profiles of 32-134D in mice treated with a single intraocular injection with 32-134D (280 ng). Retina tissue was obtained over 14 days, with 32-134D concentrations determined by LC-MS/MS (C and D). The concentration of 32-134D in the neurosensory retina exceeded the in vitro IC50 of 3.5 μM for at least 11.7 days. n = 3 animals per condition. Data are represented as mean ± SD (C and D) and mean ± SEM (B).
Figure 13
Figure 13. Gene expression changes following intraocular administration of 32-134D.
Transcriptional analysis of retinal tissue of OIR mice at P17 following treatment with a single intraocular injection with DMSO (vehicle; OIR) or 32-134D (70 ng/μl; OIR+32-134D) at P12 compared with non-OIR (control) P17 mice. (A) Volcano plots illustrating DEGs in OIR versus non-OIR control mice (left) or OIR+32-134D versus OIR mice (right). (B) Venn diagrams showing overlap of 33 upregulated (left) and 35 downregulated (right) DEGs in OIR versus control (pink) and OIR+32-134D versus control (cyan), respectively. (C) Clustering analysis of identified DEGs among control, OIR, and OIR+32-134D. (D) GO analysis representing biological process enriched by 250 upregulated DEGs that were statistically significant (FDR < 0.05; red) or nonsignificant (FDR > 0.05; blue) between OIR and control. The size of the dots represents the count. The gene ratio describes the ratio of the count to the number of all DEGs. (E) Heatmap of top 37 upregulated DEGs in OIR and OIR+32-134D compared with control further enriched from 4 identified biological functions (highlighted in red in D). Bulk RNA-Seq analysis was performed from 3 independent isolations (n = 3 mice in each group). See Methods for details of statistical analyses performed. padj, adjusted P value; pos, positive; neg, negative; reg, regulation.
Figure 14
Figure 14. Intraocular administration of a well-tolerated dose of 32-134D reduces retinal NV and vascular hyperpermeability in mouse models of diabetic eye disease.
(A) Western blot of HIF-1α and HIF-2α expression in OIR mice at P13 (left) and P14 (right), respectively, following a single intraocular injection with 32-134D (14 ng). (B) mRNA expression of Vegf in OIR mice treated with a single intraocular injection of 32-134D (14 or 70 ng) or vehicle control. (C and D) Left: representative images of retinal NV at P17 in OIR mice after a single intraocular injection of 32-134D (14 and 70 ng; C) or aflibercept (100, 200, or 400 ng; D) at P12. Right: quantitation (or reduction) of retinal NV compared with untreated control at P17. (E) Above: representative images of retinal NV at P17 in OIR mice after a single intraocular injection with 280 ng 32-134D at P12. Below: quantitation (or reduction) of retinal NV compared with untreated control at P17 in OIR mice after a single intraocular injection with 32-134D (280 ng). (F) Above: representative images of vascular hyperpermeability as demonstrated by leakage of intravascular Evans blue dye in STZ mice that were hyperglycemic for 6 months before treatment with 32-134D (or vehicle) 5 days prior to sacrifice. Below: quantitation of vascular hyperpermeability. n = 4–6 animals per condition. Data are represented as mean ± SD. Statistical analyses were performed using 1-way ANOVA with Bonferroni’s multiple-comparison test (BE) or 2-tailed Student’s t test (F). *P < 0.05; **P < 0.01; ****P < 0.0001. Scale bar: 500 μm.

Similar articles

Cited by

References

    1. Bunch KL, et al. Novel therapeutics for diabetic retinopathy and diabetic macular edema: a pathophysiologic perspective. Front Physiol. 2022;13:831616. doi: 10.3389/fphys.2022.831616. - DOI - PMC - PubMed
    1. Duh EJ, et al. Diabetic retinopathy: current understanding, mechanisms, and treatment strategies. JCI Insight. 2017;2(14):e93751. doi: 10.1172/jci.insight.93751. - DOI - PMC - PubMed
    1. Wykoff CC, et al. Retinal non-perfusion in diabetic retinopathy. Eye (Lond) 2022;36(2):249–256. doi: 10.1038/s41433-021-01649-0. - DOI - PMC - PubMed
    1. Paulus YM, Sodhi A. Anti-angiogenic therapy for retinal disease. Handb Exp Pharmacol. 2017;242:271–307. doi: 10.1007/164_2016_78. - DOI - PMC - PubMed
    1. Li X, et al. Anti-vascular endothelial growth factor injections: the new standard of care in proliferative diabetic retinopathy? Dev Ophthalmol. 2017;60:131–142. doi: 10.1159/000459699. - DOI - PubMed

Publication types

MeSH terms

Substances