. 2023 Jul 17;133(14):e170191.
doi: 10.1172/JCI170191.

Single-cell transcriptomic analysis of renal allograft rejection reveals insights into intragraft TCR clonality

Affiliations

Single-cell transcriptomic analysis of renal allograft rejection reveals insights into intragraft TCR clonality

Tiffany Shi et al. J Clin Invest. .

Abstract

Bulk analysis of renal allograft biopsies (rBx) identified RNA transcripts associated with acute cellular rejection (ACR); however, these lacked cellular context critical to mechanistic understanding of how rejection occurs despite immunosuppression (IS). We performed combined single-cell RNA transcriptomic and TCR-α/β sequencing on rBx from patients with ACR under differing IS drugs: tacrolimus, iscalimab, and belatacept. We found distinct CD8+ T cell phenotypes (e.g., effector, memory, exhausted) depending upon IS type, particularly within expanded CD8+ T cell clonotypes (CD8EXP). Gene expression of CD8EXP identified therapeutic targets that were influenced by IS type. TCR analysis revealed a highly restricted number of CD8EXP, independent of HLA mismatch or IS type. Subcloning of TCR-α/β cDNAs from CD8EXP into Jurkat 76 cells (TCR-/-) conferred alloreactivity by mixed lymphocyte reaction. Analysis of sequential rBx samples revealed persistence of CD8EXP that decreased, but were not eliminated, after successful antirejection therapy. In contrast, CD8EXP were maintained in treatment-refractory rejection. Finally, most rBx-derived CD8EXP were also observed in matching urine samples, providing precedent for using urine-derived CD8EXP as a surrogate for those found in the rejecting allograft. Overall, our data define the clonal CD8+ T cell response to ACR, paving the next steps for improving detection, assessment, and treatment of rejection.

Keywords: Immunology; Organ transplantation; T cell receptor; T cells; Transplantation.


Figures

Figure 1
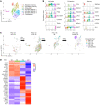
Figure 1. scRNA-Seq analysis of transplanted kidney allografts.
Single-cell suspensions from 13 different biopsies (3 without rejection, 10 with rejection) were individually subjected to 5′ scRNA-Seq on the 10× platform with V(D)J sequencing. After alignment using Cell Ranger, cells with more than 25% mitochondrial content and less than 200 genes, including additional low-quality cells, were removed, and samples were integrated using Seurat. (A and B) UMAP plots display cell contribution by sample and cell type. (C) Expression of “signature” genes across cell types. Blue color intensity reflects the expression level of individual genes within given cells. (D) Separation of samples based on rejection status. UMAP plots show cells from no-rejection samples (gray, left plot) versus rejection samples (pink, right plot). (E) Frequency of cell types within each sample displayed in bar graphs. Statistical analyses reveal a significantly increased proportion of immune infiltration in the rejection samples (n = 10) compared with the no-rejection samples (n = 3). Two-tailed t test, ****P < 0.0001.
Figure 2
Figure 2. Diverse immune cells infiltrate during kidney allograft rejection.
Index samples from the 10 participants undergoing rejection were integrated, clusters annotated as nonimmune cells were removed, and the data were renormalized and reclustered using Seurat. (A) UMAP plot shows immune-cell clusters and accompanying annotations. (B) Violin plots display the relative gene expression levels of indicated genes across each cluster. (C) Samples were segregated according to maintenance IS type. UMAP plots show immune-cell clustering of samples from participants with rejection under tacrolimus (left plot, shades of mustard), belatacept (middle plot, shades of blue), or iscalimab (right plot, shades of pink) maintenance IS. (D) Frequency of cell types within each sample displayed in bar graphs. Statistical analyses revealed a significantly increased proportion of CD8+ T cells in the immune infiltration as compared with other immune subtypes (n = 10). One-way ANOVA. ***P < 0.0006; **P < 0.007.
Figure 3
Figure 3. Analysis of infiltrating CD8+ T cells in kidney allograft rejection.
CD8+ clusters from the immune-cell analysis were identified for further analyses; CD4+ and γ/δ T cells were removed. The samples were then reanalyzed using Seurat. (A) UMAP plot shows cell-type annotations based on DEGs. (B) Violin plots show relative expression levels of indicated genes selected to characterize cell-cluster phenotypes as activated, exhausted, and memory. (C) Pie charts display number and frequency of CD8EXP found in the biopsy during rejection by participant sample, based on their unique CDR3α/β sequences. Expanded clonotypes are defined as having more than 2 cells with identical CDR3α/β sequences. Different colors represent individual expanded clonotypes (gray area represents unexpanded clonotypes), and the sizes of the colored areas represent the relative sizes of the expanded clonotypes. (D) Percentages (left graph) and total numbers (right graph) of CD8EXP in each treatment group (tacrolimus, n = 4; belatacept, n = 3; iscalimab, n = 3) are displayed in the bar graphs (±SD). One-way ANOVA; NS, P > 0.05. (E) Full-length TCRs with unique CDR3α/β sequences derived from 5 CD8EXP from 1 participant experiencing rejection (ISCAL_1) were subcloned into individual Jurkat 76 cells. Individual clones were cultured in triplicate either alone or with donor or third-party T cell–depleted PBMCs for 20 hours and IL-2 levels in the supernatant measured via ELISA. Results show the levels of IL-2 in pg/ml for each condition (±SD) done in triplicate (n = 3). One-way ANOVA. *P < 0.05.
Figure 4
Figure 4. Gene expression differences in CD8EXP among tacrolimus, belatacept, and iscalimab maintenance IS.
(A) Clustering of CD8EXP based on maintenance IS type. UMAP plots show clustering of CD8EXP (colored dots) versus CD8UNEXP (gray dots) from participants under either tacrolimus (left plot, shades of mustard); belatacept (right plot, shades of blue); or iscalimab (middle plot, shades of pink) maintenance IS. (B) Bar graphs display the fraction of expanded clonotypes (tacrolimus, belatacept, or iscalimab) and unexpanded clonotypes contributing to each CD8+ T cell cluster. (C) Violin plots show the relative expression of indicated genes in CD8EXP and CD8UNEXP. (D) Heatmap displays (average) expression of unsupervised DEGs (P < 0.05) in CD8EXP under tacrolimus (n = 4), belatacept (n = 3), and iscalimab (n = 3) maintenance IS. Blue text denotes 3 TNF family member genes, and red text denotes FKBP1A, a target of tacrolimus. (E) Heatmap displays a supervised analysis of the average expression of mTOR pathway–related genes in CD8EXP from participants under tacrolimus, belatacept, and iscalimab maintenance IS.
Figure 5
Figure 5. Temporal scRNA-Seq analysis of the response to antirejection therapy under tacrolimus maintenance IS.
A participant on tacrolimus IS (TAC_3) was diagnosed with ACR 1B on PTD 217, and a biopsy was obtained prior to antirejection treatment with rATG and steroids. A second biopsy was obtained on PTD 232, and the participant was diagnosed with a borderline lesion. A third biopsy was taken at PTD 295, and the participant was diagnosed with no rejection. (A) Pie charts display number and frequency of expanded clonotypes found in the index biopsy (PTD 217) and subsequent follow-up biopsies (PTD 232, PTD 295). Bar graph shows overlapping clonotypes across the 3 time points. (B) UMAP shows CD8+ clusters in an integrated analysis of all time points. (C) Violin plots show relative expression levels of indicated genes selected to characterize cell cluster phenotypes as activated, exhausted, and memory. (D) Temporal analysis of CD8EXP following antirejection therapy. UMAP plots show clustering of CD8EXP (colored dots) versus CD8UNEXP (gray dots) cells from the participant at PTD 217 (left plot), PTD 232 (middle plot), or PTD 295 (right plot). CD8EXP first expanded on PTD 217 are shown in pink, those first expanding on PTD 232 are shown in green, and those first expanding on PTD 295 are shown in blue. (E) Heatmap shows average expression of unsupervised DEGs (P < 0.05) found between CD8EXP at each time point.
Figure 6
Figure 6. Temporal scRNA-Seq analysis of the response to antirejection therapy under belatacept maintenance IS.
A participant on belatacept IS (BELA_1) was diagnosed with ACR 2A on PTD 111 and a biopsy was obtained prior to antirejection treatment with rATG and steroids. A second biopsy was obtained on PTD 125, and the participant was diagnosed with a borderline lesion. (A) Pie charts display number and frequency of expanded clonotypes found in the index biopsy (PTD 111) and the subsequent follow-up biopsy (PTD 125). Bar graph shows overlapping clonotypes across the 2 time points. (B) UMAP shows CD8+ clusters in an integrated analysis of both time points. (C) Violin plots show relative expression levels of indicated genes selected to characterize cell cluster phenotypes as activated, exhausted, and memory. (D) Temporal analysis of CD8EXP following antirejection therapy. UMAP plots show clustering of CD8EXP (colored dots) versus CD8UNEXP (gray dots) from the participant at PTD 111 (left plot) and PTD 125 (right plot). CD8EXP first expanded on PTD 111 are shown in pink, and those first expanding on PTD 125 are shown in blue. (E) Heatmap shows average expression of unsupervised DEGs found between CD8EXP at each time point.
Figure 7
Figure 7. Temporal scRNA-Seq analysis of the response to antirejection therapy under iscalimab maintenance IS.
A participant on iscalimab IS (ISCAL_1) was diagnosed with ACR 1A on PTD 60, and a biopsy was obtained prior to antirejection treatment with tacrolimus. A second biopsy was obtained on PTD 78, and the participant was diagnosed with no rejection. A third biopsy was taken at PTD 336, and the participant was again diagnosed with no rejection. (A) Pie charts display number and frequency of expanded clonotypes found in the index biopsy (PTD 60) and subsequent follow-up biopsies (PTD 78, PTD 336). Bar graph shows overlapping clonotypes across the 3 time points. (B) UMAP shows CD8+ clusters in an integrated analysis of all time points. (C) Violin plots show relative expression levels of indicated genes selected to characterize cell cluster phenotypes as activated, exhausted, and memory. (D) Temporal analysis of CD8EXP following antirejection therapy. UMAP plots show clustering of CD8EXP (colored dots) versus CD8UNEXP (gray dots) from the participant at PTD 60 (left plot), PTD 78 (middle plot), or PTD 336 (right plot). CD8EXP emerging on PTD 60 are shown in pink, those emerging on PTD 78 are shown in green, and those emerging on PTD 336 are shown in blue. (E) Heatmap shows average expression of unsupervised DEGs (P < 0.05) found between CD8EXP at each time point.
Figure 8
Figure 8. Comparison of CD8EXP between the biopsy and paired urine samples in a participant undergoing treatment-refractory rejection.
A participant on iscalimab IS (ISCAL_3) was diagnosed with ACR 1B on PTD 137, and a biopsy was obtained prior to antirejection treatment with tacrolimus conversion and steroids. A second biopsy was obtained on PTD 151, and the participant was diagnosed with ACR 1B. MMF was then added to the antirejection regimen. A third biopsy was taken at PTD 179, and the participant was diagnosed as borderline and MMF was tapered off. A final biopsy was taken at PTD 291 and showed mixed 1B rejection. (A and B) Pie charts (top) display number and frequency of expanded clonotypes found at each biopsy (A) and urine (B) sample, and bar graphs (bottom) display clonotypes found at the indicated time points. Different colors represent individual expanded clonotypes (gray area represents unexpanded clonotypes), and the size of the colored area represents the relative size of the expanded clonotypes. (C) Venn diagrams display overlap of individual CD8EXP clonotypes between biopsies and their paired urine sample at the indicated time points.
Figure 9
Figure 9. Temporal scRNA-Seq analysis of treatment-refractory rejection under iscalimab maintenance IS.
(A) Allograft-derived CD8+ T cells from all time points from participant ISCAL_3 were integrated and renormalized, and UMAP plot shows individual CD8+ clusters based on DEGs. Note that some clusters are unique to individual time points. (B) Violin plots show relative expression levels of indicated genes selected to characterize cell cluster phenotypes as activated, exhausted, and memory. (C) Temporal analysis of CD8EXP during treatment-refractory rejection therapy. UMAP plots show clustering of CD8EXP (colored dots) versus CD8UNEXP (gray dots) from the participant at PTD 137 (left plot), PTD 151 (middle left plot), PTD 179 (middle right plot), or PTD 291 (right plot). CD8EXP emerging on PTD 137 are shown in pink, on PTD 151 are shown in green, on PTD 179 are shown in blue, and those emerging on PTD 291 are shown in purple. (D) Heatmap shows average expression of unsupervised DEGs found between expanded clonotypes at each time point.

Update of

Similar articles

Cited by

References

    1. Wojciechowski D, Wiseman A. Long-term immunosuppression management: opportunities and uncertainties. Clin J Am Soc Nephrol. 2021;16(8):1264–1271. doi: 10.2215/CJN.15040920. - DOI - PMC - PubMed
    1. Randhawa PS, et al. The histopathological changes associated with allograft rejection and drug toxicity in renal transplant recipients maintained on FK506. Clinical significance and comparison with cyclosporine. Am J Surg Pathol. 1993;17(1):60–68. doi: 10.1097/00000478-199301000-00007. - DOI - PMC - PubMed
    1. Vincenti F, et al. Belatacept and long-term outcomes in kidney transplantation. New Engl J Med. 2016;374(4):333–343. doi: 10.1056/NEJMoa1506027. - DOI - PubMed
    1. Woodle ES, et al. Belatacept-based immunosuppression with simultaneous calcineurin inhibitor avoidance and early corticosteroid withdrawal: A prospective, randomized multicenter trial. Am J Transplant. 2020;20(4):1039–1055. doi: 10.1111/ajt.15688. - DOI - PubMed
    1. Castro Rojas CM, et al. mTOR inhibitor therapy diminishes circulating CD8+ CD28- effector memory T cells and improves allograft inflammation in belatacept-refractory renal allograft rejection. Transplantation. 2020;104(5):1058–1069. doi: 10.1097/TP.0000000000002917. - DOI - PMC - PubMed

Publication types