. 2023 May 25;21(5):e3002118.
doi: 10.1371/journal.pbio.3002118. eCollection 2023 May.

Dynamics of SARS-CoV-2 infection hospitalisation and infection fatality ratios over 23 months in England

Affiliations

Dynamics of SARS-CoV-2 infection hospitalisation and infection fatality ratios over 23 months in England

Oliver Eales et al. PLoS Biol. .

Abstract

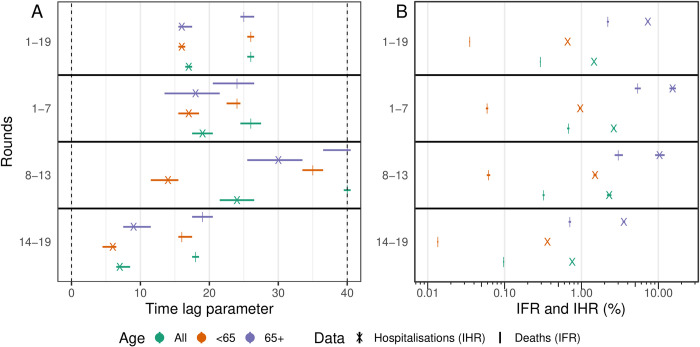
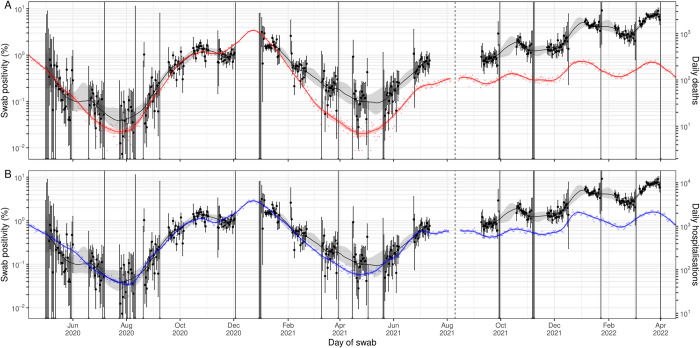
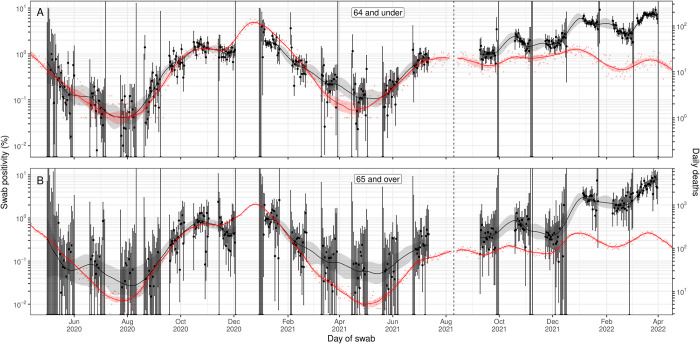
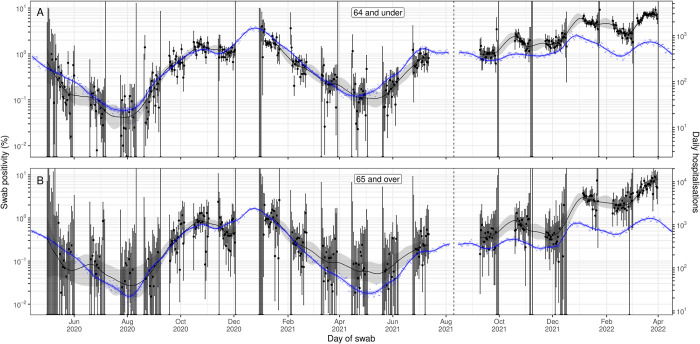
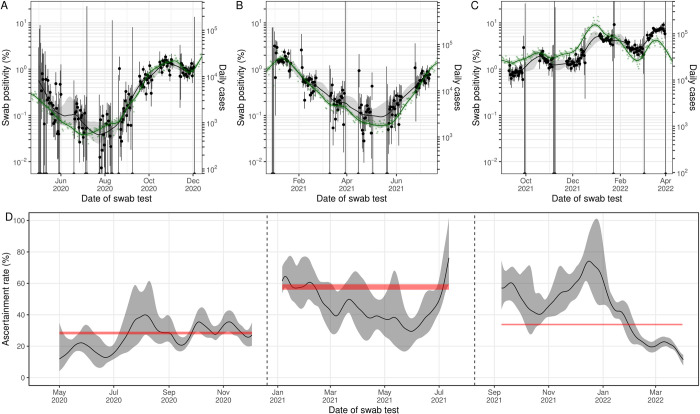
The relationship between prevalence of infection and severe outcomes such as hospitalisation and death changed over the course of the COVID-19 pandemic. Reliable estimates of the infection fatality ratio (IFR) and infection hospitalisation ratio (IHR) along with the time-delay between infection and hospitalisation/death can inform forecasts of the numbers/timing of severe outcomes and allow healthcare services to better prepare for periods of increased demand. The REal-time Assessment of Community Transmission-1 (REACT-1) study estimated swab positivity for Severe Acute Respiratory Syndrome Coronavirus 2 (SARS-CoV-2) infection in England approximately monthly from May 2020 to March 2022. Here, we analyse the changing relationship between prevalence of swab positivity and the IFR and IHR over this period in England, using publicly available data for the daily number of deaths and hospitalisations, REACT-1 swab positivity data, time-delay models, and Bayesian P-spline models. We analyse data for all age groups together, as well as in 2 subgroups: those aged 65 and over and those aged 64 and under. Additionally, we analysed the relationship between swab positivity and daily case numbers to estimate the case ascertainment rate of England's mass testing programme. During 2020, we estimated the IFR to be 0.67% and the IHR to be 2.6%. By late 2021/early 2022, the IFR and IHR had both decreased to 0.097% and 0.76%, respectively. The average case ascertainment rate over the entire duration of the study was estimated to be 36.1%, but there was some significant variation in continuous estimates of the case ascertainment rate. Continuous estimates of the IFR and IHR of the virus were observed to increase during the periods of Alpha and Delta's emergence. During periods of vaccination rollout, and the emergence of the Omicron variant, the IFR and IHR decreased. During 2020, we estimated a time-lag of 19 days between hospitalisation and swab positivity, and 26 days between deaths and swab positivity. By late 2021/early 2022, these time-lags had decreased to 7 days for hospitalisations and 18 days for deaths. Even though many populations have high levels of immunity to SARS-CoV-2 from vaccination and natural infection, waning of immunity and variant emergence will continue to be an upwards pressure on the IHR and IFR. As investments in community surveillance of SARS-CoV-2 infection are scaled back, alternative methods are required to accurately track the ever-changing relationship between infection, hospitalisation, and death and hence provide vital information for healthcare provision and utilisation.


Conflict of interest statement

The authors have declared that no competing interests exist.

Figures

Fig 1
Fig 1. Comparison of parameters obtained by fitting to different subsets of the REACT-1 data.
(A) Best-fitting time-lag parameter and 95% credible intervals for models fit to deaths (cross, time-lag between swab positivity and deaths) and hospitalisations (vertical line, time-lag between swab positivity and hospitalisations), for models fit to all age-groups (green), those aged 64 years and under (orange), and those aged 65 years and over (purple). (B) Best-fitting scaling parameter and 95% credible intervals on a log10 x-axis for models fit to deaths (cross) and hospitalisations (vertical line), for models fit to all age-groups (green), those aged 64 years and under (orange), and those aged 65 years and over (purple). All numerical values are provided in S1 Table.
Fig 2
Fig 2. Vaccination coverage and variants responsible for infections in England, as inferred from public data sets.
(A, B) Proportion of individuals who have been vaccinated with at least a single dose (green), proportion of individuals who have been vaccinated with at least 2 doses (orange), and the proportion of individuals who have received a third “booster” dose (purple), for those aged 64 years and under (A) and those aged 65 years and over (B). (C) Proportion of infections in England, for which lineages were detected, which were identified as the Omicron variant (purple), the Delta variant (orange), the Alpha variant (green), and any other lineage (pink). Data supporting this figure can be found in S1 Data.
Fig 3
Fig 3. A comparison of daily deaths and hospitalisations to swab positivity as measured by REACT-1.
Daily swab positivity for all 19 rounds of the REACT-1 study (black points with 95% credible intervals, left hand y-axis) with P-spline estimates for swab positivity (solid black line, shaded area is 95% credible interval). (A) Daily deaths in England (red points, right hand y-axis) and P-spline model estimates for expected daily deaths in England (solid red line, shaded area is 95% credible interval, right hand y-axis). The black vertical dashed line on 10 August 2021 splits the data into 2 periods: rounds 1–13 and rounds 14–19 of REACT-1. During rounds 1–13, daily deaths have been shifted by 26 days backwards in time along the x-axis. During rounds 14–19, daily deaths have been shifted by 18 days backwards in time along the x-axis. The 2 y-axes have been scaled using the population size and best-fit scaling parameter from the time-delay model fit to rounds 1–7. (B) Daily hospitalisations in England (blue points, right hand y-axis) and P-spline model estimates for expected daily hospitalisations in England (solid blue line, shaded area is 95% credible interval, right hand y-axis). The black vertical dashed line on 10 August 2021 splits the data into 2 periods: rounds 1–13 and rounds 14–19 of REACT-1. During rounds 1–13, daily hospitalisations have been shifted by 19 days backwards in time along the x-axis. During rounds 14–19, daily hospitalisations have been shifted by 7 days backwards in time along the x-axis. The 2 y-axes have been scaled using the population size and best-fit scaling parameter from the time-delay model fit to rounds 1–7 of REACT-1. Data supporting this figure can be found in S2 Data.
Fig 4
Fig 4. A comparison of daily deaths to swab positivity as measured by REACT-1, by age group.
Daily swab positivity for all 19 rounds of the REACT-1 study (black points with 95% credible intervals, left hand y-axis) with P-spline estimates for swab positivity (solid black line, shaded area is 95% credible interval) for (A) those aged 64 years and under, and (B) those aged 65 years and over. (A) Daily deaths for those aged 64 years and under in England (red points, right hand y-axis) and corresponding P-spline model estimates for the expected number of deaths (solid red line, shaded area is 95% credible interval, right hand y-axis). The black vertical dashed line on 10 August 2021 splits the data into 2 periods: rounds 1–13 and rounds 14–19 of REACT-1. During rounds 1–13, daily deaths have been shifted by 24 days backwards in time along the x-axis. During rounds 14–19, daily deaths have been shifted by 16 days backwards in time along the x-axis. The 2 y-axes have been scaled using the population size and best-fit scaling parameter from the time-delay model fit to rounds 1–7 of REACT-1. (B) Daily deaths for those aged 65 years and over in England (red points, right hand y-axis) and corresponding P-spline model estimates for the expected number of deaths (solid red line, shaded area is 95% credible interval, right hand y-axis). The black vertical dashed line on 10 August 2021 splits the data into 2 periods: rounds 1–13 and rounds 14–19 of REACT-1. During rounds 1–13, daily deaths have been shifted by 24 days backwards in time along the x-axis. During rounds 14–19, daily deaths have been shifted by 19 days backwards in time along the x-axis. The 2 y-axes have been scaled using the population size and best-fit scaling parameter from the time-delay model fit to rounds 1–7 of REACT-1. Data supporting this figure can be found in S2 Data.
Fig 5
Fig 5
A comparison of daily hospitalisations to swab positivity as measured by REACT-1, by age group. Daily swab positivity for all 19 rounds of the REACT-1 study (black points with 95% credible intervals, left hand y-axis) with P-spline estimates for swab positivity (solid black line, shaded area is 95% credible interval) for (A) those aged 64 years and under, and (B) those aged 65 years and over. (A) Daily hospitalisations for those aged 64 years and under in England (blue points, right hand y-axis) and corresponding P-spline model estimates for the expected number of hospitalisations (solid blue line, shaded area is 95% credible interval, right hand y-axis). The black vertical dashed line on 10 August 2021 splits the data into 2 periods: rounds 1–13 and rounds 14–19 of REACT-1. During rounds 1–13, daily hospitalisations have been shifted by 17 days backwards in time along the x-axis. During rounds 14–19, daily hospitalisations have been shifted by 6 days backwards in time along the x-axis. The 2 y-axes have been scaled using the population size and best-fit scaling parameter from the time-delay model fit to rounds 1–7 of REACT-1. (B) Daily hospitalisations for those aged 65 years and over in England (blue points, right hand y-axis) and corresponding P-spline model estimates for the expected number of hospitalisations (solid blue line, shaded area is 95% credible interval, right hand y-axis). Daily hospitalisations have been shifted by 18 days backwards in time along the x-axis. The black vertical dashed line on 10 August 2021 splits the data into 2 periods: rounds 1–13 and rounds 14–19 of REACT-1. During rounds 1–13, daily hospitalisations have been shifted by 18 days backwards in time along the x-axis. During rounds 14–19, daily hospitalisations have been shifted by 9 days backwards in time along the x-axis. The 2 y-axes have been scaled using the population size and best-fit scaling parameter from the time-delay model fit to rounds 1–7 of REACT-1. Data supporting this figure can be found in S2 Data.
Fig 6
Fig 6. Estimates of the IFR and IHR over 19 rounds of REACT-1.
IFR and IHR (solid black line, grey shaded region is 95% credible interval) estimated from the multiplicative difference between the REACT-1 P-splines for swab positivity and the time-delay adjusted death or hospitalisation P-splines, accounting for population size, mean duration of positivity, and test sensitivity. The 95% credible intervals of the best-fitting average IFR and IHR over rounds 1–7 (red shaded area) and rounds 14–19 (blue shaded area) estimated using time-delay models are shown for comparison (available in S1 Table). The black vertical dashed line on 10 August 2021 splits the data into 2 periods: rounds 1–13 and rounds 14–19 of REACT-1. (A) IFR across all age groups assuming a time-lag of 26 days during rounds 1–13 and 18 days during rounds 14–19. (B) IHR across all age groups assuming a time-lag of 19 days during rounds 1–13 and 7 days during rounds 14–19. (C) IFR in those aged 64 years and under assuming a time-lag of 24 days during rounds 1–13 and 16 days during rounds 14–19. (D) IHR in those aged 64 years and under assuming a time-lag of 17 days during rounds 1–13 and 6 days during rounds 14–19. (E) IFR in those aged 65 years and over assuming a time-lag of 24 days during rounds 1–13 and 19 days during rounds 14–19. (F) IHR in those aged 65 years and over assuming a time-lag of 18 days during rounds 1–13 and 9 days during rounds 14–19. Data supporting this figure can be found in S3 Data.
Fig 7
Fig 7. A comparison of daily cases to swab positivity as measured by REACT-1.
(A, B, C) Daily swab positivity for all 19 rounds of the REACT-1 study (black points with 95% credible intervals, left hand y-axis) with P-spline estimates for swab positivity (solid black line, shaded area is 95% credible interval). Daily cases in England (green points, right hand y-axis) and P-spline model for expected daily cases in England (solid green line, shaded area is 95% credible interval, right hand y-axis). The 2 y-axes have been scaled using the population size and best-fit scaling parameter from the time-delay model fit to the rounds shown in each subfigure (available in S5 Table). (A) During round 1–7, daily cases have been shifted by 3 days backwards in time along the x-axis. (B) During round 8–13, daily cases have been shifted by 7 days forwards (−7 days backwards) in time along the x-axis. (C) During round 14–19, daily cases have been shifted by 1 day backwards in time along the x-axis. (D) Estimates of the case ascertainment rate over 19 rounds of REACT-1. Case ascertainment (solid black line, grey shaded region is 95% credible interval) estimated from the multiplicative difference between the REACT-1 P-spline for swab positivity and the time-delay adjusted P-spline for daily cases, accounting for population size, mean duration of positivity, and test sensitivity. The 95% credible intervals of the best-fitting average case ascertainment rates (red shaded area) over rounds 1–7, rounds 8–13, and rounds 14–19 estimated using separate time-delay models are shown for comparison (available in S5 Table). The black vertical dashed lines split the data into 3 periods: round 1–7, rounds 8–13, and rounds 14–19 of REACT-1. During rounds 1–7, the case ascertainment was estimated assuming a time-lag of 3 days. During rounds 8–13, the case ascertainment was estimated assuming a time-lag of −7 days. During rounds 14–19, the case ascertainment was estimated assuming a time-lag of 1 days. Data supporting this figure can be found in S4 Data.

References

    1. Weekly epidemiological update on COVID-19 - 2021 May 11. [cited 2021 May 17]. Available from: https://www.who.int/publications/m/item/weekly-epidemiological-update-on...
    1. Karlinsky A, Kobak D. Tracking excess mortality across countries during the COVID-19 pandemic with the World Mortality Dataset. Elife. 2021:10. doi: 10.7554/eLife.69336 - DOI - PMC - PubMed
    1. Volz E, Mishra S, Chand M, Barrett JC, Johnson R, Geidelberg L, et al.. Assessing transmissibility of SARS-CoV-2 lineage B.1.1.7 in England. Nature. 2021. doi: 10.1038/s41586-021-03470-x - DOI - PubMed
    1. Eales O, Page AJ, Tang SN, Walters CE, Wang H, Haw D, et al.. The use of representative community samples to assess SARS-CoV-2 lineage competition: Alpha outcompetes Beta and wild-type in England from January to March 2021. Microb Genom. 2023:9. doi: 10.1099/mgen.0.000887 - DOI - PMC - PubMed
    1. Davies NG, Jarvis CI, CMMID COVID-19 Working Group, Edmunds WJ, Jewell NP, Diaz-Ordaz K, et al.. Increased mortality in community-tested cases of SARS-CoV-2 lineage B.1.1.7. Nature. 2021. doi: 10.1038/s41586-021-03426-1 - DOI - PMC - PubMed

Publication types

Supplementary concepts