

Bridging archaeology and marine conservation in the Neotropics
- PMID: 37228060
- PMCID: PMC10212122
- DOI: 10.1371/journal.pone.0285951
Bridging archaeology and marine conservation in the Neotropics
Abstract
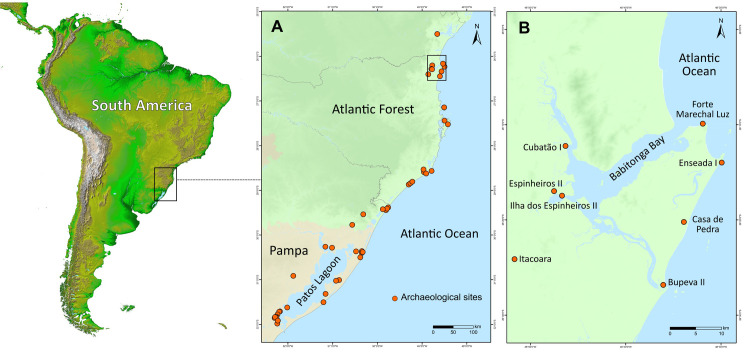
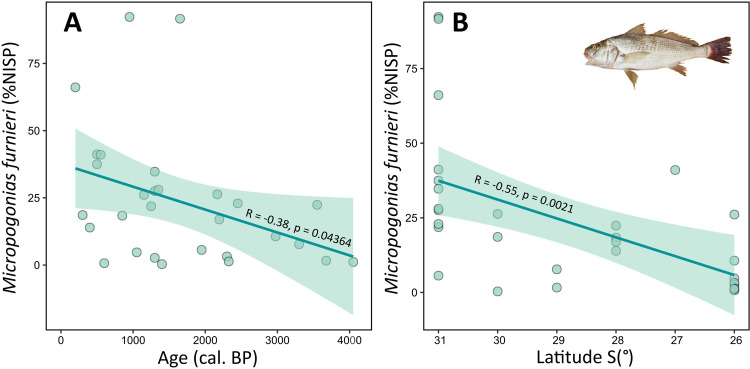
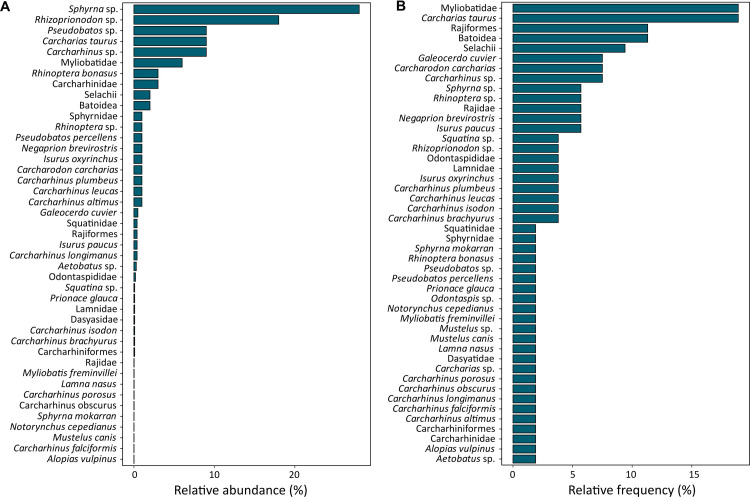
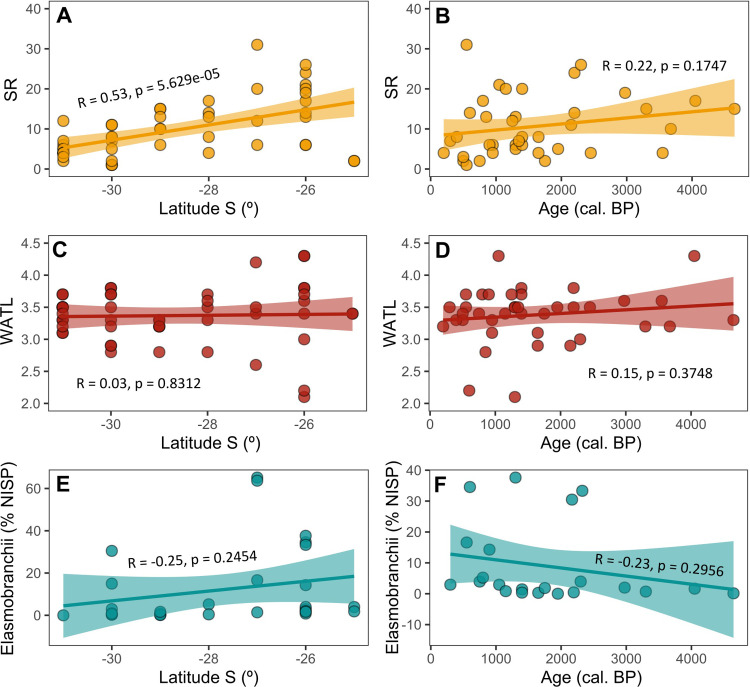
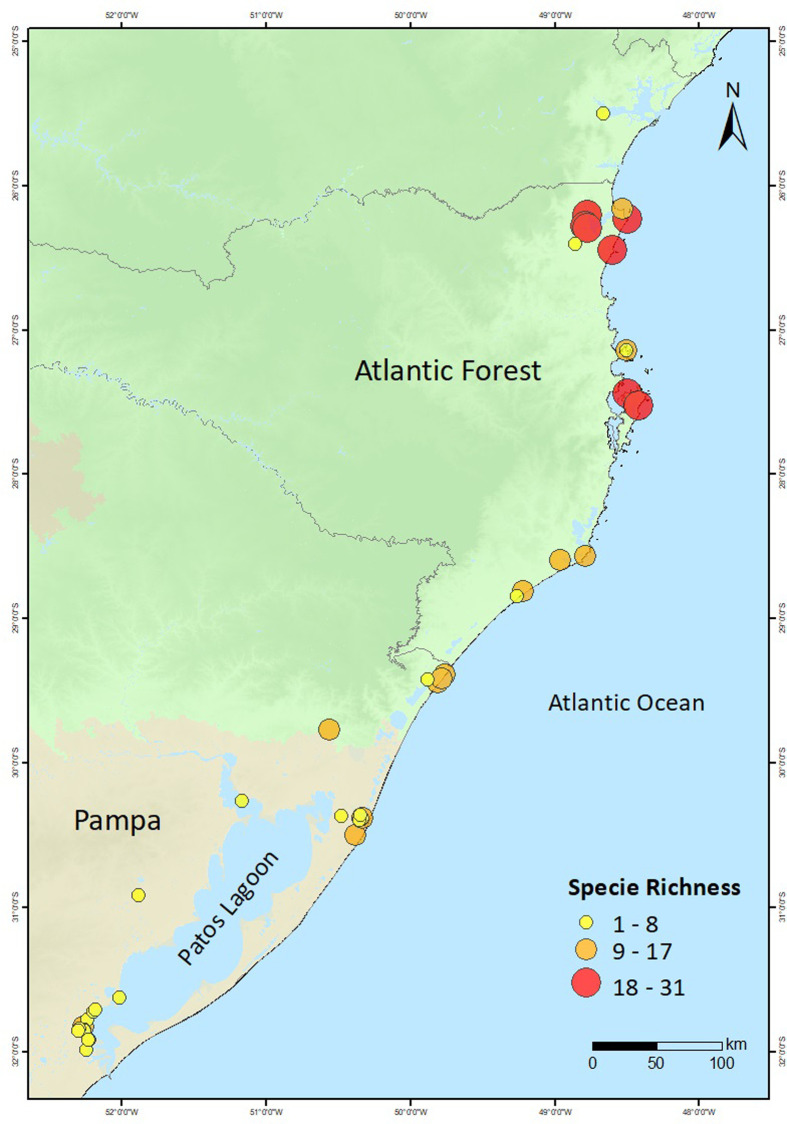
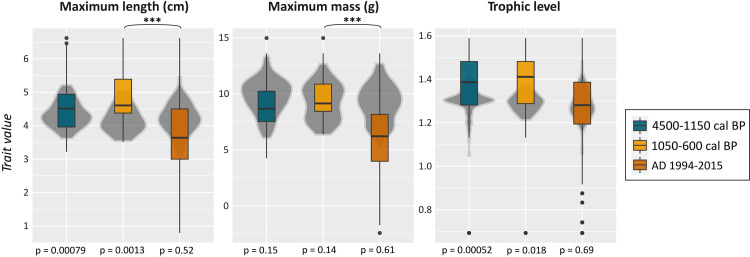
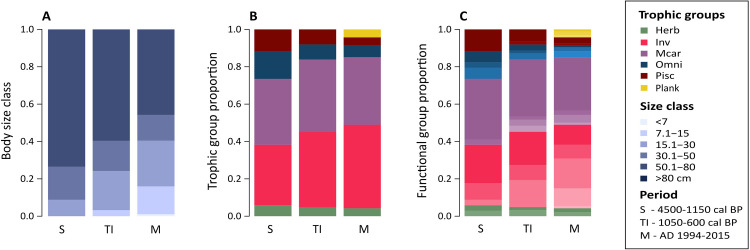
Anthropogenic impacts on tropical and subtropical coastal environments are increasing at an alarming rate, compromising ecosystem functions, structures and services. Understanding the scale of marine population decline and diversity loss requires a long-term perspective that incorporates information from a range of sources. The Southern Atlantic Ocean represents a major gap in our understanding of pre-industrial marine species composition. Here we begin to fill this gap by performing an extensive review of the published data on Middle and Late Holocene marine fish remains along the southern coast of Brazil. This region preserves archaeological sites that are unique archives of past socio-ecological systems and pre-European biological diversity. We assessed snapshots of species compositions and relative abundances spanning the last 9500 years, and modelled differences in species' functional traits between archaeological and modern fisheries. We found evidence for both generalist and specialist fishing practices in pre-European times, with large body size and body mass caught regularly over hundreds of years. Comparison with modern catches revealed a significant decline in these functional traits, possibly associated with overfishing and escalating human impacts in recent times.
Copyright: © 2023 Fossile et al. This is an open access article distributed under the terms of the Creative Commons Attribution License, which permits unrestricted use, distribution, and reproduction in any medium, provided the original author and source are credited.
Conflict of interest statement
The authors have declared that no competing interests exist.
Figures
Similar articles
-
Hydroids (Cnidaria, Hydrozoa) from Mauritanian Coral Mounds.Zootaxa. 2020 Nov 16;4878(3):zootaxa.4878.3.2. doi: 10.11646/zootaxa.4878.3.2. Zootaxa. 2020. PMID: 33311142
-
Archaeology meets marine ecology: the antiquity of maritime cultures and human impacts on marine fisheries and ecosystems.Ann Rev Mar Sci. 2010;2:231-51. doi: 10.1146/annurev.marine.010908.163749. Ann Rev Mar Sci. 2010. PMID: 21141664 Review.
-
An environmental (pre)history of European fishing: past and future archaeological contributions to sustainable fisheries.J Fish Biol. 2019 Jun;94(6):1033-1044. doi: 10.1111/jfb.13929. Epub 2019 Mar 12. J Fish Biol. 2019. PMID: 30746714 Review.
-
The Path towards Endangered Species: Prehistoric Fisheries in Southeastern Brazil.PLoS One. 2016 Jun 29;11(6):e0154476. doi: 10.1371/journal.pone.0154476. eCollection 2016. PLoS One. 2016. PMID: 27355355 Free PMC article.
-
Local ecological knowledge and scientific data reveal overexploitation by multigear artisanal fisheries in the southwestern Atlantic.PLoS One. 2014 Oct 15;9(10):e110332. doi: 10.1371/journal.pone.0110332. eCollection 2014. PLoS One. 2014. PMID: 25333661 Free PMC article.
Cited by
-
Feasting on fish. Specialized function of pre-colonial pottery of the Cerritos mound builders of southern Brazil.PLoS One. 2025 Feb 5;20(2):e0311192. doi: 10.1371/journal.pone.0311192. eCollection 2025. PLoS One. 2025. PMID: 39908222 Free PMC article.
References
-
- Pereira HM, Navarro LM, Martins IS. Global Biodiversity Change: The Bad, the Good, and the Unknown. Annu Rev Environ Resour. 2012;37: 25–50.
-
- Steffen W, Broadgate W, Deutsch L, Gaffney O, Ludwig C. The trajectory of the Anthropocene: The Great Acceleration. The Anthropocene Review. 2015;2: 81–98.
-
- de Groot RS, Wilson MA, Boumans RMJ. A typology for the classification, description and valuation of ecosystem functions, goods and services. Ecol Econ. 2002;41: 393–408.
Publication types
MeSH terms
LinkOut - more resources
Full Text Sources
Miscellaneous
