. 2023 May 23;11(1):coad032.
doi: 10.1093/conphys/coad032. eCollection 2023.

Identification of upper thermal thresholds during development in the endangered Nechako white sturgeon with management implications for a regulated river

Affiliations

Identification of upper thermal thresholds during development in the endangered Nechako white sturgeon with management implications for a regulated river

Madison L Earhart et al. Conserv Physiol. .

Abstract

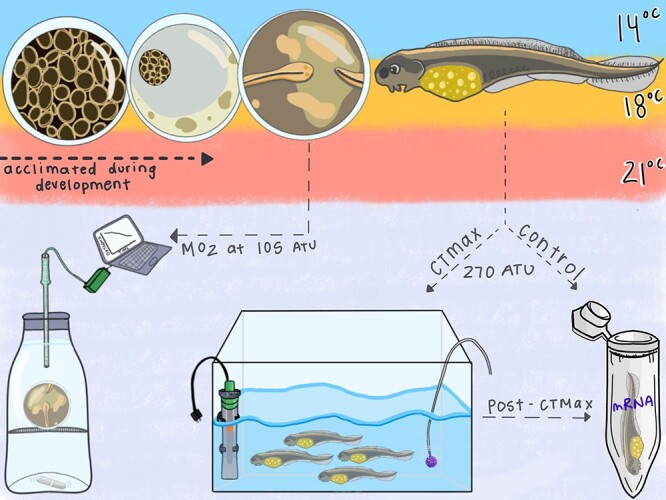
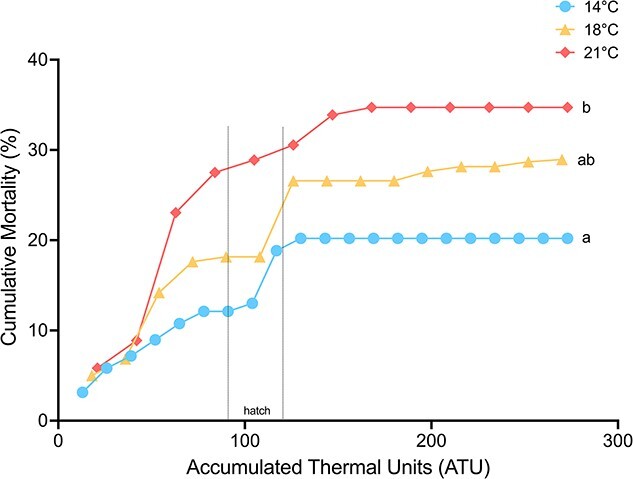
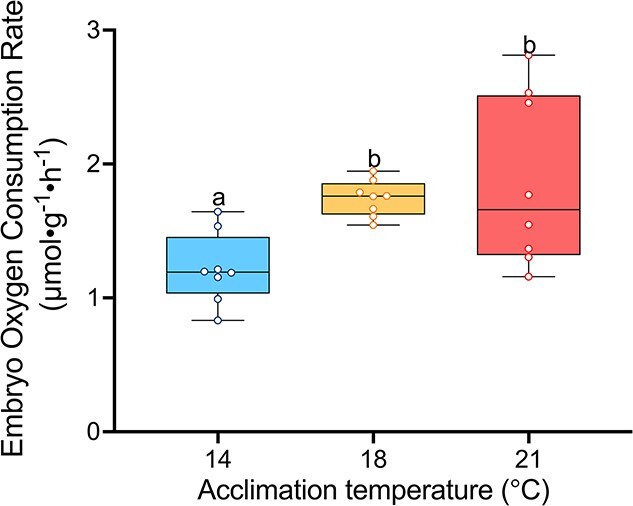
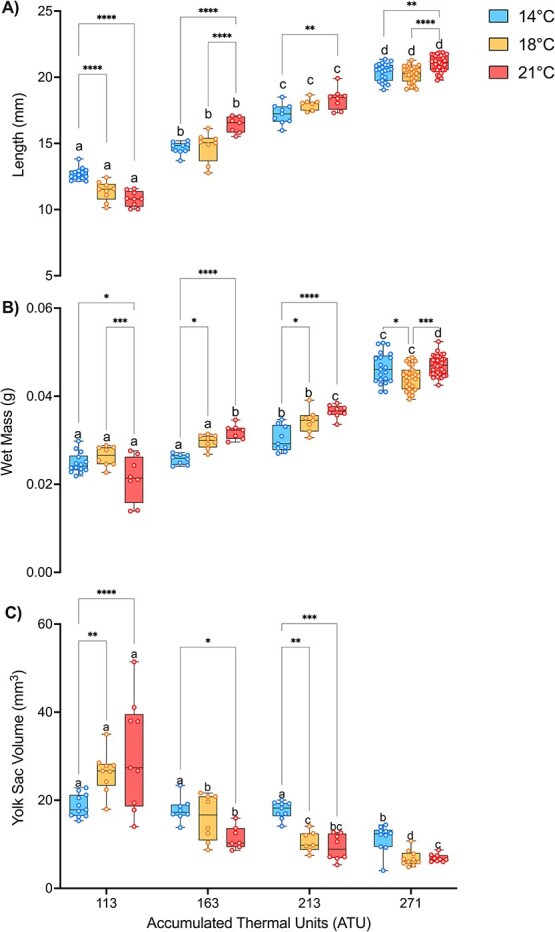
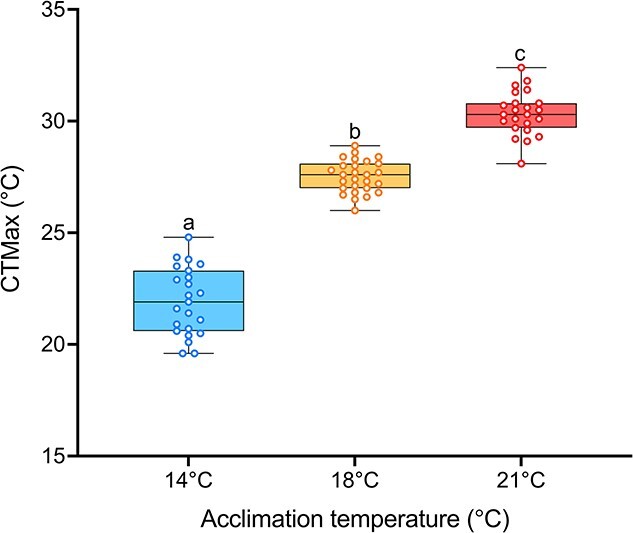
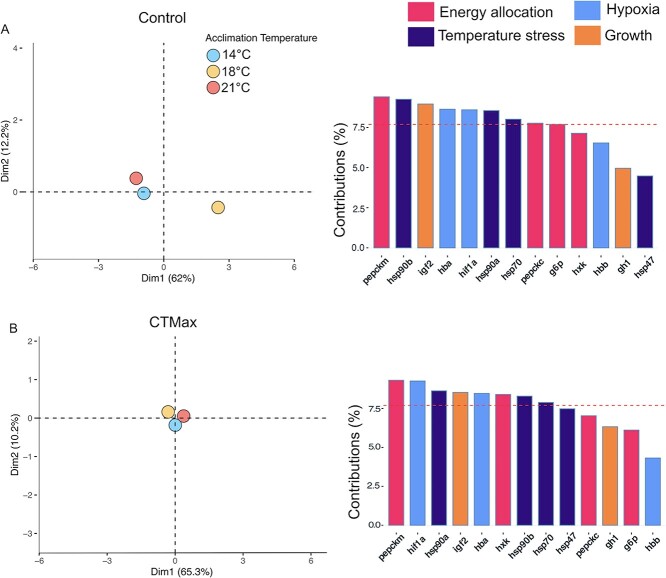
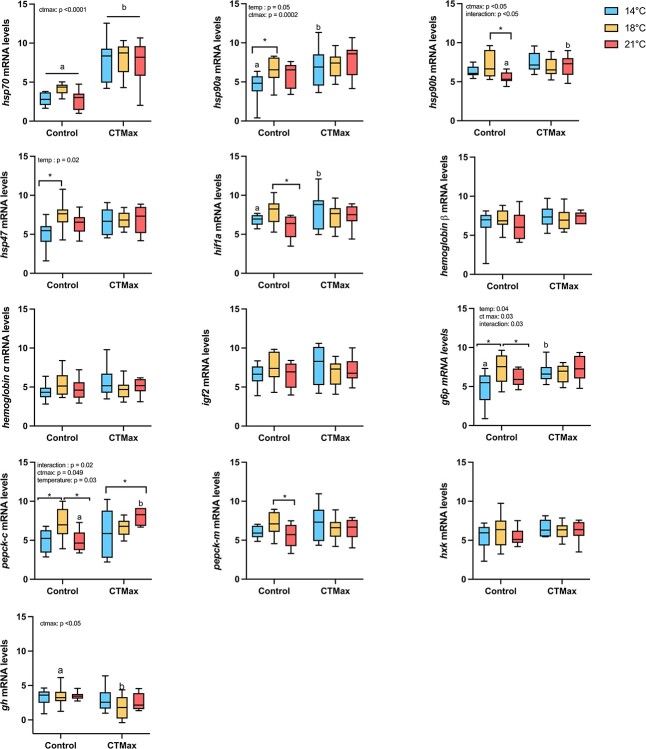
Climate change-induced warming effects are already evident in river ecosystems, and projected increases in temperature will continue to amplify stress on fish communities. In addition, many rivers globally are impacted by dams, which have many negative effects on fishes by altering flow, blocking fish passage, and changing sediment composition. However, in some systems, dams present an opportunity to manage river temperature through regulated releases of cooler water. For example, there is a government mandate for Kenney dam operators in the Nechako river, British Columbia, Canada, to maintain river temperature <20°C in July and August to protect migrating sockeye salmon (Oncorhynchus nerka). However, there is another endangered fish species inhabiting the same river, Nechako white sturgeon (Acipenser transmontanus), and it is unclear if these current temperature regulations, or timing of the regulations, are suitable for spawning and developing sturgeon. In this study, we aimed to identify upper thermal thresholds in white sturgeon embryos and larvae to investigate if exposure to current river temperatures are playing a role in recruitment failure. We incubated embryos and yolk-sac larvae in three environmentally relevant temperatures (14, 18 and 21°C) throughout development to identify thermal thresholds across different levels of biological organization. Our results demonstrate upper thermal thresholds at 21°C across physiological measurements in embryo and yolk-sac larvae white sturgeon. Before hatch, both embryo survival and metabolic rate were reduced at 21°C. After hatch, sublethal consequences continued at 21°C because larval sturgeon had decreased thermal plasticity and a dampened transcriptional response during development. In recent years, the Nechako river has reached 21°C by the end of June, and at this temperature, a decrease in sturgeon performance is evident in most of the traits measured. As such, the thermal thresholds identified here suggest current temperature regulations may not be suitable for developing white sturgeon and future recruitment.

Keywords: Conservation; development; sturgeon.


Figures

Figure 1
Figure 1
Experimental design for this study. Embryos and larvae were acclimated (in duplicate) to one of three temperatures: 14, 18 or 21°C for the duration of the experiment. Embryo metabolic rate was measured at 105 ATU. Larval critical thermal tolerance (CTmax) was measured at 270 ATU before exogenous feeding. Samples for mRNA measurement were taken from control fish and fish after CTmax for quantification of mRNA gene abundance. Illustration by Madison Earhart.
Figure 2
Figure 2
Cumulative mortality (%) of white sturgeon (Acipenser transmontanus) embryos and yolk-sac larvae throughout early development. Acclimation temperatures are represented by different colors, 14°C in blue, 18°C in yellow and 21°C in pink. Time of hatch is indicated by the dashed vertical lines on the figure. Letters represent significant differences between acclimation temperatures (P < 0.05, Cox proportional hazards model). Data are expressed as percentage cumulative mortality from time of fertilization to yolk-plug ejection (0–280 ATU; n = 400–450; 2 petri dishes per temperature each containing all families).
Figure 3
Figure 3
White sturgeon (A. transmontanus) embryo oxygen consumption rate, acclimated to three different temperatures (14°C – blue, 18°C – yellow and 21°C—pink). Measurements were conducted the day before hatch in each treatment (105 ATU). Letters that differ represent significant differences between acclimation temperatures. Data are expressed as median with quartiles and individual data points are shown (n = 8).
Figure 4
Figure 4
Morphometrics of larval white sturgeon (A. transmontanus) acclimated to three different temperatures (14°C – blue, 18°C – yellow and 21°C—pink) across ATUs. Panel A is length, panel B is wet mass and panel C is yolk-sac volume. Asterisks represent differences between temperatures within ATUs. Letters that differ represent significant differences across time within an acclimation temperature. Data are expressed as a median with quartiles and individual data points are shown (n = 7–33).
Figure 5
Figure 5
White sturgeon (A. transmontanus) larval CTmax at three different acclimation temperatures (14°C – blue, 18°C – yellow and 21°C—pink). Measurements were conducted at the start of yolk-plug ejection in each treatment (270–273 ATU). Letters that differ represent significant differences between acclimation temperatures. Data are expressed as median with quartiles and individual data points are shown (n = 23–27).
Figure 6
Figure 6
PCA of mRNA abundance of larval white sturgeon (A. transmontanus) acclimated to three different temperatures (14°C – blue, 18°C – yellow and 21°C—pink). Panel A is a PCA of mRNA levels and the genes that contribute to the PCs in acclimated and control fish. Panel B is a PCA of mRNA levels and genes that contribute to the PCs in acclimated fish after CTmax trials. Gene contribution figures are colored by different gene function: energy allocation (pink), temperature stress (dark purple), hypoxia and blood oxygenation (blue) and growth (orange). The red dashed line on both gene contribution figures indicates the default average contribution expected for each gene to the overall observed variation.
Figure 7
Figure 7
White sturgeon (A. transmontanus) larval mRNA levels for all genes measured after acclimation to three different temperatures (14°C – blue, 18°C – yellow and 21°C—pink) at control and after CTmax. Significant differences between acclimation temperatures at control or after CTmax are denoted by an asterisk. Significant differences between control and CTmax measurements within an acclimation temperature are denoted by letters. Significant two-way ANOVA effects are listed on the top of each individual gene panel.

References

    1. Albert JS, Destouni G, Duke-Sylvester SM, Magurran AE, Oberdorff T, Reis RE, Winemiller KO, Ripple WJ (2021) Scientists’ warning to humanity on the freshwater biodiversity crisis. Ambio 50: 85–94. 10.1007/s13280-020-01318-8. - DOI - PMC - PubMed
    1. Allen PJ, Nicholl M, Cole S, Vlazny A, Cech JJ (2006) Growth of larval to juvenile Green sturgeon in elevated temperature regimes. Trans Am Fish Soc 135: 89–96. 10.1577/T05-020.1. - DOI
    1. Anderson JJ, Beer WN, Israel JA, Greene S (2022) Targeting river operations to the critical thermal window of fish incubation: model and case study on Sacramento River winter-run Chinook salmon. River Research & Apps 38: 895–905. 10.1002/rra.3965. - DOI
    1. Baker DW, McAdam DSO, Boucher M, Huynh KT, Brauner CJ (2014) Swimming performance and larval quality are altered by rearing substrate at early life phases in white sturgeon, Acipenser transmontanus (Richardson, 1836). J Appl Ichthyol 30: 1461–1472. 10.1111/jai.12642. - DOI
    1. Bard B, Kieffer JD (2019) The effects of repeat acute thermal stress on the critical thermal maximum (CTmax) and physiology of juvenile shortnose sturgeon (Acipenser brevirostrum). Can J Zool 97: 567–572. 10.1139/cjz-2018-0157. - DOI