. 2023 May 9:14:1172574.
doi: 10.3389/fmicb.2023.1172574. eCollection 2023.

Plasma virome dynamics in chronic hepatitis B virus infected patients

Affiliations

Plasma virome dynamics in chronic hepatitis B virus infected patients

Marijn Thijssen et al. Front Microbiol. .

Abstract

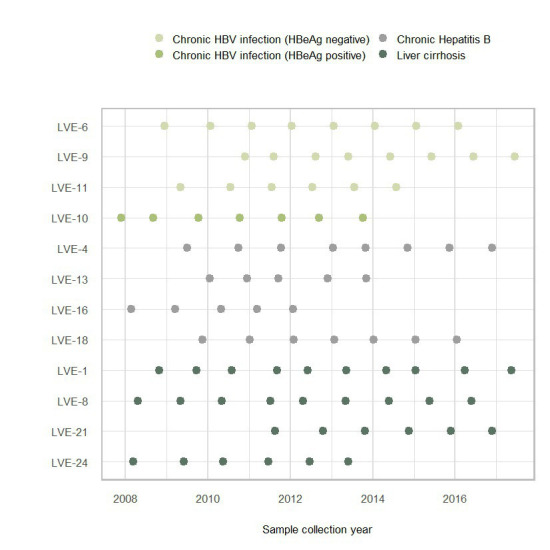
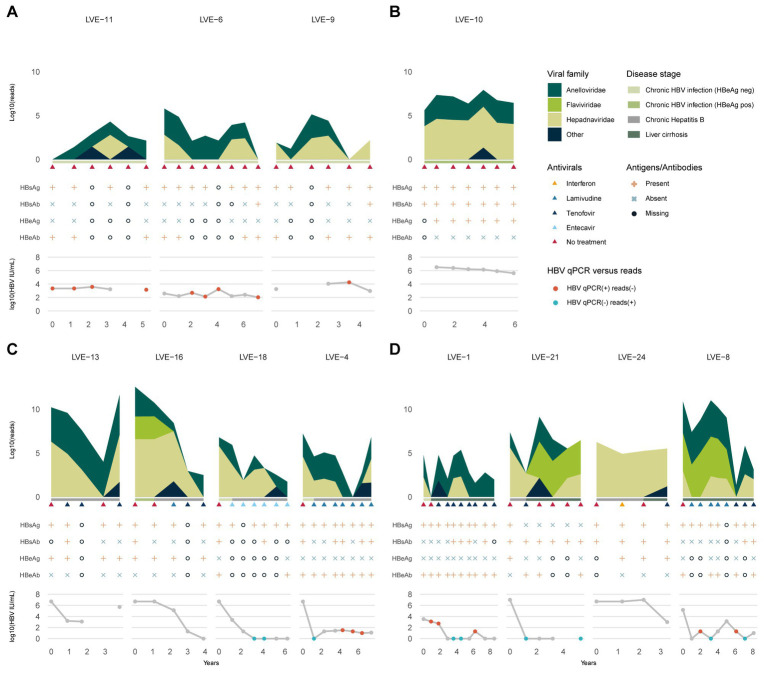
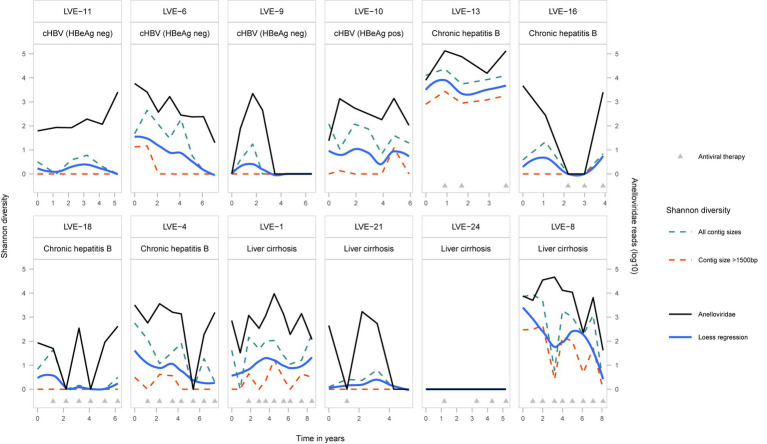
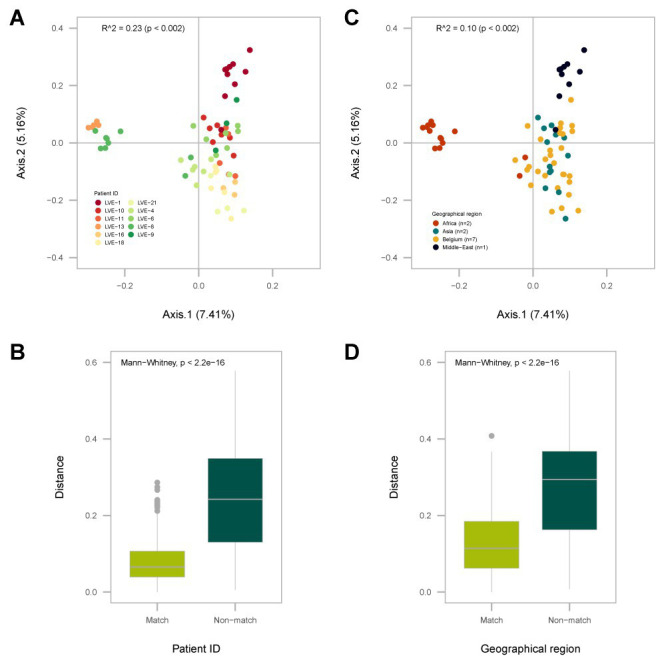
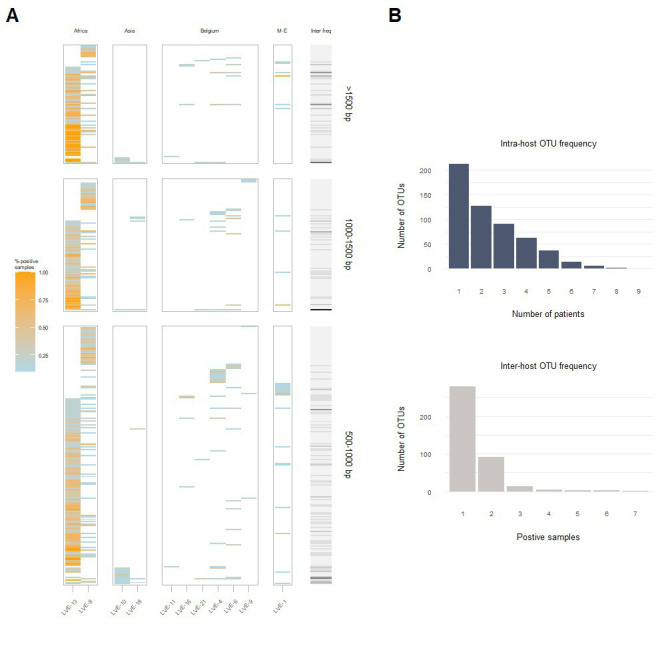
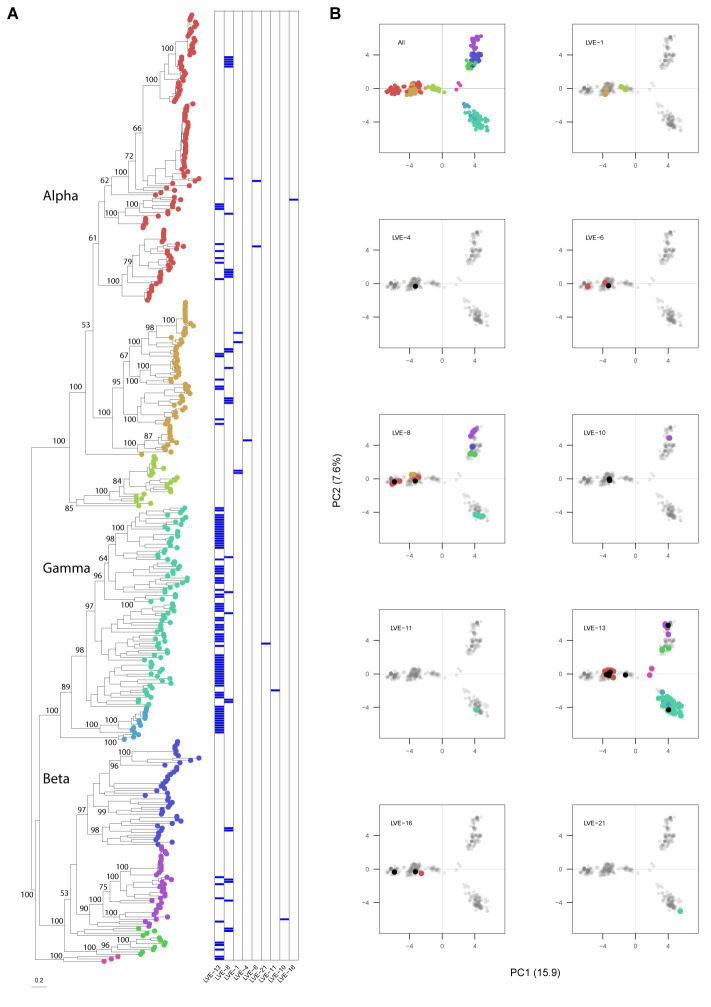
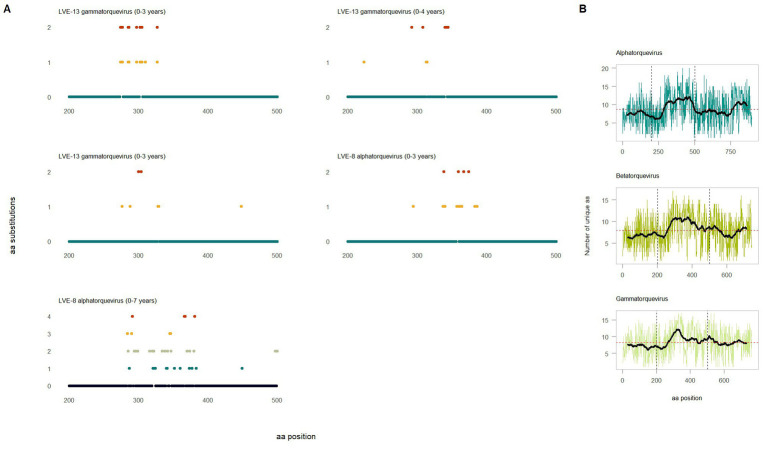
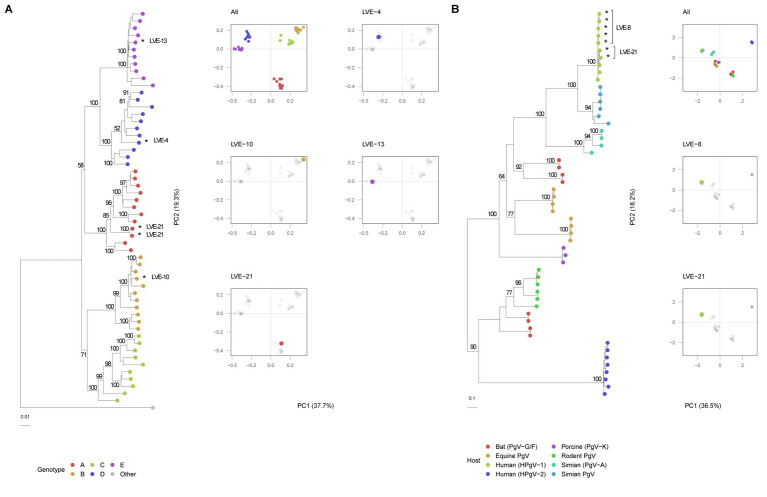
The virome remains an understudied domain of the human microbiome. The role of commensal viruses on the outcome of infections with known pathogens is not well characterized. In this study we aimed to characterize the longitudinal plasma virome dynamics in chronic hepatitis B virus (HBV) infected patients. Eighty-five longitudinal plasma samples were collected from 12 chronic HBV infected individuals that were classified in the four stages of HBV infection. The virome was characterized with an optimized viral extraction protocol and deep-sequenced on a NextSeq 2500 platform. The plasma virome was primarily composed of members of the Anello- Flavi-, and Hepadnaviridae (HBV) families. The virome structure and dynamics did not correlate with the different stages of chronic HBV infection nor with the administration of antiviral therapy. We observed a higher intrapersonal similarity of viral contigs. Genomic analysis of viruses observed in multiple timepoint demonstrated the presence of a dynamic community. This study comprehensively assessed the blood virome structure in chronic HBV infected individuals and provided insights in the longitudinal development of this viral community.

Keywords: anellovirus; blood; hepatitis B virus; metagenomic; pegivirus; plasma; virome.


Conflict of interest statement

The authors declare that the research was conducted in the absence of any commercial or financial relationships that could be construed as a potential conflict of interest.

Figures

Figure 1
Figure 1
Sample collection figure categorized according to the four stages of chronic HBV infection.
Figure 2
Figure 2
Evolution of the eukaryotic viral families, HBV antibodies and antigens, and HBV viral load. (A) Chronic HBV infected (HBeAg negative), (B) chronic HBV infected (HBeAg positive), (C) chronic hepatitis B and (D) liver cirrhosis patients. Colored dots indicate discrepancies between the qPCR and data and presence of HBV reads. Red dots: (+) qPCR and (−) HBV reads. Blue dots: (−) qPCR and (+) HBV reads. HBsAg, hepatitis B a antigen; HBsAb, hepatitis B s antibody; HBeAg, hepatitis B e antigen; HBeAb, hepatitis B e antibody.
Figure 3
Figure 3
Alpha-diversity (Shannon-diversity index) evolution of the Anelloviridae community per patient. The Shannon diversity index is displayed at the left axis and the anellovirus abundance on the right axis. Shannon diversity is calculated based on two different dataset (1) including all anellovirus contigs (blue dotted line) and (2) including contigs with a size above 1,500 bp (red dotted line). A loess regression line (blue line) illustrates the Shannon diversity trend based on the two datasets.
Figure 4
Figure 4
Analysis of the Bray-Curtis dissimilarity (beta-diversity) calculated on the presence and absence of Anelloviridae OTUs. (A) PCA plot of the distance based redundance analysis (dbRDA) with sample points colored according to patient ID. (B) Overview of the intra- (match) and inter-patient (non-match) distances between individual sample points. (C) PCA plot of the dbRDA with sample points colored according to the patient geographical origin. (D) Distances between individual sample points of patients originating from the same geographical region (match) or other regions (non-match). Significance was determined with a univariate dbRDA analysis. Distances were compared with the Mann-Whitney U test.
Figure 5
Figure 5
Intra- and inter-host composition of the anellovirus community. (A) A heatmap that demonstrates the presence and absence of contigs within patients and the percentage of samples positive for the respective contig (colored coded). The right bar (grey to black) corresponds to the number of patients positive for this contig. (B) The blue histogram indicates the number of contigs that were observed once or more within a single patient (top). The grey histogram demonstrates the number of contigs that appeared only in one patient or were shared between two or more patients (bottom). M-E, Middle East; OTU, operational taxonomical unit.
Figure 6
Figure 6
Phylogenetic analysis of the anellovirus ORF1 sequences and PCA analysis of the aligned dataset. (A) Maximum-likelihood tree of the patient and reference protein ORF1 sequences built in RAxML under model VT + I + G4 + F determined by jModelTest, with 1,000 bootstrap replicates. The heatmap illustrates positive viruses for the respective patient. Bootstrap values above 50 are shown for larger clades. (B) Principal components analysis of the aligned sequenced used for building the phylogenetic tree. Contigs extracted from patient samples are colored according to the tree position. Black dots indicate the presence of this contig based on 70% coverage, meaning that this contig was not derived from this patient but classified as present based on 70% coverage cut-off.
Figure 7
Figure 7
Evolution of the anellovirus contigs observed at multiple timepoints. (A) Amino acid diversity of ORF1 sequences that were observed in multiple timepoint (amino acid position 200–600). Colored dots indicate amino acid substitutions compared to the reference sequence observed in the earliest timepoint. The color code corresponds to the substitution frequency over time. (B) Diversity of the ORF1 region based on the extracted sequences and reference sequences for the respective genus. The horizontal red dotted line indicates the average number of unique amino acid over the entire ORF1. The vertical lines highlight the hyper variable region.
Figure 8
Figure 8
Phylogenetic and PCA analysis of the identified NS5B pegivirus regions and HBV genomes. (A) HBV neighbor-joining tree with 1,000 bootstrap replicates and PCA analysis of the aligned sequences. A Woolly monkey HBV genome was used as an outgroup (AY226578.1). Bootstrap values above 50 are shown for larger clades. (B) Maximum-likelihood tree of the pegivirus NS5B sequences extracted from patient samples and reference database of different hosts. The tree was built under model LG + G4 + F determined by jModelTest with 1,000 bootstrap replicates. Bootstrap values above 50 are shown for larger clades. *Indicates patient derived sequences.
Figure 9
Figure 9
Evolution of the pegivirus NS5B region between patients (A) Alignment of the protein NS5B and (B) nucleotide sequences observed in two patients. The color code corresponds to the amino acid or nucleotide substitutions between NS5B sequences of both patients.

Similar articles

Cited by

References

    1. Al-Qahtani A. A., Alabsi E. S., AbuOdeh R., Thalib L., El Zowalaty M. E., Nasrallah G. K. (2016). Prevalence of anelloviruses (TTV, TTMDV, and TTMV) in healthy blood donors and in patients infected with HBV or HCV in Qatar. Virol. J. 13, 1–6. doi: 10.1186/s12985-016-0664-6 - DOI - PMC - PubMed
    1. Altschul S. F., Gish W., Miller W., Myers E. W., Lipman D. J. (1990). Basic local alignment search tool. J. Mol. Biol. 215, 403–410. doi: 10.1016/S0022-2836(05)80360-2 - DOI - PubMed
    1. Arze C. A., Springer S., Dudas G., Patel S., Bhattacharyya A., Swaminathan H., et al. . (2021). Global genome analysis reveals a vast and dynamic anellovirus landscape within the human virome. Cell Host Microbe 29, 1305.e6–1315.e6. doi: 10.1016/j.chom.2021.07.001, PMID: - DOI - PubMed
    1. Bolger A. M., Lohse M., Usadel B. (2014). Trimmomatic: a flexible trimmer for Illumina sequence data. Bioinformatics 30, 2114–2120. doi: 10.1093/bioinformatics/btu170, PMID: - DOI - PMC - PubMed
    1. Buchfink B., Xie C., Huson D. H. (2015). Fast and sensitive protein alignment using DIAMOND. Nat. Methods 12, 59–60. doi: 10.1038/nmeth.3176, PMID: - DOI - PubMed

LinkOut - more resources