

APOE as potential biomarkers of moyamoya disease
- PMID: 37228412
- PMCID: PMC10203507
- DOI: 10.3389/fneur.2023.1156894
APOE as potential biomarkers of moyamoya disease
Abstract
Objective: The mechanisms underpinning Moyamoya disease (MMD) remain unclear, and effective biomarkers remain unknown. The purpose of this study was to identify novel serum biomarkers of MMD.
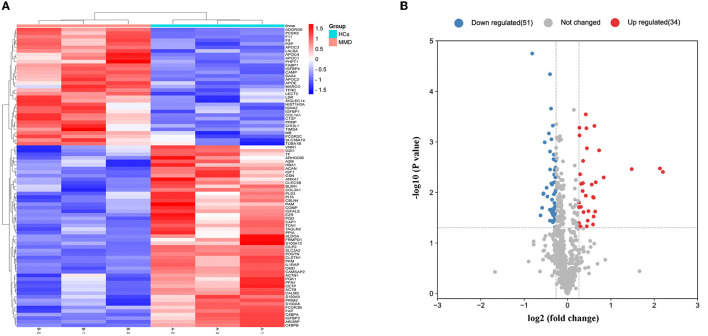
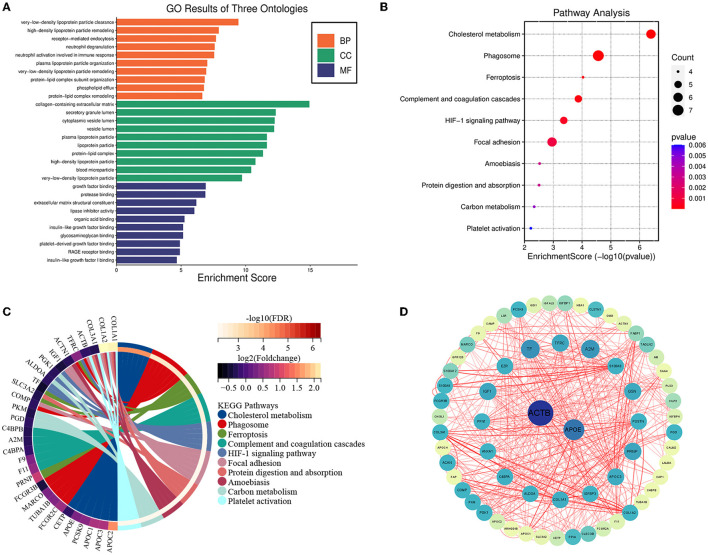
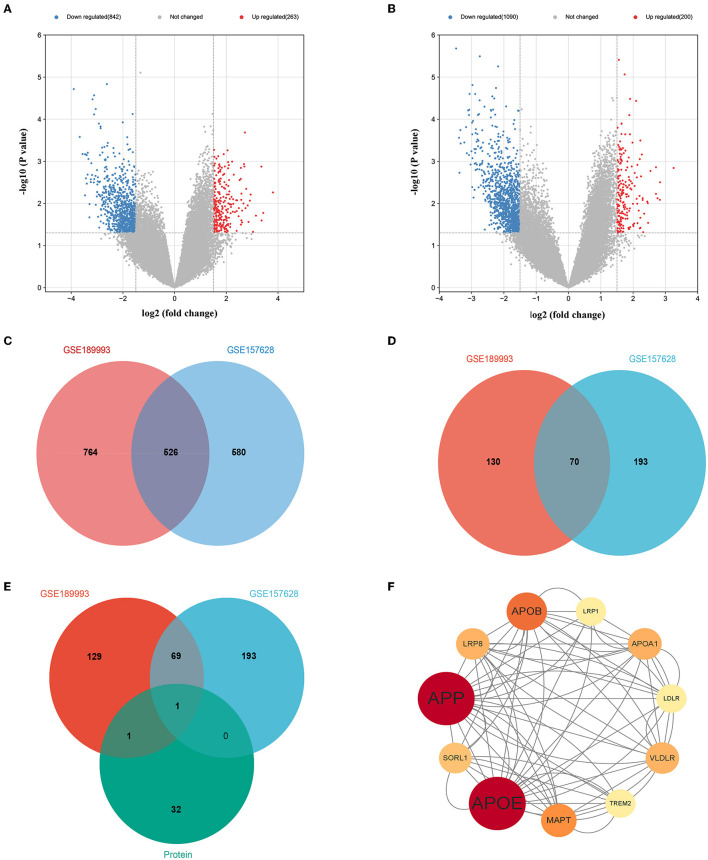
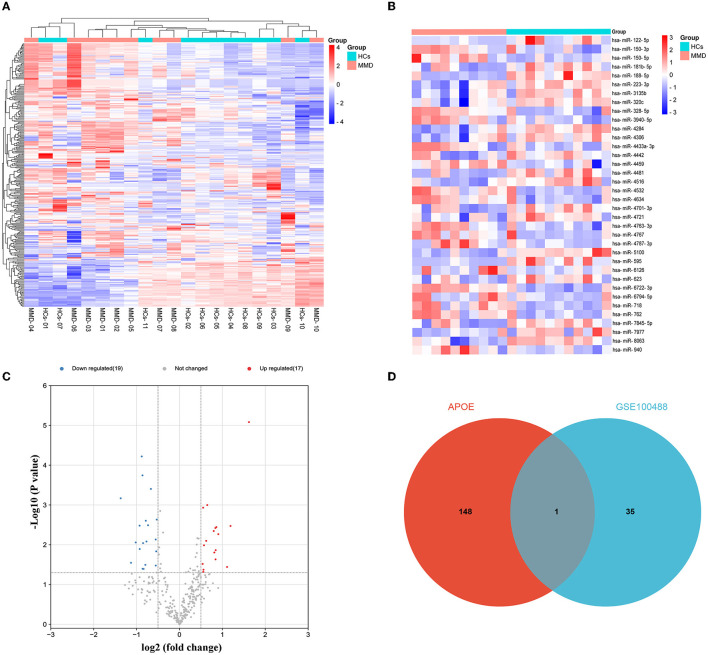
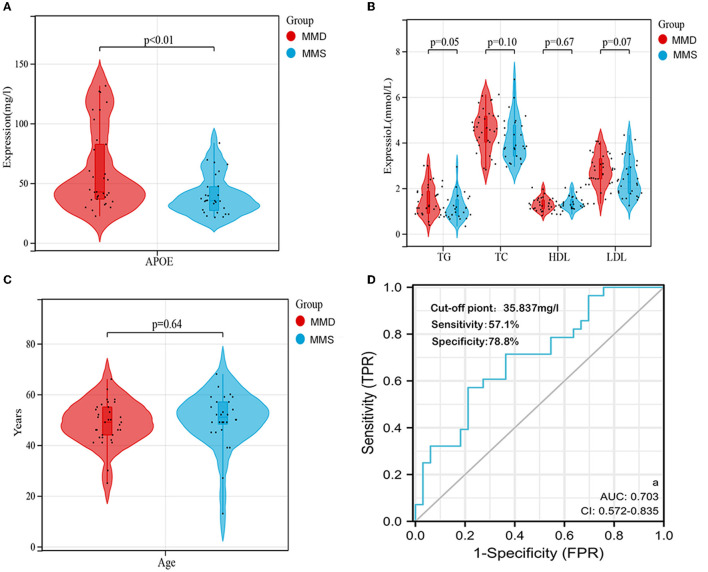
Methods: Serum samples were collected from 23 patients with MMD and 30 healthy controls (HCs). Serum proteins were identified using tandem tandem-mass-tag (TMT) labeling combined with liquid chromatography-tandem mass spectrometry (LC-MS/MS). Differentially expressed proteins (DEPs) in the serum samples were identified using the SwissProt database. The DEPs were assessed using the Kyoto Encyclopedia of Genes and Genomes (KEGG) database, Gene Ontology (GO), and protein-protein interaction (PPI) networks, and hub genes were identified and visualized using Cytoscape software. Microarray datasets GSE157628, GSE189993, and GSE100488 from the Gene Expression Omnibus (GEO) database were collected. Differentially expressed genes (DEGs) and differentially expressed miRNAs (DE-miRNAs) were identified, and miRNA targets of DEGs were predicted using the miRWalk3.0 database. Serum apolipoprotein E (APOE) levels were compared in 33 MMD patients and 28 Moyamoya syndrome (MMS) patients to investigate the potential of APOE to be as an MMD biomarker.
Results: We identified 85 DEPs, of which 34 were up- and 51 down-regulated. Bioinformatics analysis showed that some DEPs were significantly enriched in cholesterol metabolism. A total of 1105 DEGs were identified in the GSE157628 dataset (842 up- and 263 down-regulated), whereas 1290 were identified in the GSE189993 dataset (200 up- and 1,090 down-regulated). The APOE only overlaps with the upregulated gene expression in Proteomic Profiling and in GEO databases. Functional enrichment analysis demonstrated that APOE was associated with cholesterol metabolism. Moreover, 149 miRNAs of APOE were predicted in the miRWalk3.0 database, and hsa-miR-718 was the only DE-miRNA overlap identified in MMD samples. Serum APOE levels were significantly higher in patients with MMD than in those without. The performance of APOE as an individual biomarker to diagnose MMD was remarkable.
Conclusions: We present the first description of the protein profile of patients with MMD. APOE was identified as a potential biomarker for MMD. Cholesterol metabolism was found to potentially be related to MMD, which may provide helpful diagnostic and therapeutic insights for MMD.
Keywords: apolipoprotein E; biomarkers; carotid artery; cholesterol; moyamoya disease.
Copyright © 2023 Wu, Xu, Sun, Duan, Xiao, Ren, Zhou, Yan, Li, Xiong and Zeng.
Conflict of interest statement
The authors declare that the research was conducted in the absence of any commercial or financial relationships that could be construed as a potential conflict of interest.
Figures
Similar articles
-
Identification of the potential role of S1PR1 in adult moyamoya disease based on multiple bioinformatics analysis and experimental verification.FASEB J. 2025 Mar 31;39(6):e70461. doi: 10.1096/fj.202401445R. FASEB J. 2025. PMID: 40105149
-
Identification of immune-infiltrated hub genes as potential biomarkers of Moyamoya disease by bioinformatics analysis.Orphanet J Rare Dis. 2022 Feb 23;17(1):80. doi: 10.1186/s13023-022-02238-4. Orphanet J Rare Dis. 2022. PMID: 35197088 Free PMC article.
-
Characterization of moyamoya disease molecular subtypes through disulfidptosis‑related genes and immune landscape analysis.Exp Ther Med. 2025 Feb 14;29(4):74. doi: 10.3892/etm.2025.12824. eCollection 2025 Apr. Exp Ther Med. 2025. PMID: 40012919 Free PMC article.
-
Comprehensive molecular analyses of an autoimmune-related gene predictive model and immune infiltrations using machine learning methods in moyamoya disease.Front Mol Biosci. 2022 Dec 20;9:991425. doi: 10.3389/fmolb.2022.991425. eCollection 2022. Front Mol Biosci. 2022. PMID: 36605987 Free PMC article.
-
Common gene signatures and key pathways in hypopharyngeal and esophageal squamous cell carcinoma: Evidence from bioinformatic analysis.Medicine (Baltimore). 2020 Oct 16;99(42):e22434. doi: 10.1097/MD.0000000000022434. Medicine (Baltimore). 2020. PMID: 33080677 Free PMC article.
Cited by
-
Identification of lysosome-related hub genes as potential biomarkers and immune infiltrations of moyamoya disease by multiple bioinformatics methods and machine-learning strategies.Heliyon. 2024 Jul 10;10(14):e34432. doi: 10.1016/j.heliyon.2024.e34432. eCollection 2024 Jul 30. Heliyon. 2024. PMID: 39104482 Free PMC article.
-
Multi-omic serum analysis reveals ferroptosis pathways and diagnostic molecular signatures associated with Moyamoya diseases.J Neuroinflammation. 2025 Apr 29;22(1):123. doi: 10.1186/s12974-025-03446-y. J Neuroinflammation. 2025. PMID: 40301939 Free PMC article.
-
Proteomics and digital subtraction angiography approaches reveal CDH18 as a potential target for therapy of moyamoya disease.Biol Direct. 2024 Sep 5;19(1):76. doi: 10.1186/s13062-024-00522-w. Biol Direct. 2024. PMID: 39238003 Free PMC article.
References
LinkOut - more resources
Full Text Sources
Miscellaneous