. 2023 May 9:13:1158261.
doi: 10.3389/fonc.2023.1158261. eCollection 2023.

Plasma protein changes reflect colorectal cancer development and associated inflammation

Affiliations

Plasma protein changes reflect colorectal cancer development and associated inflammation

Víctor Urbiola-Salvador et al. Front Oncol. .

Abstract

Introduction: Colorectal cancer (CRC) is the third most common malignancy and the second leading cause of death worldwide. Efficient non-invasive blood-based biomarkers for CRC early detection and prognosis are urgently needed.

Methods: To identify novel potential plasma biomarkers, we applied a proximity extension assay (PEA), an antibody-based proteomics strategy to quantify the abundance of plasma proteins in CRC development and cancer-associated inflammation from few μL of plasma sample.

Results: Among the 690 quantified proteins, levels of 202 plasma proteins were significantly changed in CRC patients compared to age-and-sex-matched healthy subjects. We identified novel protein changes involved in Th17 activity, oncogenic pathways, and cancer-related inflammation with potential implications in the CRC diagnosis. Moreover, the interferon γ (IFNG), interleukin (IL) 32, and IL17C were identified as associated with the early stages of CRC, whereas lysophosphatidic acid phosphatase type 6 (ACP6), Fms-related tyrosine kinase 4 (FLT4), and MANSC domain-containing protein 1 (MANSC1) were correlated with the late-stages of CRC.

Discussion: Further study to characterize the newly identified plasma protein changes from larger cohorts will facilitate the identification of potential novel diagnostic, prognostic biomarkers for CRC.

Keywords: biomarker; colorectal cancer; cytokines; early detection; inflammation; plasma proteomics; prognosis; proximity extension assay.


Conflict of interest statement

The authors declare that the research was conducted in the absence of any commercial or financial relationships that could be construed as a potential conflict of interest.

Figures

Figure 1
Figure 1
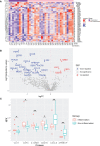
Colorectal cancer (CRC) development causes cytokine and oncogenic signaling pathway changes in plasma. (A) Volcano plot of statistical significance against fold-change of proteins between CRC patients and healthy controls. Dots indicate individual proteins and the red and blue dots represent significant up-regulation and down-regulation in patients, respectively. (B) Network of KEGG pathway enrichment analysis combined with STRING protein-protein interaction network analysis. Green and red proteins indicate significant up-regulation and down-regulation, respectively. (C) Box and whisker plots of selected DEPs not previously reported associated with CRC. * indicates statistically significant with an adjusted p-value < 0.05, ** indicates an adjusted p-value < 0.01, and *** indicates an adjusted p-value < 0.001. DEP, differentially expressed protein; FC, fold change, NPX; normalized protein expression.
Figure 2
Figure 2
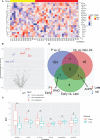
Plasma protein changes induced by cancer-associated inflammation in CRC patients. (A) Heatmap of proteins with significant correlation with inflammation status. Protein expression is transformed with a z-score by row normalization and distributed by hierarchical clustering. The correlation coefficients (right) indicate a positive/negative correlation for each protein. (B) Volcano plot of statistical significance against fold-change of proteins between CRC patients with inflammation and without inflammation. Dots indicate individual proteins and the red and blue dots represent significant up-regulation and down-regulation in CRC patients with inflammation, respectively. (C) Box and whisker plots of selected DEPs not previously associated with cancer-related inflammation in CRC patients. *: adjusted p-value < 0.05, **: adjusted p-value < 0.01.
Figure 3
Figure 3
Plasma protein expression differences between early and late stages of CRC. (A) Heatmap of proteins with significant correlation with tumor stage. Protein expression is transformed with a z-score by row normalization and distributed by hierarchical clustering. The correlation coefficients (right) indicate a positive/negative correlation for each protein. (B) Volcano plot of statistical significance against fold-change of proteins between CRC patients with early tumor stage and with late tumor stage. Dots indicate individual protein and the red and blue dots represent significant up-regulation and down-regulation in CRC patients with late tumor stage, respectively. (C) Box and whisker plots of DEPs that are novel potential prognostic biomarkers associated with cancer stages in CRC patients. *: adjusted p-value < 0.05. (D) Venn diagram with the differentially expressed proteins for each comparison: CRC patients vs. control, Inflammation vs. Non-inflammation, and Early vs. Late. Black arrows indicate the proteins of interest that are in common between comparisons. Red and blue arrows indicate up-regulation and down-regulation for the specified group, respectively. C, control; Inf., inflammation; Non-Inf., non-inflammation; P, patient.
Figure 4
Figure 4
Validation of potential candidate biomarkers. (A) Plots with the concentrations of CSF3, IFNG, IL6, CXCL9, and CCL23 in CRC patients (P) and healthy controls (HC) (mean ± SEM) detected by Luminex. (B) Plot with the concentrations of ACP6 detected by ELISA in CRC patients with early and late stages, respectively (mean ± SEM). T test was used for statistical analysis. *: p-value < 0.05, ****: p-value < 0.0001, NS: non-significance.

References

    1. Sung H, Ferlay J, Siegel RL, Laversanne M, Soerjomataram I, Jemal A, et al. . Global cancer statistics 2020: GLOBOCAN estimates of incidence and mortality worldwide for 36 cancers in 185 countries. CA Cancer J Clin (2021) 71:209–49. doi: 10.3322/caac.21660 - DOI - PubMed
    1. Xi Y, Xu P. Global colorectal cancer burden in 2020 and projections to 2040. Transl Oncol (2021) 14:101174. doi: 10.1016/j.tranon.2021.101174 - DOI - PMC - PubMed
    1. Ladabaum U, Dominitz JA, Kahi C, Schoen RE. Strategies for colorectal cancer screening. Gastroenterology (2020) 158:418–32. doi: 10.1053/J.GASTRO.2019.06.043 - DOI - PubMed
    1. Nicholson BD, James T, East JE, Grimshaw D, Paddon M, Justice S, et al. . Experience of adopting faecal immunochemical testing to meet the NICE colorectal cancer referral criteria for low-risk symptomatic primary care patients in Oxfordshire, UK. Frontline Gastroenterol (2019) 10:347–55. doi: 10.1136/flgastro-2018-101052 - DOI - PMC - PubMed
    1. Young PE, Womeldorph CM. Colonoscopy for colorectal cancer screening. J Cancer (2013) 4:217. doi: 10.7150/JCA.5829 - DOI - PMC - PubMed