. 2023 May 9:13:1161254.
doi: 10.3389/fonc.2023.1161254. eCollection 2023.

Preclinical investigations of the efficacy of the glutaminase inhibitor CB-839 alone and in combinations in chronic lymphocytic leukemia

Affiliations

Preclinical investigations of the efficacy of the glutaminase inhibitor CB-839 alone and in combinations in chronic lymphocytic leukemia

Natalia Timofeeva et al. Front Oncol. .

Abstract

Introduction: Chronic lymphocytic leukemia (CLL) cells are metabolically flexible and adapt to modern anticancer treatments. Bruton tyrosine kinase (BTK) and B-cell lymphoma-2 (BCL-2) inhibitors have been widely used to treat CLL, but CLL cells become resistant to these treatments over time. CB-839 is a small-molecule glutaminase-1 (GLS-1) inhibitor that impairs glutamine use, disrupts downstream energy metabolism, and impedes the elimination of reactive oxygen species.

Methods: To investigate the in vitro effects of CB-839 on CLL cells, we tested CB-839 alone and in combination with ibrutinib, venetoclax, or AZD-5991 on the HG-3 and MEC-1 CLL cell lines and on primary CLL lymphocytes.

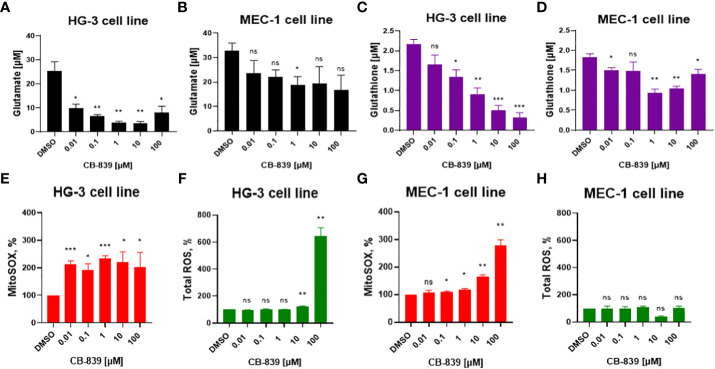
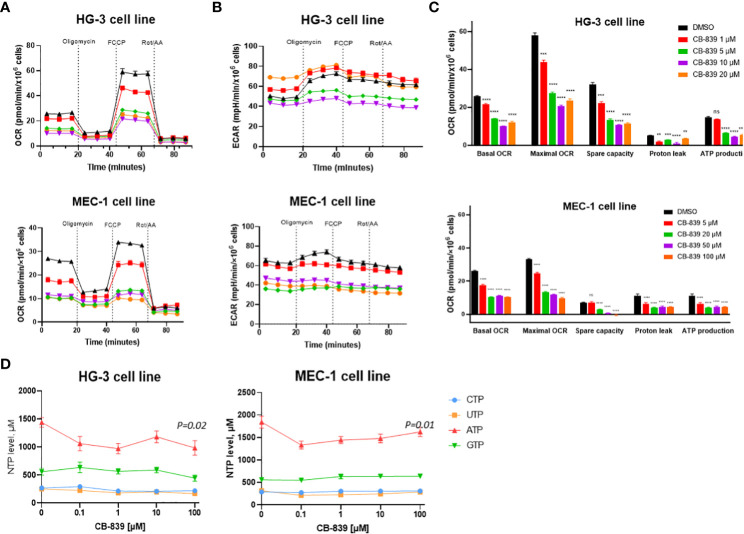
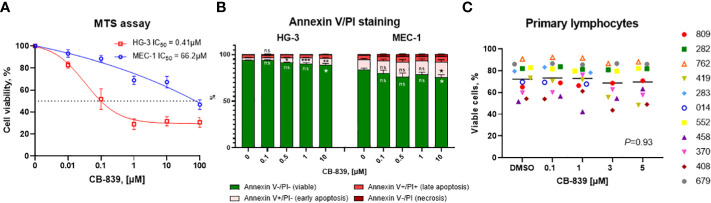
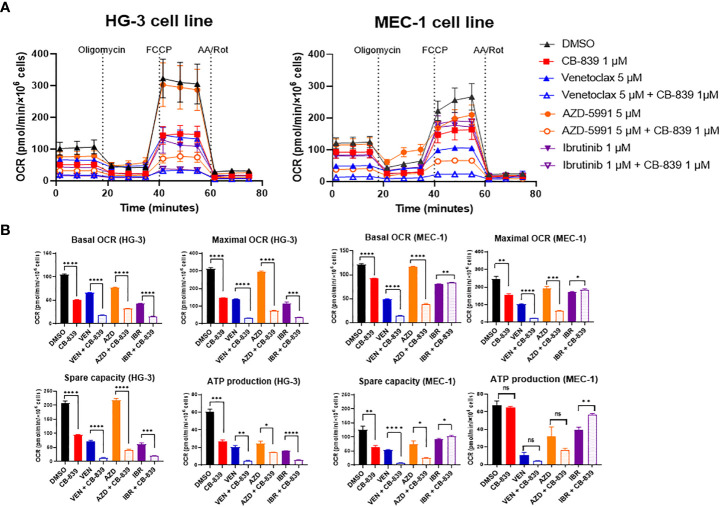
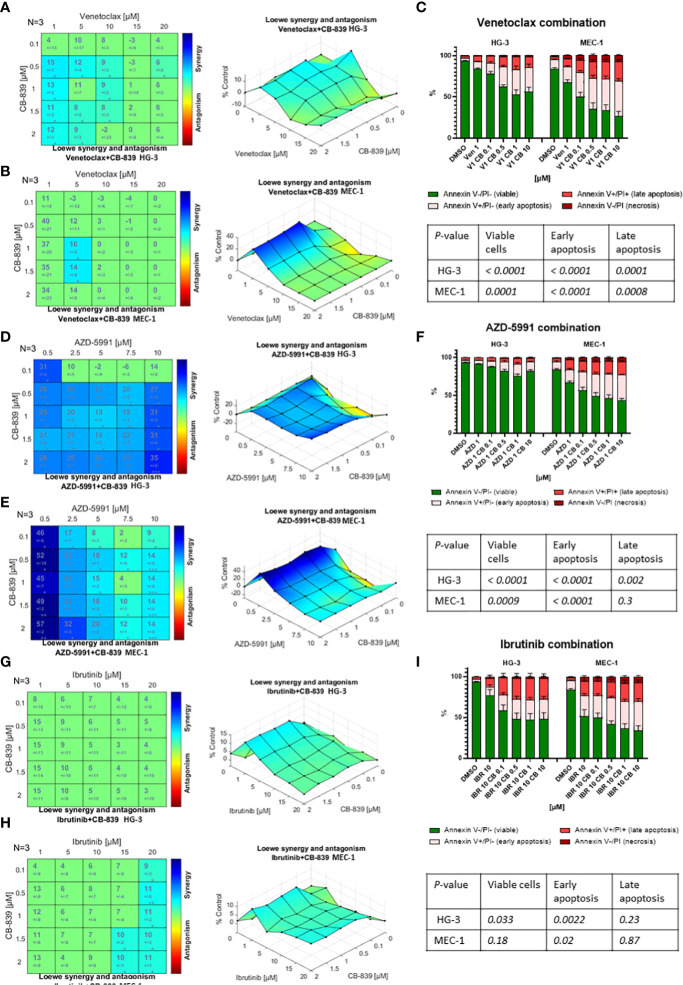
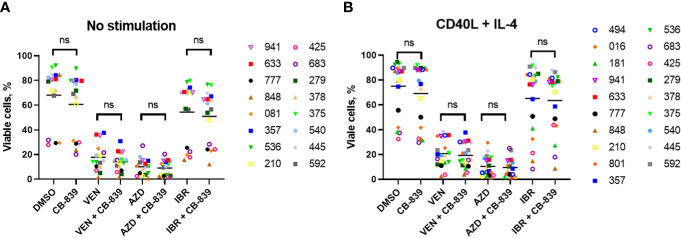
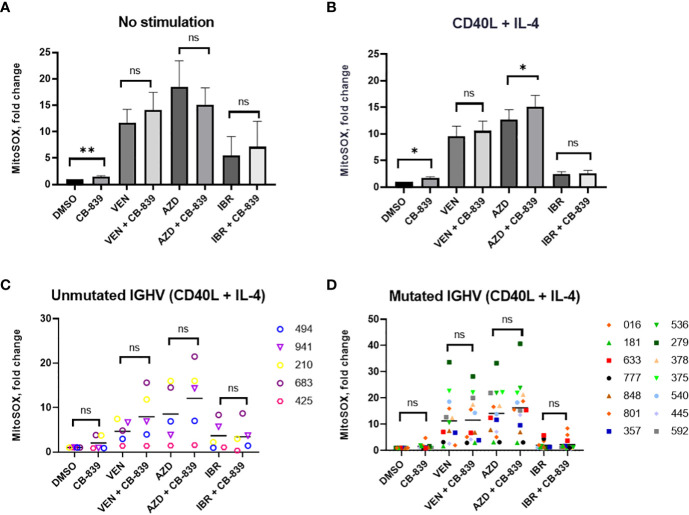
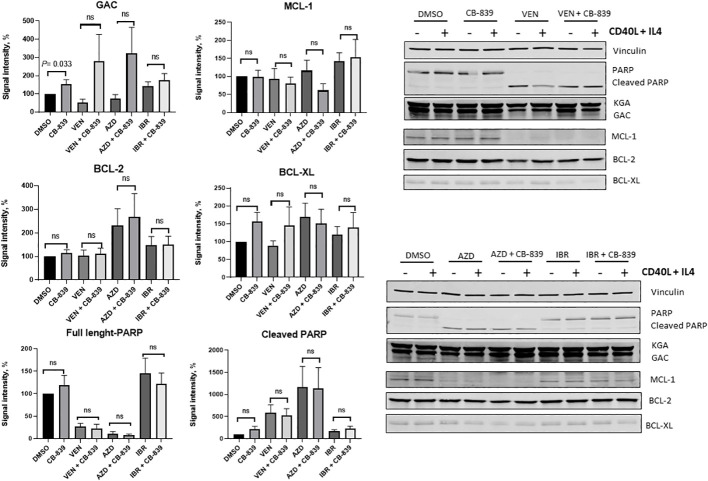
Results: We found that CB-839 caused dose-dependent decreases in GLS-1 activity and glutathione synthesis. CB-839-treated cells also showed increased mitochondrial superoxide metabolism and impaired energy metabolism, which were reflected in decreases in the oxygen consumption rate and depletion of the adenosine triphosphate pool and led to the inhibition of cell proliferation. In the cell lines, CB-839 combined with venetoclax or AZD-5991, but not with ibrutinib, demonstrated synergism with an increased apoptosis rate and cell proliferation inhibition. In the primary lymphocytes, no significant effects of CB-839 alone or in combination with venetoclax, ibrutinib, or AZD-5991 were observed.

Discussion: Our findings suggest that CB-839 has limited efficacy in CLL treatment and shows limited synergy in combination with widely used CLL drugs.

Keywords: BTK - Bruton’s tyrosine kinase; Bcl-2 inhibitor; CLL - chronic lymphoblastic leukemia; Mcl-1 inhibitor; glutamine (Gln) metabolism; ibrutinib; venetoclax.


Conflict of interest statement

Previously, for other investigations, V.G. received research funding from AbbVie, Acerta, AstraZeneca, Clear Creek Bio., Gilead, Infinity, Loxo/Lilly Oncology, Pharmacyclics, and Sunesis. The remaining authors declare no competing financial interests.

Figures

Figure 1
Figure 1
(A, B) The inhibition of glutaminase-1 (GLS-1), (C, D) the decline in glutathione levels, and changes in (E, G) mitochondrial superoxide (MitoSOX) and (F, H) total cellular reactive oxygen species (ROS) were evaluated in HG-3 and MEC-1 cells. Cells were treated with CB-839 (0.01-100 μM) for 72 hours, and the levels of these metabolites were determined using assay kits as described in the Methods section. ROS levels were evaluated per the manufacturer’s protocol after 4 hours of treatment; superoxide (SOX) levels measured after 24 hours of incubation. Data represent the mean ± the standard error of the mean for 3 biologically separate experiments. DMSO, dimethyl sulfoxide; ns, not significant. *P < 0.05; **P < 0.01; ***P < 0.001.
Figure 2
Figure 2
CB-839 affected mitochondrial respiration and bioenergetics in the HG-3 and MEC-1 cell lines. Representative (A) oxygen consumption rate (OCR) and (B) extracellular acidification rate (ECAR ECAR) curves of untreated cells versus cells treated with CB-839 in equitoxic concentrations in the HG-3 (top) and MEC-1 (bottom) cell lines. (C) Changes in the basal OCR, maximal OCR, spare capacity, proton leakage, and ATP-linked production under CB-839 treatment in the HG-3 (top) and MEC-1 (bottom) cell lines. (D) CB-839–induced depletion of the ATP pool in the HG-3 and MEC-1 cell lines was detected using high-performance liquid chromatography. The significance of the results was evaluated using a 1-way analysis of variance test. ATP, adenosine triphosphate; CTP, cytidine triphosphate; DMSO, dimethyl sulfoxide; GTP, guanosine triphosphate; ns, not significant; Rot/AA, rotenone/antimycin A; UTP, uridine triphosphate. **P < 0.01; ***P < 0.001; ****P < 0.0001.
Figure 3
Figure 3
The characterization of the in vitro growth inhibitory effects of CB-839 (concentration range, 0.01-100 μM) after 72 hours. The percentages of viable cells from the HG-3 and MEC-1 cell lines as determined using (A) an MTS colorimetric assay and (B) annexin V/propidium iodide (PI) staining. (C) The percentages of viable primary lymphocytes in CB-839–treated samples after 72 hours as determined using flow cytometry (n = 11; P = 0.93). The data are presented as the mean ± the standard error of the mean. Values were calculated from 3 independent experiments, and each experiment was performed 3 times. The significance of the results was evaluated using a 1-way analysis of variance test. Open symbols represent patients without the immunoglobulin heavy chain (IGHV) mutation, and solid symbols represent those with the mutation. The numbers next to the open and solid symbols are patient numbers.
Figure 4
Figure 4
CB-839 induced autophagy in the HG-3 and MEC-1 cell lines. (A) An immunoblot assay revealed increased conversion of light chain 3 (LC3)-I to LC3-II and a decrease in p62 expression in the treated cells compared with the untreated cells. (B) CB-839 increased the number of green puncta in the treated cells compared with the control (dimethyl sulfoxide [DMSO]-treated) cells (12.6X). (C) Quantitation of LC3 puncta in HG-3 and MEC-1 cell lines after treatment with CB-839. Number of puncta in figure 4B were quantitated. 20 cells in each condition were used to count puncta and data were expressed per cell. Rapamycin (R10; 10 μM) and bafilomycin A1 (B100; 100nM) were used as positive and negative controls. ns, not significant. *P < 0.05; **P < 0.01.
Figure 5
Figure 5
The inhibition of mitochondrial respiration in the HG-3 and MEC-1 cell lines upon treatment with CB-839 in combination with venetoclax, AZD-5991, and ibrutinib. (A) Oxygen consumption rate (OCR) curves for the control (dimethyl sulfoxide [DMSO]-treated), alone, and combination treatment groups. (B) Changes in basal OCR, maximal OCR, spare capacity, and ATP-linked production under CB-839 treatment in the HG-3 (left) and MEC-1 (right) cell lines. AA/Rot, rotenone/antimycin A; AZD, AZD-5991; IBR, ibrutinib; ns, not significant; VEN, venetoclax. *P < 0.05; **P < 0.01; ***P < 0.001; ****P < 0.0001.
Figure 6
Figure 6
The drug interactions in the HG-3 and MEC-1 cell lines were visualized using Combenefit software. The colored matrices show the synergy scores for the drug combinations, and the surface plots show data representative of 3 independent experiments. When given in combination therapy, CB-839 showed (A, B) a narrow synergistic concentration window with venetoclax, (D, E) synergism with AZD-5991, and (G, H) no synergism with ibrutinib. (C, F, I) The Loewe model data were confirmed by an evaluation of apoptosis using annexin/propidium iodine (PI) staining and flow cytometry. Flow cytometry data were analyzed using 1-way analysis of variance testing. Cells were treated with dimethyl sulfoxide (DMSO; controls), monotherapy (venetoclax [VEN], AZD-5991 [AZD], and ibrutinib [IBR]), or combination therapy with CB-839 (CB). P values are given in the tables below each graph. The data are presented as the mean ± the standard error of the mean for 3 independent experiments, and each experiment was performed 3 times.
Figure 7
Figure 7
A total of 19 patient-derived chronic lymphocytic leukemia samples were incubated for 72 hours (A) without (n = 16) and (B) with (n = 19) the proliferation-inducing cytokines CD40 ligand (CD40L) and interleukin-4 (IL-4). Both groups were treated with venetoclax (VEN; 10 nM), AZD-5991 (AZD; 250 nM), and ibrutinib (IBR; 1 μM), with or without addition of CB-839 (500 nM), for 72 hours. Apoptosis was quantified using flow cytometry and annexin/propidium iodide (PI) staining. For each comparison of a drug combination or control (dimethyl sulfoxide [DMSO]) versus CB-839 alone, an unpaired, 2-tailed Student t-test was performed. The numbers next to the open and solid symbols are patient numbers. ns, not significant.
Figure 8
Figure 8
(A, B) Both CD40 ligand (CD40L) and interleukin-4 (IL-4)–stimulated and unstimulated primary chronic lymphocytic leukemia lymphocytes increased their mitochondrial reactive oxygen species production in response to 72 hours of CB-839 treatment as revealed by mitochondrial superoxide red fluorescence. (C, D) The immunoglobulin heavy chain (IGHV) mutational status had no impact on venetoclax (VEN), AZD-5991 (AZD), and ibrutinib (IBR) sensitization by CB-839. Data represent the mean ± the standard error of the mean. For each comparison of a drug combination or control (dimethyl sulfoxide [DMSO]) versus CB-839 alone, an unpaired, 2-tailed Student t-test was performed. Open symbols represent patients without the IGHV mutation, and solid symbols represent those with the mutation. The numbers next to the open and solid symbols are patient numbers. ns, not significant. *P < 0.05; **P < 0.01.
Figure 9
Figure 9
Summary plots of Western blotting analysis and quantifications of glutaminase C (GAC), myeloid cell leukemia-1 (MCL-1), B-cell lymphoma-2 (BCL-2), B-cell lymphoma–extra-large (BCL-XL), and PARP (full-length and cleaved) protein expression in 10 patient samples after CB-839 treatment alone and in combination with venetoclax (VEN), AZD-5991 (AZD), and ibrutinib (IBR). Bar plots represent groups supplemented with CD 40 ligand (CD40L) and interleukin-4 (IL-4). Data are shown as the mean ± the standard error of the mean. Signal intensity was normalized to the loading control (vinculin, β -actin). For each comparison of a drug combination or control (dimethyl sulfoxide [DMSO]) versus CB-839 alone, an unpaired, 2-tailed Student t-test was performed. KGA, kidney glutaminase; ns, not significant.

Similar articles

Cited by

References

    1. Vangapandu HV, Havranek O, Ayres ML, Kaipparettu BA, Balakrishnan K, Wierda WG, et al. . B-cell receptor signaling regulates metabolism in chronic lymphocytic leukemia. Mol Cancer Res (2017) 15(12):1692–703. doi: 10.1158/1541-7786.Mcr-17-0026 - DOI - PMC - PubMed
    1. Jitschin R, Hofmann AD, Bruns H, Giessl A, Bricks J, Berger J, et al. . Mitochondrial metabolism contributes to oxidative stress and reveals therapeutic targets in chronic lymphocytic leukemia. Blood (2014) 123(17):2663–72. doi: 10.1182/blood-2013-10-532200 - DOI - PubMed
    1. Vangapandu HV, Alston B, Morse J, Ayres ML, Wierda WG, Keating MJ, et al. . Biological and metabolic effects of iacs-010759, an oxphos inhibitor, on chronic lymphocytic leukemia cells. Oncotarget (2018) 9(38):24980–91. doi: 10.18632/oncotarget.25166 - DOI - PMC - PubMed
    1. Galicia-Vázquez G, Smith S, Aloyz R. Del11q-positive cll lymphocytes exhibit altered glutamine metabolism and differential response to Gls1 and glucose metabolism inhibition. Blood Cancer J (2018) 8(1):13. doi: 10.1038/s41408-017-0039-2 - DOI - PMC - PubMed
    1. Ward PS, Thompson CB. Metabolic reprogramming: a cancer hallmark even warburg did not anticipate. Cancer Cell (2012) 21(3):297–308. doi: 10.1016/j.ccr.2012.02.014 - DOI - PMC - PubMed