

Heat induces multiomic and phenotypic stress propagation in zebrafish embryos
- PMID: 37228511
- PMCID: PMC10205475
- DOI: 10.1093/pnasnexus/pgad137
Heat induces multiomic and phenotypic stress propagation in zebrafish embryos
Abstract
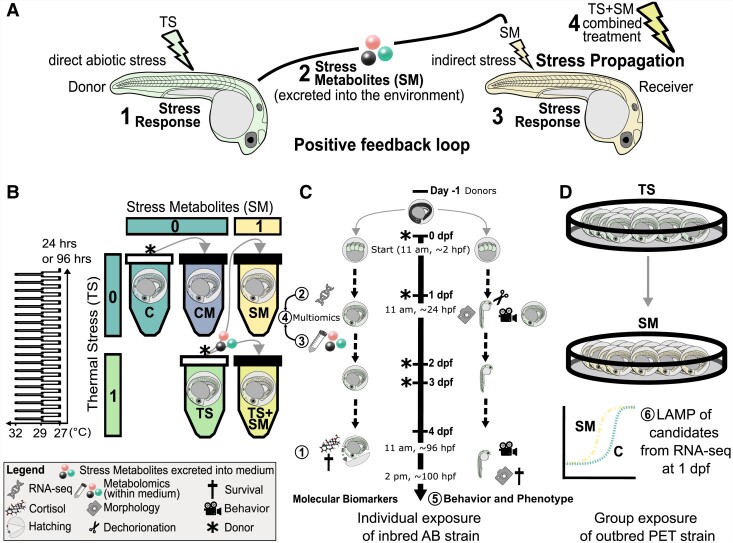
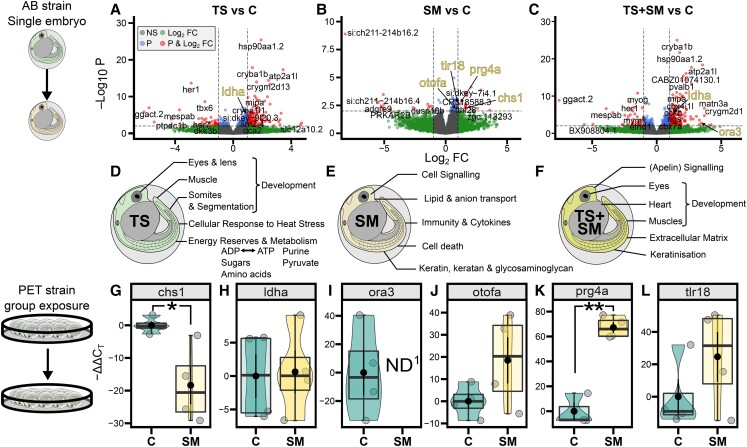
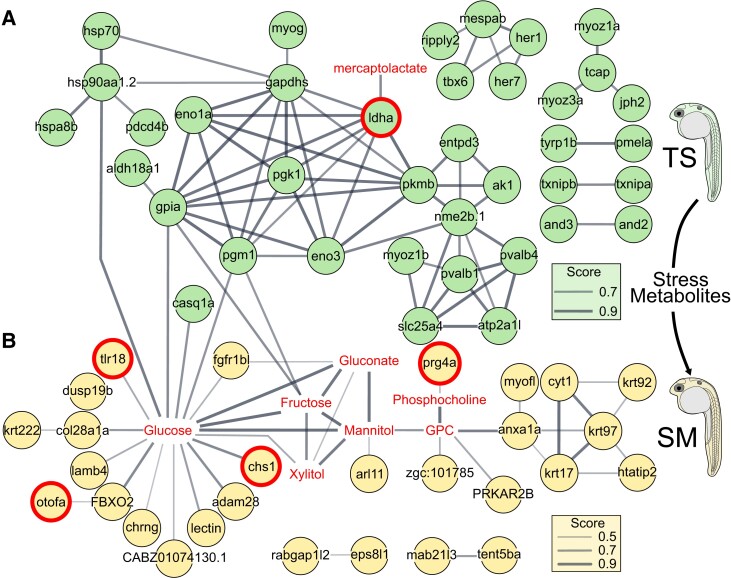
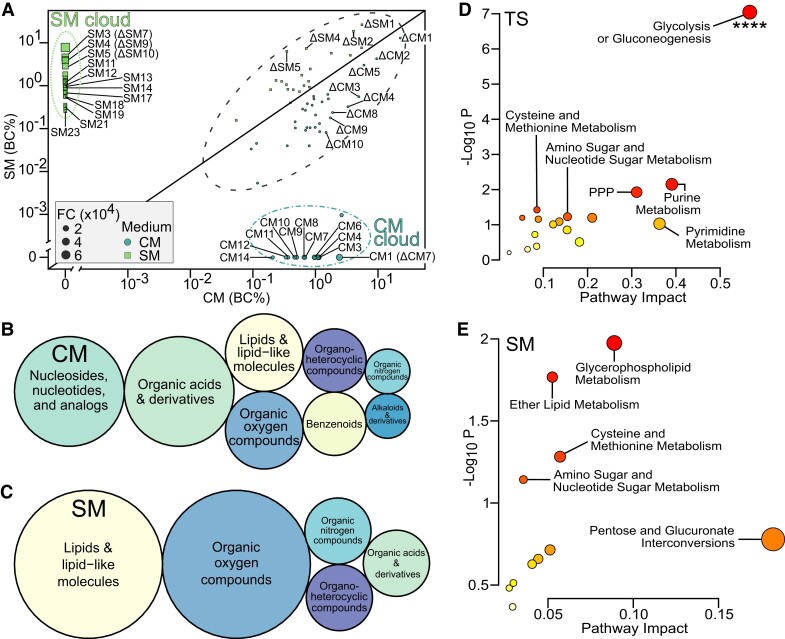
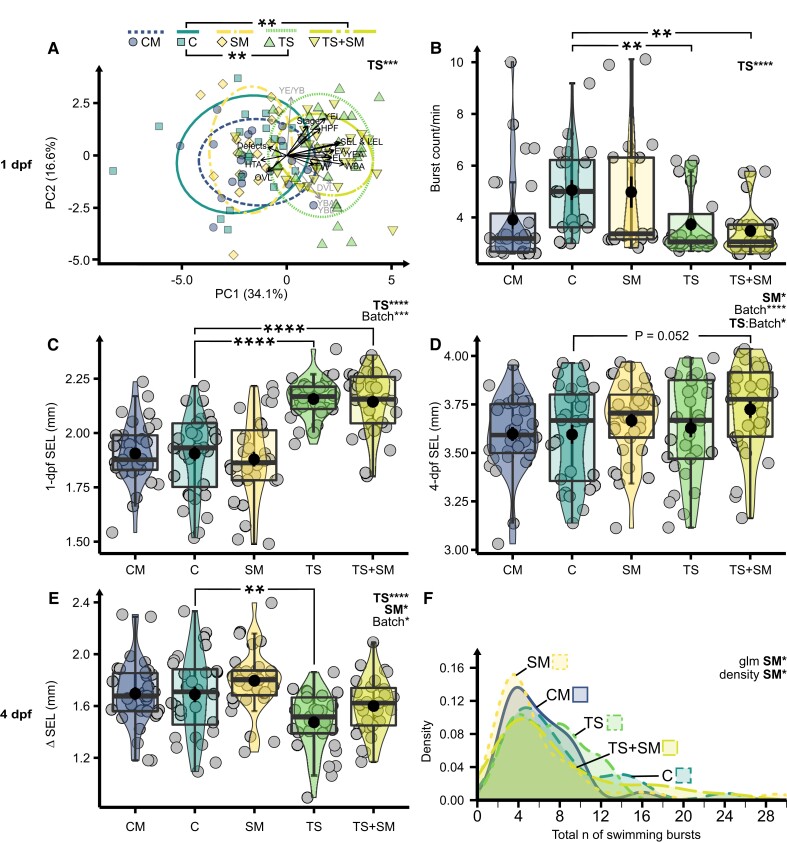
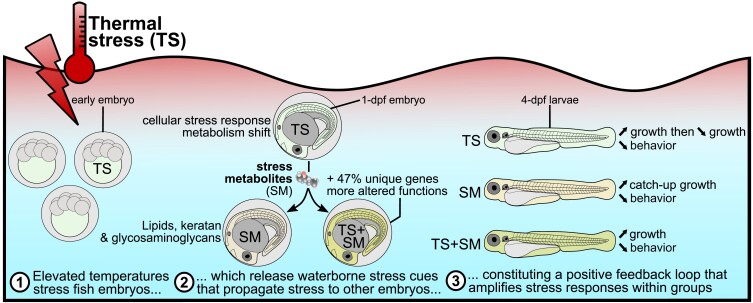
Heat alters biology from molecular to ecological levels, but may also have unknown indirect effects. This includes the concept that animals exposed to abiotic stress can induce stress in naive receivers. Here, we provide a comprehensive picture of the molecular signatures of this process, by integrating multiomic and phenotypic data. In individual zebrafish embryos, repeated heat peaks elicited both a molecular response and a burst of accelerated growth followed by a growth slowdown in concert with reduced responses to novel stimuli. Metabolomes of the media of heat treated vs. untreated embryos revealed candidate stress metabolites including sulfur-containing compounds and lipids. These stress metabolites elicited transcriptomic changes in naive receivers related to immune response, extracellular signaling, glycosaminoglycan/keratan sulfate, and lipid metabolism. Consequently, non-heat-exposed receivers (exposed to stress metabolites only) experienced accelerated catch-up growth in concert with reduced swimming performance. The combination of heat and stress metabolites accelerated development the most, mediated by apelin signaling. Our results prove the concept of indirect heat-induced stress propagation toward naive receivers, inducing phenotypes comparable with those resulting from direct heat exposure, but utilizing distinct molecular pathways. Group-exposing a nonlaboratory zebrafish line, we independently confirm that the glycosaminoglycan biosynthesis-related gene chs1 and the mucus glycoprotein gene prg4a, functionally connected to the candidate stress metabolite classes sugars and phosphocholine, are differentially expressed in receivers. This hints at the production of Schreckstoff-like cues in receivers, leading to further stress propagation within groups, which may have ecological and animal welfare implications for aquatic populations in a changing climate.
Keywords: multiomics; stress cues; stress propagation; stress response; thermal stress.
© The Author(s) 2023. Published by Oxford University Press on behalf of National Academy of Sciences.
Figures
Similar articles
-
Thermal stress induces a positive phenotypic and molecular feedback loop in zebrafish embryos.J Therm Biol. 2021 Dec;102:103114. doi: 10.1016/j.jtherbio.2021.103114. Epub 2021 Oct 23. J Therm Biol. 2021. PMID: 34863478
-
Heat stress modulates nucleotide excision repair capacity in zebrafish (Danio rerio) early and mid-early embryos via distinct mechanisms.Chemosphere. 2020 Jan;238:124653. doi: 10.1016/j.chemosphere.2019.124653. Epub 2019 Aug 23. Chemosphere. 2020. PMID: 31473528
-
Metabolomics: a systems biology approach for enhancing heat stress tolerance in plants.Plant Cell Rep. 2022 Mar;41(3):741-763. doi: 10.1007/s00299-020-02635-8. Epub 2020 Nov 29. Plant Cell Rep. 2022. PMID: 33251564 Review.
-
Assessing water quality in a tropical lake using biomarkers in zebrafish embryos: developmental toxicity and stress protein responses.Environ Monit Assess. 2005 May;104(1-3):171-87. doi: 10.1007/s10661-005-1610-z. Environ Monit Assess. 2005. PMID: 15931986
-
Reproductive physiology and endocrinology responses of cows exposed to environmental heat stress - Experiences from the past and lessons for the present.Theriogenology. 2020 Oct 1;155:150-156. doi: 10.1016/j.theriogenology.2020.05.040. Epub 2020 Jun 6. Theriogenology. 2020. PMID: 32679440 Review.
Cited by
-
The molecular signature of heat stress in sweat reveals non-invasive biomarker candidates for health monitoring.Commun Biol. 2025 Apr 23;8(1):650. doi: 10.1038/s42003-025-08080-1. Commun Biol. 2025. PMID: 40269247 Free PMC article.
-
Simulated Heat Waves Affect Cell Fate and Fitness in the Social Amoeba Dictyostelium discoideum.Microb Ecol. 2025 Apr 1;88(1):21. doi: 10.1007/s00248-025-02519-y. Microb Ecol. 2025. PMID: 40167801 Free PMC article.
-
Social context prevents heat hormetic effects against mutagens during fish development.FEBS Lett. 2025 Apr 23;599(15):2107-28. doi: 10.1002/1873-3468.70047. Online ahead of print. FEBS Lett. 2025. PMID: 40265659 Free PMC article.
-
Network architecture of transcriptomic stress responses in zebrafish embryos.PLoS Comput Biol. 2025 Jun 11;21(6):e1013164. doi: 10.1371/journal.pcbi.1013164. eCollection 2025 Jun. PLoS Comput Biol. 2025. PMID: 40498872 Free PMC article.
-
Protective multi-stressor interactions in the Anthropocene: Key considerations for investigating cross-tolerance in a conservation context.Conserv Physiol. 2025 Jul 30;13(1):coaf052. doi: 10.1093/conphys/coaf052. eCollection 2025. Conserv Physiol. 2025. PMID: 40741374 Free PMC article.
References
-
- Brett JR. 1971. Energetic responses of salmon to temperature. A study of some thermal relations in the physiology and freshwater ecology of sockeye salmon (Oncorhynchus nerka). Am Zool. 11:99–113.
-
- López-Olmeda JF, Sánchez-Vázquez FJ. 2011. Thermal biology of zebrafish (Danio rerio). J Therm Biol. 36:91–104.
-
- Schröter C, et al. . 2008. Dynamics of zebrafish somitogenesis. Dev Dyn. 237:545–553. - PubMed
-
- Alfonso S, Gesto M, Sadoul B. 2020. Temperature increase and its effects on fish stress physiology in the context of global warming. J Fish Biol. 98:1496–1508. - PubMed
LinkOut - more resources
Full Text Sources
Molecular Biology Databases
