

Identification and experimental validation of mitochondria-related genes biomarkers associated with immune infiltration for sepsis
- PMID: 37228596
- PMCID: PMC10203506
- DOI: 10.3389/fimmu.2023.1184126
Identification and experimental validation of mitochondria-related genes biomarkers associated with immune infiltration for sepsis
Abstract
Background: Sepsis remains a complex condition with incomplete understanding of its pathogenesis. Further research is needed to identify prognostic factors, risk stratification tools, and effective diagnostic and therapeutic targets.
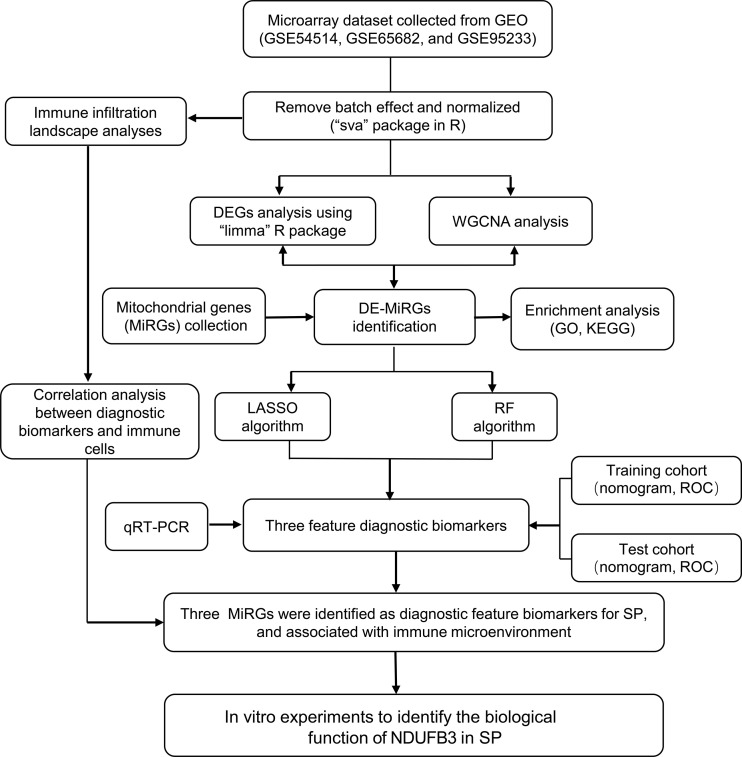
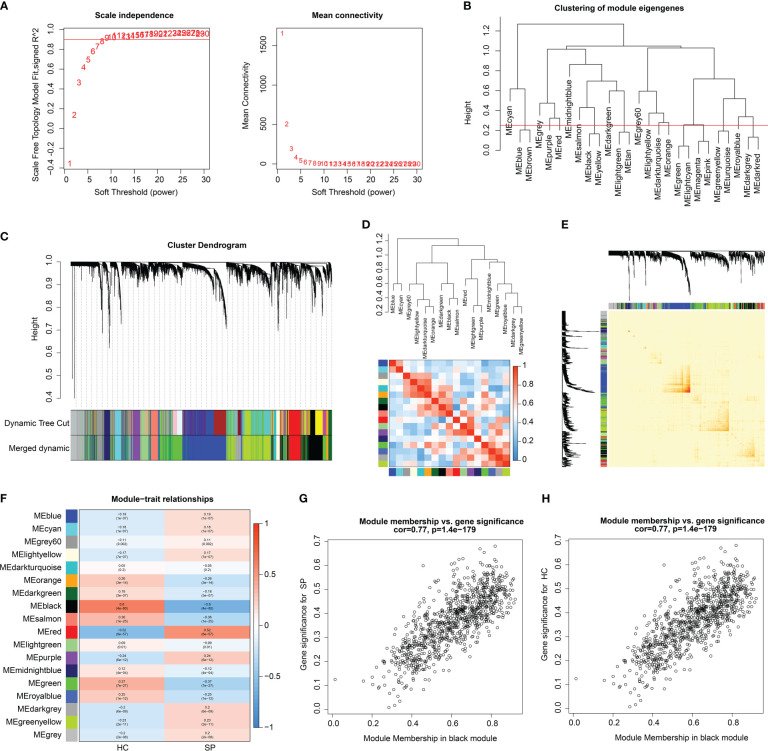
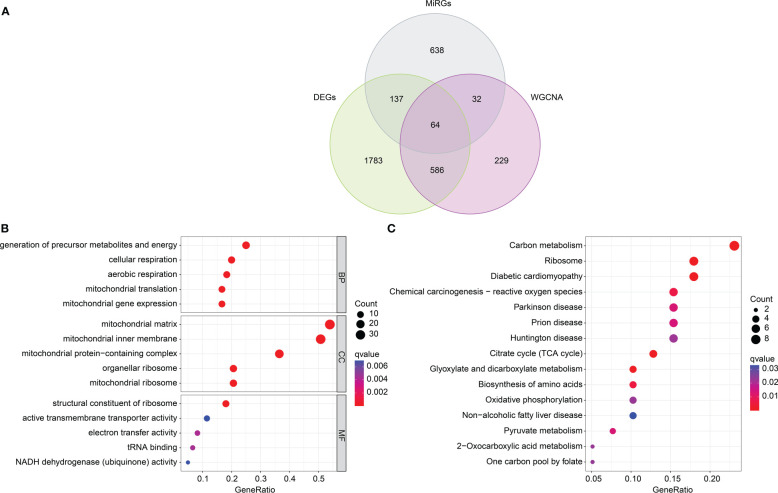
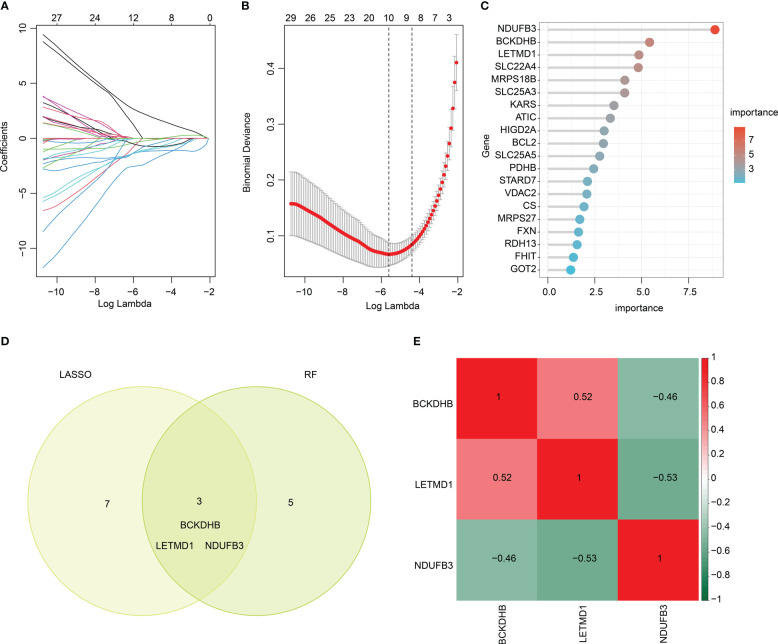
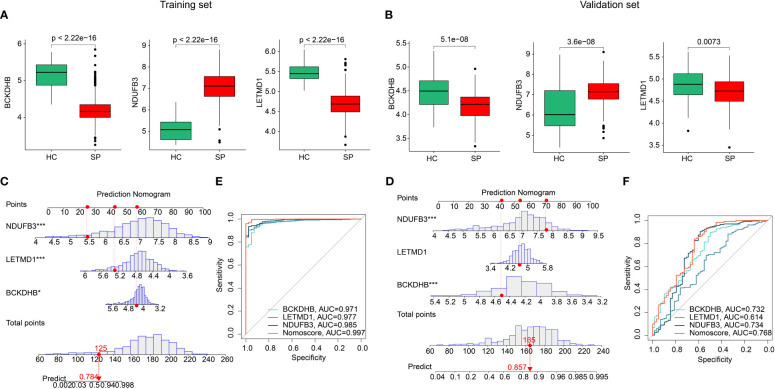
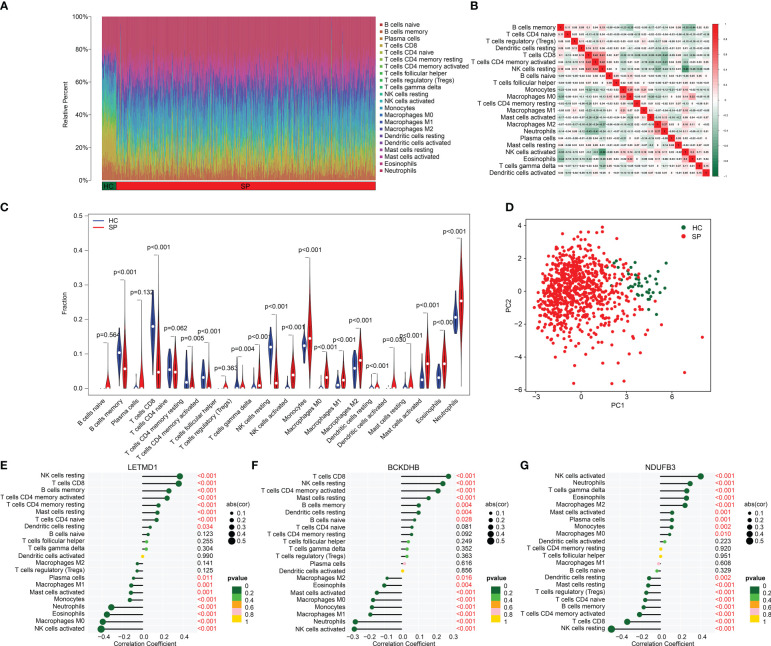
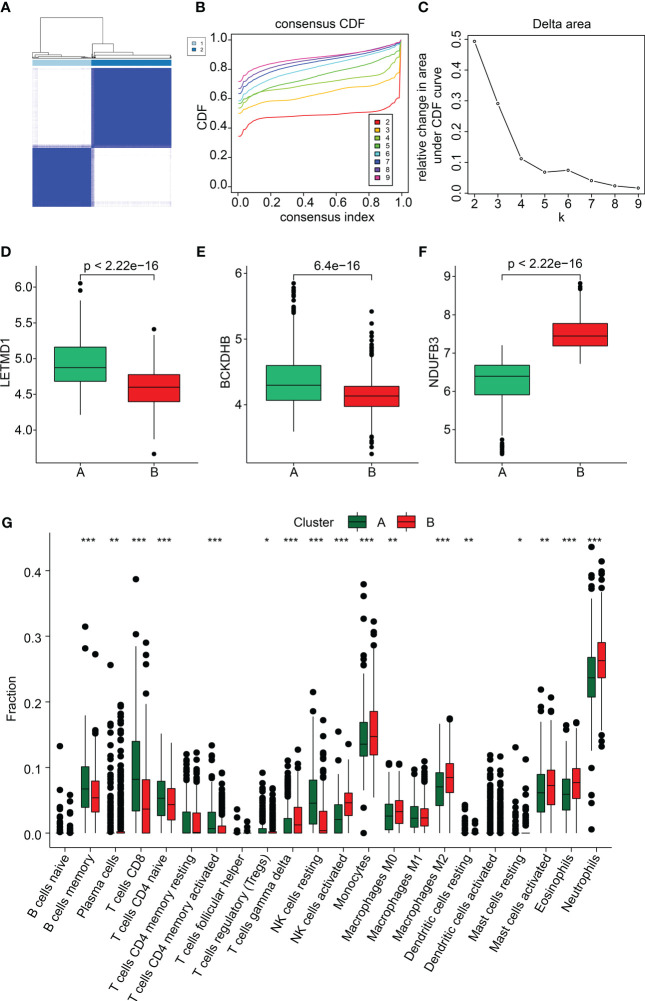
Methods: Three GEO datasets (GSE54514, GSE65682, and GSE95233) were used to explore the potential role of mitochondria-related genes (MiRGs) in sepsis. WGCNA and two machine learning algorithms (RF and LASSO) were used to identify the feature of MiRGs. Consensus clustering was subsequently carried out to determine the molecular subtypes for sepsis. CIBERSORT algorithm was conducted to assess the immune cell infiltration of samples. A nomogram was also established to evaluate the diagnostic ability of feature biomarkers via "rms" package.
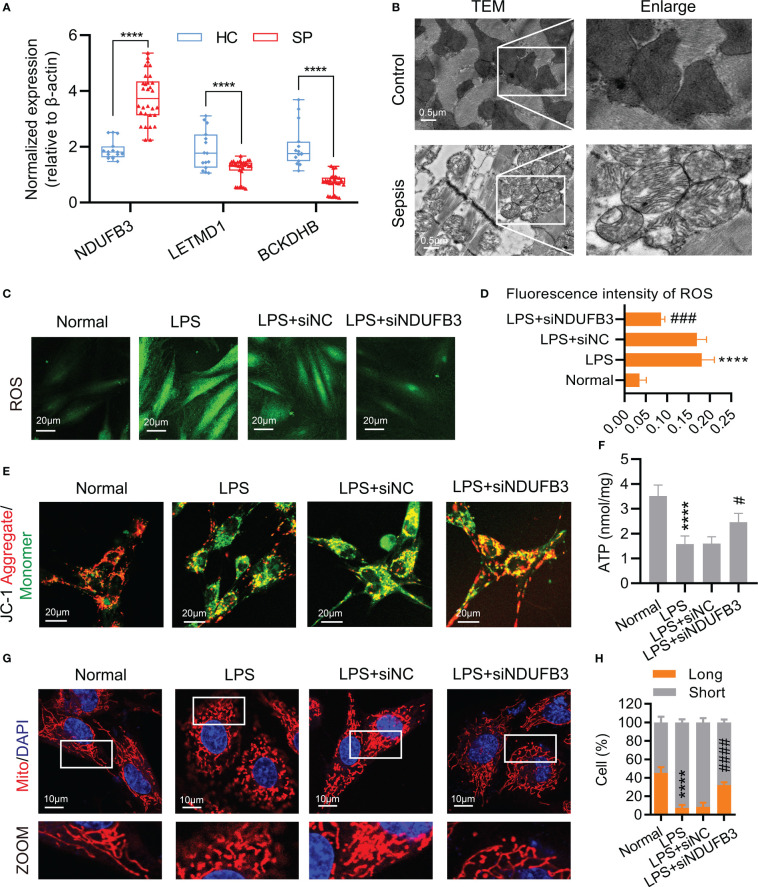
Results: Three different expressed MiRGs (DE-MiRGs) were identified as sepsis biomarkers. A significant difference in the immune microenvironment landscape was observed between healthy controls and sepsis patients. Among the DE-MiRGs, NDUFB3 was selected to be a potential therapeutic target and its significant elevated expression level was confirmed in sepsis using in vitro experiments and confocal microscopy, indicating its significant contribution to the mitochondrial quality imbalance in the LPS-simulated sepsis model.
Conclusion: By digging the role of these pivotal genes in immune cell infiltration, we gained a better understanding of the molecular immune mechanism in sepsis and identified potential intervention and treatment strategies.
Keywords: immune cell infiltration; machine learning algorithm; mito-chondrial quality imbalance; mitochondria; sepsis.
Copyright © 2023 Shu, She, Chen, Zhong, Zhu and Fang.
Conflict of interest statement
The authors declare that the research was conducted in the absence of any commercial or financial relationships that could be construed as a potential conflict of interest.
Figures

Similar articles
-
Precision therapy for ulcerative colitis: insights from mitochondrial dysfunction interacting with the immune microenvironment.Front Immunol. 2024 Jul 4;15:1396221. doi: 10.3389/fimmu.2024.1396221. eCollection 2024. Front Immunol. 2024. PMID: 39026683 Free PMC article.
-
Identification and validation of a novel mitochondrion-related gene signature for diagnosis and immune infiltration in sepsis.Front Immunol. 2023 Jun 15;14:1196306. doi: 10.3389/fimmu.2023.1196306. eCollection 2023. Front Immunol. 2023. PMID: 37398680 Free PMC article.
-
Construction and validation of a mitochondria-associated genes prognostic signature and immune microenvironment characteristic of sepsis.Int Immunopharmacol. 2024 Jan 5;126:111275. doi: 10.1016/j.intimp.2023.111275. Epub 2023 Nov 22. Int Immunopharmacol. 2024. PMID: 37995567
-
Identification and validation of key biomarkers based on RNA methylation genes in sepsis.Front Immunol. 2023 Aug 28;14:1231898. doi: 10.3389/fimmu.2023.1231898. eCollection 2023. Front Immunol. 2023. PMID: 37701433 Free PMC article.
-
The development of endoplasmic reticulum-related gene signatures and the immune infiltration analysis of sepsis.Front Immunol. 2023 Jun 6;14:1183769. doi: 10.3389/fimmu.2023.1183769. eCollection 2023. Front Immunol. 2023. PMID: 37346041 Free PMC article.
Cited by
-
Construction of a Novel Mitochondria-Associated Gene Model for Assessing ESCC Immune Microenvironment and Predicting Survival.J Microbiol Biotechnol. 2024 May 28;34(5):1164-1177. doi: 10.4014/jmb.2310.10052. Epub 2024 Feb 22. J Microbiol Biotechnol. 2024. PMID: 38719775 Free PMC article.
-
Investigating the role of itaconate in macrophage activation and oxidative stress injury in sepsis-associated acute kidney injury.Mol Biol Rep. 2024 Apr 20;51(1):533. doi: 10.1007/s11033-024-09462-0. Mol Biol Rep. 2024. PMID: 38642169
-
Machine learning-based B cell-related diagnostic biomarker signature and molecular subtypes characteristic of ulcerative colitis.Aging (Albany NY). 2024 Feb 5;16(3):2774-2788. doi: 10.18632/aging.205510. Epub 2024 Feb 5. Aging (Albany NY). 2024. PMID: 38319729 Free PMC article.
-
Downregulation of Gldc attenuates myocardial ischemia reperfusion injury in vitro by modulating Akt and NF-κB signalings.Sci Rep. 2025 Jan 2;15(1):268. doi: 10.1038/s41598-024-79445-5. Sci Rep. 2025. PMID: 39747134 Free PMC article.
-
A Novel RNA Methylation-Related Prognostic Signature and its Tumor Microenvironment Characterization in Hepatocellular Carcinoma.Technol Cancer Res Treat. 2024 Jan-Dec;23:15330338241276895. doi: 10.1177/15330338241276895. Technol Cancer Res Treat. 2024. PMID: 39155614 Free PMC article.
References
MeSH terms
Substances
LinkOut - more resources
Full Text Sources
Medical