. 2023 May 9:14:1185921.
doi: 10.3389/fimmu.2023.1185921. eCollection 2023.

Immunity and reproduction protective effects of Chitosan Oligosaccharides in Cyclophosphamide/Busulfan-induced premature ovarian failure model mice

Affiliations

Immunity and reproduction protective effects of Chitosan Oligosaccharides in Cyclophosphamide/Busulfan-induced premature ovarian failure model mice

Xiaoyan Li et al. Front Immunol. .

Abstract

Introduction: Premature ovarian failure (POF) is a major cause of infertility among women of reproductive age. Unfortunately, there is no effective treatment available currently. Researchers have shown that immune disorders play a significant role in the development of POF. Moreover, growing evidence suggest that Chitosan Oligosaccharides (COS), which act as critical immunomodulators, may have a key role in preventing and treating a range of immune related reproductive diseases.

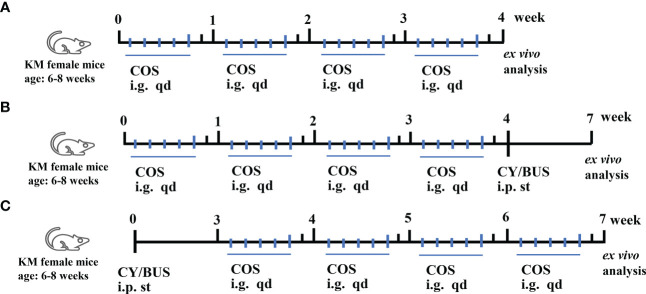
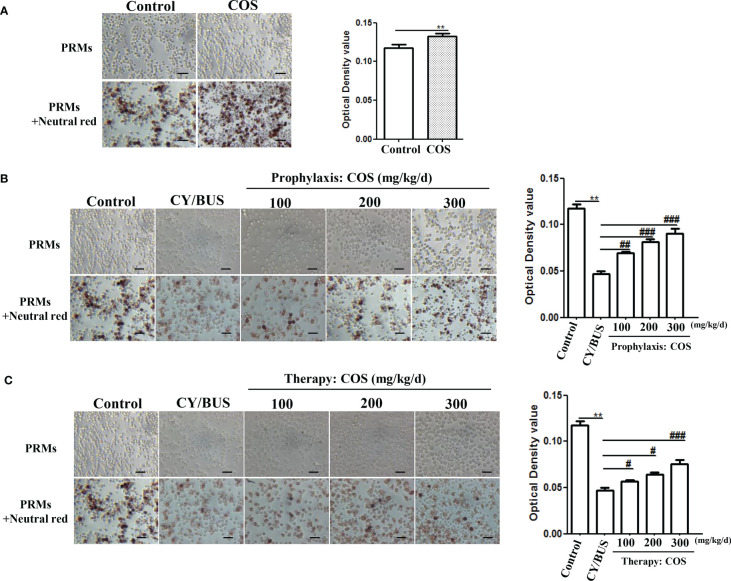
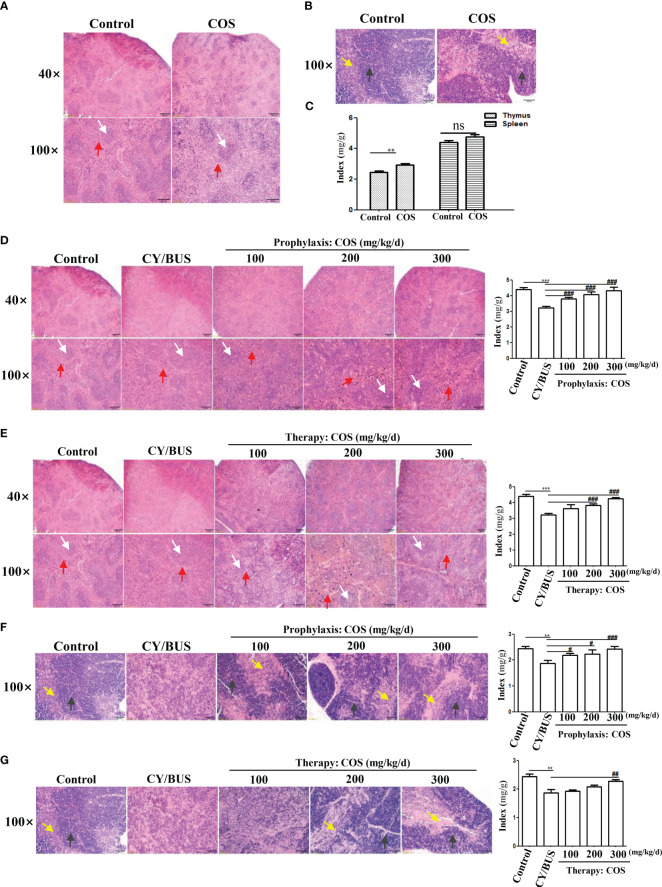
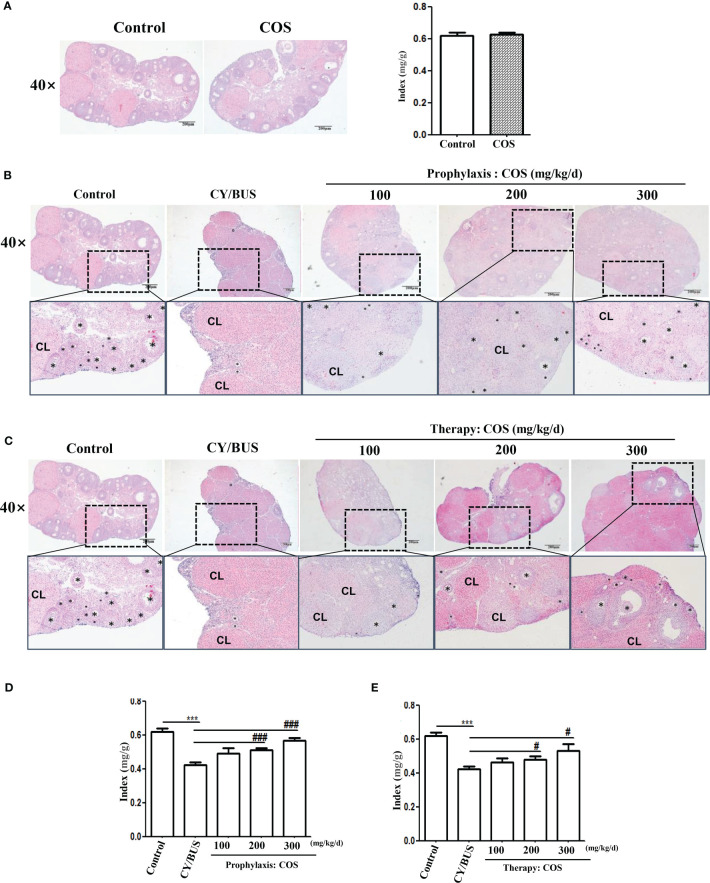
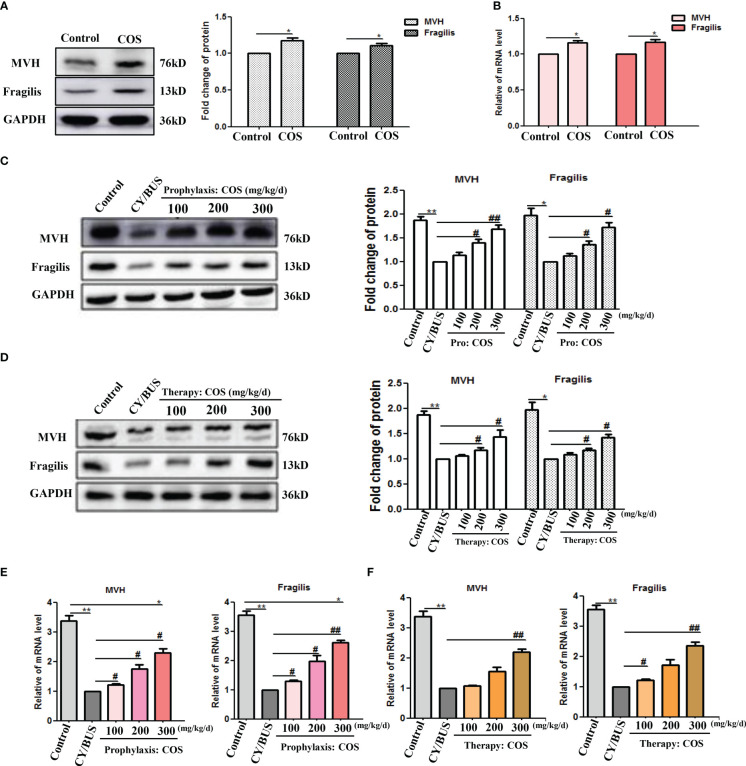
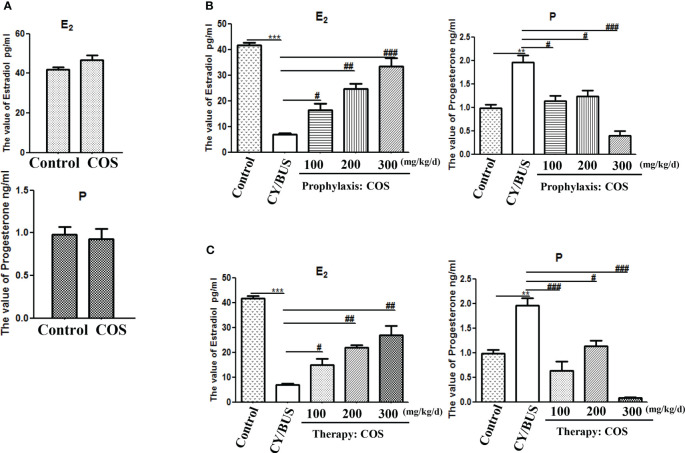
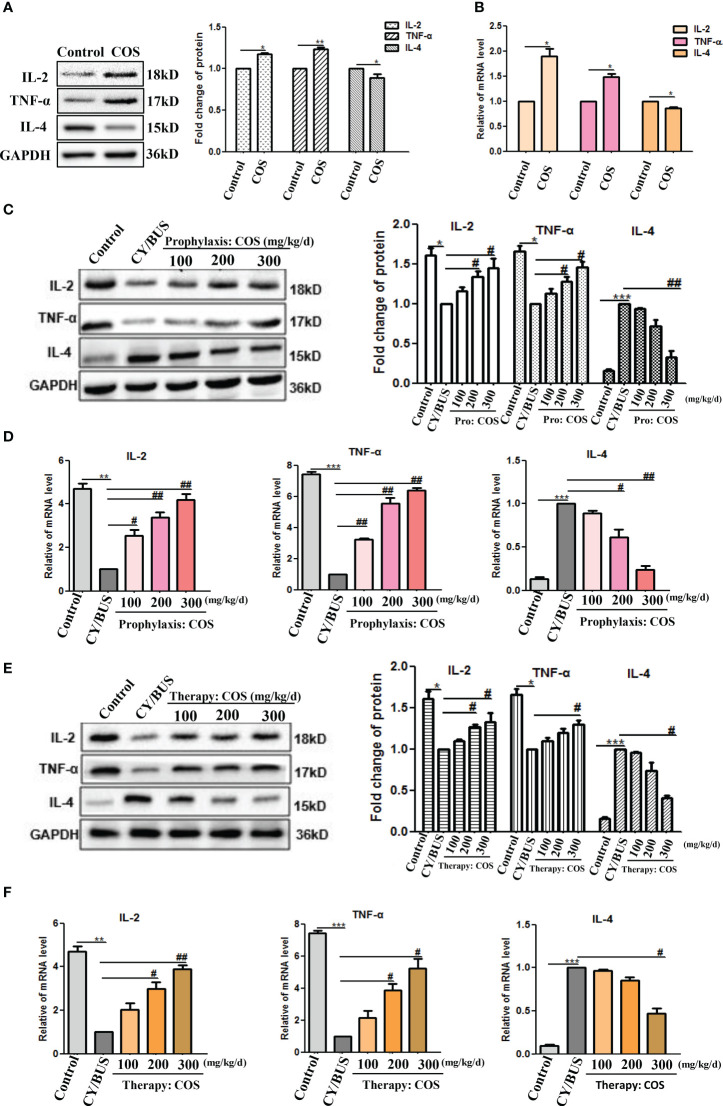
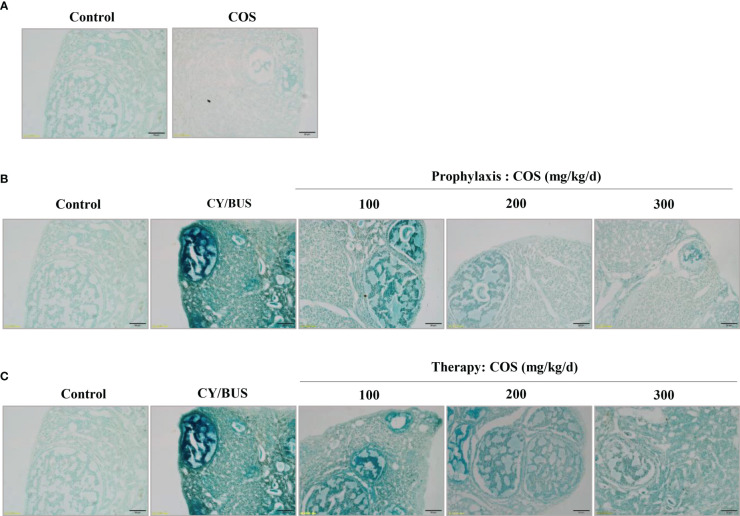
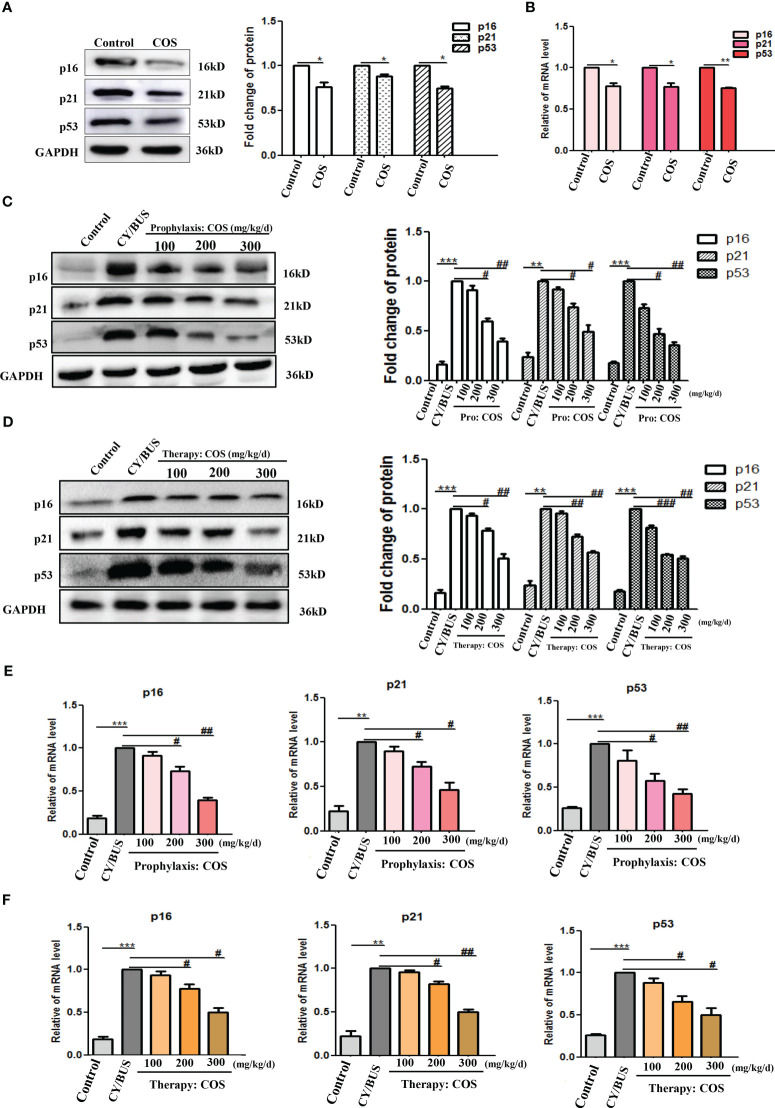
Methods: KM mice (6-8 weeks) received a single intraperitoneal injection of cyclophosphamide (CY, 120mg/kg) and busulfan (BUS, 30mg/kg) to establish POF model. After completing the COS pre-treatment or post-treatment procedures, peritoneal resident macrophages (PRMs) were collected for neutral erythrophagocytosis assay to detect phagocytic activity. The thymus, spleen and ovary tissues were collected and weighed to calculate the organ indexes. Hematoxylin-eosin (HE) staining was performed to observe the histopathologic structure of those organs. The serum levels of estrogen (E2) and progesterone (P) were measured via the enzyme-linked immunosorbent assay (ELISA). The expression levels of immune factors including interleukin 2 (IL-2), interleukin 4 (IL-4), and tumor necrosis factor α (TNF-α), as well as germ cell markers Mouse Vasa Homologue (MVH) and Fragilis in ovarian tissue, were analyzed by Western blotting and qRT-PCR. In addition, ovarian cell senescence via p53/p21/p16 signaling was also detected.

Results: The phagocytic function of PRMs and the structural integrity of thymus and spleen were preserved by COS treatment. The levels of certain immune factors in the ovaries of CY/BUS- induced POF mice were found to be altered, manifested as IL-2 and TNF-α experiencing a significant decline, and IL-4 presenting a notable increase. Both pre-treatment and post-treatment with COS were shown to be protective effects against the damage to ovarian structure caused by CY/BUS. Senescence-associated β-galactosidase (SA-β-Gal) staining results showed that COS prevents CY/BUS-induced ovarian cell senescence. Additionally, COS regulated estrogen and progesterone levels, enhanced follicular development, and blocked ovarian cellular p53/p21/p16 signaling which participating in cell senescence.

Conclusion: COS is a potent preventative and therapeutic medicine for premature ovarian failure by enhancing both the ovarian local and systemic immune response as well as inhibiting germ cell senescence.

Keywords: chitosan oligosaccharides; immunological function; ovarian function; premature ovarian failure; prophylaxis; therapy.


Conflict of interest statement

The authors declare that the research was conducted in the absence of any commercial or financial relationships that could be construed as a potential conflict of interest.

Figures

Figure 1
Figure 1
Mice treatment procedures. Mice received single, prophylactic or therapeutic applications of COS. (A) Mice were given COS (200mg/kg/d) intragastrically every day for the first five days of each week for four weeks, and ovarian and immune functions were assessed at the end of the experiment to evaluate any potential toxicity. (B) Mice received prophylactic treatment with varying doses of COS (100/200/300mg/kg/d) for five days each week, followed by a single intraperitoneal injection of CY/BUS. (C) Mice were given a single intraperitoneal injection of CY/BUS before undergoing a four-week therapeutic treatment with increasing concentrations of COS (100/200/300mg/kg/d). Ex vivo analyses were done as described.
Figure 2
Figure 2
COS enhance PRMs phagocytosis ability analyzed by Neutral Red staining. (A) Mice PRMs were collected and phagocytosis capacity were determined by Neutral Red assay after 4 weeks COS (200 mg/kg. d) treatment or not. COS increasing the PRMs phagocytosis compared with normal controls. Left: PRMs microscope images, right: statistical contrast of optical density (OD) value (n = 6, Mean ± SEM). (B) PRMs Neutral Red staining were carried out at the endpoint of COS prophylaxis procedure. COS prevented CY/BUS induced PRMs phagocytosis damage in a dose-dependent manner. Left: PRMs microscope images, right: statistical contrast of optical density (OD) value (n = 6, Mean ± SEM). (C) PRMs Neutral Red assay were done at the endpoint of COS therapy procedure. CY/BUS treatment decrease PRMs phagocytosis. This trend was dose-dependent reversed after COS therapy. Left: PRMs microscope images, right: statistical contrast of optical density (OD) value (n = 6, Mean ± SEM). **p<0.01, vs Control group. #p<0.05, ##p<0.01, ###p<0.001, vs CY/BUS group. Scale bars = 50μm.
Figure 3
Figure 3
Size and histological changes of the spleen and thymus. Mice spleen and thymus were collected at each treatment endpoint then detected timely. The ratio index of spleen and thymus to body weight were used to evaluate the tissue size changes. Histological changes were examined by HE staining. (A) Spleen HE staining from mice with or without COS (200 mg/kg. d) treatment. (B) Thymus HE staining from mice with or without COS (200 mg/kg. d) treatment. (C) Changes of spleen and thymus index after COS (200 mg/kg. d) treatment. (D, E) At the endpoint of COS prophylaxis (D) or therapy (E) procedure, mice spleen were collected for HE staining (left) and index calculation (right). (F, G) After COS prophylaxis (F) or therapy (G) procedure, mice thymus were collected for HE staining (left) and index calculation (right). White arrows: white pulp; Red arrows: red pulp. Yellow arrows: medulla; Black arrows: cortex. n = 6, Mean ± SEM. ns: no significant difference. **p<0.01, ***p<0.001 vs Control group. #p<0.05, ##p<0.01, ###p<0.001, vs CY/BUS group. Scale bars = 200μm for 40X lens, Scale bars = 100μm for 100X lens.
Figure 4
Figure 4
COS protect the CY/BUS induced morphological disruption of the ovary in a dose-dependent manner. At the end of each experimental procedure, the ovaries were removed and weighed to calculate the ovarian-to-body weight ratio. The ovaries were then sectioned and embedded in paraffin, and the maximum cross-section was stained with HE to examine the ovarian histopathological structure. (A) Ovary HE staining (left) and ratio index to body weight (right) from mice with or without COS (200 mg/kg. d) treatment. (B) Ovary HE staining from mice under prophylaxis treatment procedure. (C) Ovary HE staining from mice under therapy treatment procedure. (D, E) Mice ovary ratio index to body weight from prophylaxis procedure (D) and therapy procedure (E). Black plum: follicle. CL: corpus luteum. n=6, Mean ± SEM. ns: no significant difference. ***p<0.001 vs Control group. #p<0.05, ###p<0.001, vs CY/BUS group. Scale bars = 200μm.
Figure 5
Figure 5
COS regulate mice ovarian germ-cell development. After drug treatment, total protein and mRNA were extracted from mouse ovaries and analyzed by western blot and qRT-PCR respectively to determine the development of germ cells. (A, B) MVH and Fragilis protein (A) and mRNA (B) lever in ovaries from mice treated with or without COS (200 mg/kg. d). (C) MVH and Fragilis protein detection results from mice ovaries after prophylaxis procedure. Left: western blot protein bands. Right: western blot densitometry values analysis result. (D) MVH and Fragilis protein detection results from mice ovaries after therapy procedure. Left: western blot protein bands. Right: western blot densitometry values analysis result. (E, F) MVH and Fragilis mRNA expression results in mice ovaries after prophylaxis procedure (E) and therapy procedure (F). n=3, Mean ± SEM. *p<0.05, **p<0.01, ***p<0.001 vs Control group. #p<0.05, ##p<0.01 vs CY/BUS group.
Figure 6
Figure 6
Serum levels of estradiol and progesterone. At endpoint after each treatment procedure, serum samples were obtained for the analysis. Concentrations of estradiol and progesterone were determined in duplicate using radioimmunoassay. (A) Serum hormone levels from mice with or without COS treatment. Top: estradiol, bottom: progesterone. (B) Serum levels of estradiol (Left) and progesterone (Right) were measured after prophylaxis procedure. (C) Serum levels of estradiol (Left) and progesterone (Right) from mice with therapy treatment procedure. n=6, Mean ± SEM. **p<0.01, ***p<0.001 vs Control group. #p<0.05, ##p<0.01, ###p<0.001 vs CY/BUS group.
Figure 7
Figure 7
COS regulate the levels of immune cytokines IL-2, TNF-α and IL-4 in mice ovaries. At the endpoint of each treatment procedure, ovaries were collected then homogenized. Western blot performed on ovarian protein for IL-2, TNF-α and IL-4, qRT-PCR results showing mRNA expression of inflammation related genes IL-2, TNF-α and IL-4. A-B. IL-2, TNF-α and IL-4 protein (A) and mRNA (B) lever in ovaries from mice treated with or without COS (200 mg/kg. d). (C) IL-2, TNF-α and IL-4 proteins from mice after prophylaxis procedure were detected. Left: western blot protein bands. Right: western blot densitometry values analysis result. (D) IL-2, TNF-α and IL-4 mRNA detection results after prophylaxis procedure. (E) IL-2, TNF-α and IL-4 proteins results from mice after therapy procedure were detected. Left: western blot protein bands. Right: western blot densitometry values analysis result. (F) IL-2, TNF-α and IL-4 mRNA detection results after therapy procedure. n=3, Mean ± SEM. *p<0.05, **p<0.01, ***p<0.001 vs Control group. #p<0.05, ##p<0.01 vs CY/BUS group.
Figure 8
Figure 8
Senescence-associated β-galactosidase staining in mice ovarian tissue. The ovarian tissues were subjected to SA-β-Gal staining to assess the impact of COS and CY/BUS on the senescence of ovarian cells. (A) Ovarian section microphotographs after the SA-β-Gal staining patterns in mice that received either COS (200mg/kg/d) or no treatment. The staining intensity in the ovaries of the CY/BUS-induced POF mice was markedly higher compared to that of the control mice (B, C). (B) Microphotographs depict the dose-dependent reduction in the SA-β-Gal staining intensity in the ovaries of mice that received COS prophylaxis. (C) Images demonstrate the dose-dependent decrease in the SA-β-Gal staining intensity in the ovaries of mice that received COS therapy. Scale bars = 50μm.
Figure 9
Figure 9
COS down-regulate p53/p21/p16 signaling axis in mice ovaries. After drug treatment, total protein and mRNA were extracted from mouse ovaries then analyzed by western blot and qRT-PCR respectively to determine the cellular senescence via p16, p21 and p53. (A, B) p16, p21 and p53 protein (A) and mRNA (B) lever in ovaries from mice treated with or without COS (200 mg/kg. d). (C) p16, p21 and p53 protein detection results from mice ovaries after prophylaxis procedure. Left: western blot protein bands. Right: western blot densitometry values analysis result. (D) p16, p21 and p53 protein detection results from mice ovaries after therapy procedure. Left: western blot protein bands. Right: western blot densitometry values analysis result. (E, F). p16, p21 and p53 mRNA expression results in mice ovaries after prophylaxis procedure (E) and therapy procedure (F). n=3, Mean ± SEM. *p<0.05, **p<0.01, ***p<0.001 vs Control group. #p<0.05, ##p<0.01 vs CY/BUS group.

References

    1. Craciunas L, Zdoukopoulos N, Vinayagam S, Mohiyiddeen L. Hormone therapy for uterine and endometrial development in women with premature ovarian insufficiency. Cochrane Database systematic Rev (2022) 10:Cd008209. doi: 10.1002/14651858.CD008209.pub2 - DOI - PMC - PubMed
    1. Chon SJ, Umair Z, Yoon MS. Premature ovarian insufficiency: past, present, and future. Front Cell Dev Biol (2021) 9:672890. doi: 10.3389/fcell.2021.672890 - DOI - PMC - PubMed
    1. Schover LR. Premature ovarian failure and its consequences: vasomotor symptoms, sexuality, and fertility. J Clin Oncol (2008) 26:753–8. doi: 10.1200/jco.2007.14.1655 - DOI - PubMed
    1. Broekmans FJ, Soules MR, Fauser BC. Ovarian aging: mechanisms and clinical consequences. Endocrine Rev (2009) 30:465–93. doi: 10.1210/er.2009-0006 - DOI - PubMed
    1. Chiang JL, Shukla P, Pagidas K, Ahmed NS, Karri S, Gunn DD, et al. Mitochondria in ovarian aging and reproductive longevity. Ageing Res Rev (2020) 63:101168. doi: 10.1016/j.arr.2020.101168 - DOI - PMC - PubMed

Publication types