. 2023 May 9:11:1156138.
doi: 10.3389/fcell.2023.1156138. eCollection 2023.

Integrated multi-omics analysis reveals insights into Chinese forest musk deer (Moschus berezovskii) genome evolution and musk synthesis

Affiliations

Integrated multi-omics analysis reveals insights into Chinese forest musk deer (Moschus berezovskii) genome evolution and musk synthesis

Hui Feng et al. Front Cell Dev Biol. .

Abstract

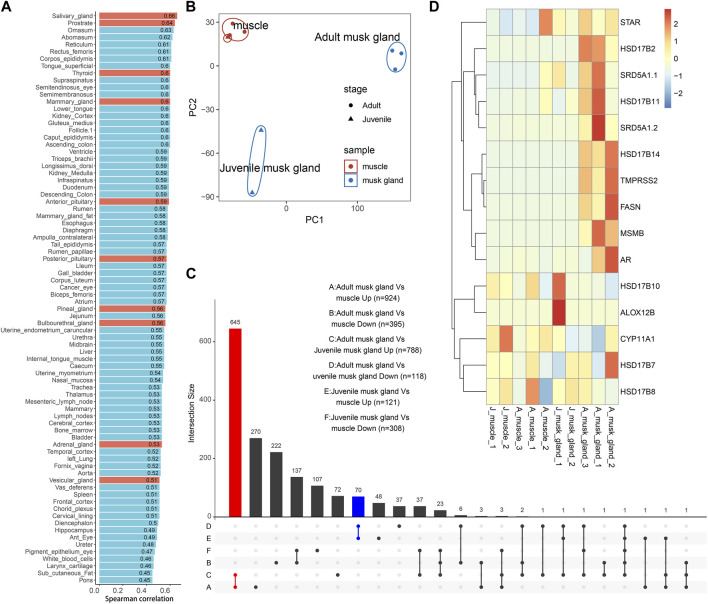
Among the artiodactyls, male animals belonging to the Family Moschidae have a unique tissue, the musk gland, with the capability of musk synthesis. However, the genetic basis of musk gland formation and musk production are still poorly understood. Here, musk gland tissues from two juvenile and three adult Chinese forest musk deer (Moschus berezovskii) were utilized to analyze genomic evolution events, evaluate mRNA profiles and investigate cell compositions. By performing genome reannotation and comparison with 11 ruminant genomes, three expanded gene families were identified in the Moschus berezovskii genome. Transcriptional analysis further indicated that the musk gland displayed a prostate-like mRNA expression pattern. Single-cell sequencing revealed that the musk gland is composed of seven distinguishable cell types. Among them, sebaceous gland cells and luminal epithelial cells play important roles in musk synthesis, while endothelial cells master the regulation of cell-to-cell communication. In conclusion, our study provides insights into musk gland formation and the musk-synthesizing process.

Keywords: Moschus berezovskii; cell composition; integrated analysis; musk gland; single cell sequencing.


Conflict of interest statement

The authors declare that the research was conducted in the absence of any commercial or financial relationships that could be construed as a potential conflict of interest.

Figures

FIGURE 1
FIGURE 1
Comparative genomic analysis of 11 ruminants. (A) Gene family expansion and contraction of 11 ruminants. Branch numbers indicate the number of gene families that have expanded (green) and contracted (red) after the split from the common ancestor. (B) The copy numbers of Srd5a1, Serpinb6 and Safb1/2 in 11 ruminant genomes. (C) The expression pattern of individual copies of Srd5a1, Serpinb6 and Safb1/2 in muscles and musk glands of juvenile and adult Chinese forest musk deer. The grey colour represents the mRNA expression can’t be detected.
FIGURE 2
FIGURE 2
Bulk transcriptomic profiles of muscles and musk glands of adult and juvenile Chinese forest musk deer M. berezovskii. (A) Spearman correlation of expression profiles compared between adult musk glands and various B. taurus tissues. Glands of B. taurus are shown in red. (B) PCA plot of expression profiles of adult and juvenile musk glands and muscle samples. The colors of the points represent different tissue types, and the shapes of the points represent different sample stages. (C) UpSet plots showing the number of shared differentially expressed genes (|log2FoldChange|>1 and p <0.05) detected from different pairwise comparisons. The adult musk gland-specifically upregulated genes are shown in red (adult musk gland compared against juvenile musk glands and muscles, n = 645); the juvenile musk gland-specifically upregulated genes are shown in blue (juvenile musk gland compared against adult musk glands and muscles, n = 70). (D) Heatmap plot of the expression pattern of genes related to fatty acid synthesis and steroid hormone metabolism.
FIGURE 3
FIGURE 3
RT-PCR analysis of mRNA expression in musk gland and muscle. All quantitative data were obtained from three independent experiments and presented as the mean ± S.E.M. (**p < 0.01).
FIGURE 4
FIGURE 4
Single-cell transcriptomic profiles of musk glands of adult and juvenile Chinese forest musk deer. (A) UMAP projection of 8,465 musk gland cells, colored by phase. (B) Colored by cell type. (C,D) Cell type compositions of adult and juvenile musk glands. (E) The cell type level expression patterns of adult (left, n = 645) and juvenile (right, n = 70) musk glands specifically upregulated genes (detected by bulk RNA-seq). The height of the bar represents the percentage of expressed cells, and the color represents the normalized expression level.
FIGURE 5
FIGURE 5
Characteristics and cell-to-cell columniations of 4 main musk gland cell types. (A) Boxplots depicting the distribution of single-cell GSVA scores of pathways in different cell types from adult and juvenile samples. (B) Chord diagrams plotting the amount of inferred ligand-receptor signaling across different cell types. Each line represents a ligand-receptor interaction with both ligand and receptor detection rate >0.1. (C) Heatmap of ligand-receptor average expression weight across different cell types.

References

    1. Andrews S. (2023). FastQC: A quality control tool for high throughput sequence data. Available online: http://www.bioinformatics.babraham.ac.uk/projects/fastqc (accessed January 4th, 2023).
    1. Becht E., McInnes L., Healy J., Dutertre C. A., Kwok I. W. H., Ng L. G., et al. (2019). Dimensionality reduction for visualizing single-cell data using UMAP. Nat. Biotechnol. 37, 38–44. 10.1038/nbt.4314 - DOI - PubMed
    1. Bolger A. M., Lohse M., Usadel B. (2014). Trimmomatic: A flexible trimmer for Illumina sequence data. Bioinformatics 30, 2114–2120. 10.1093/bioinformatics/btu170 - DOI - PMC - PubMed
    1. Charron Y., Madani R., Nef S., Combepine C., Govin J., Khochbin S., et al. (2006). Expression of serpinb6 serpins in germ and somatic cells of mouse gonads. Mol. Reprod. Dev. 73 (1), 9–19. 10.1002/mrd.20385 - DOI - PubMed
    1. Choudhary S., Satija R. (2022). Comparison and evaluation of statistical error models for scRNA-seq. Genome Biol. 23, 27. 10.1186/s13059-021-02584-9 - DOI - PMC - PubMed