. 2023 Apr 4;3(5):100290.
doi: 10.1016/j.xgen.2023.100290. eCollection 2023 May 10.

Human variation impacting MCOLN2 restricts Salmonella Typhi replication by magnesium deprivation

Affiliations

Human variation impacting MCOLN2 restricts Salmonella Typhi replication by magnesium deprivation

Kyle D Gibbs et al. Cell Genom. .

Abstract

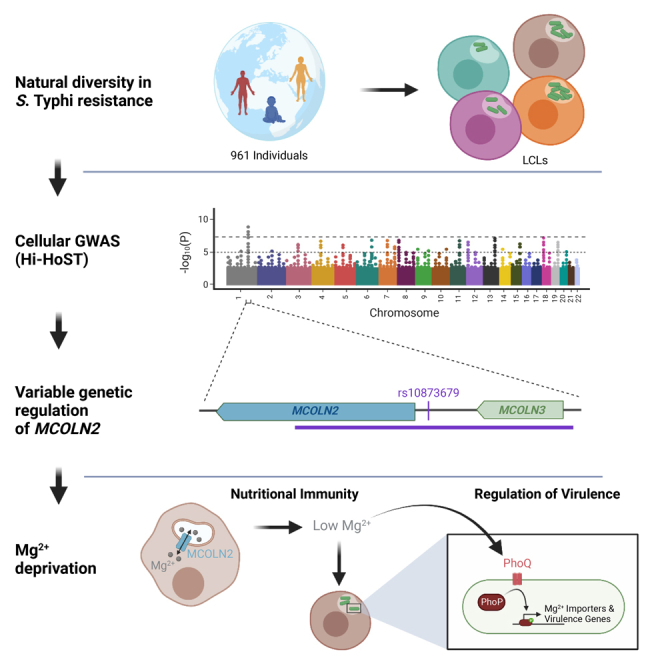
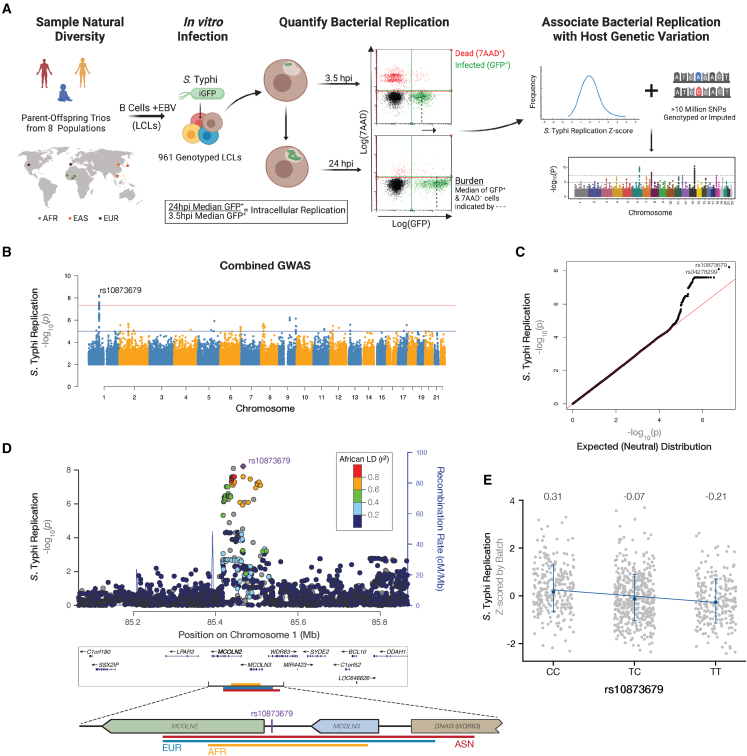
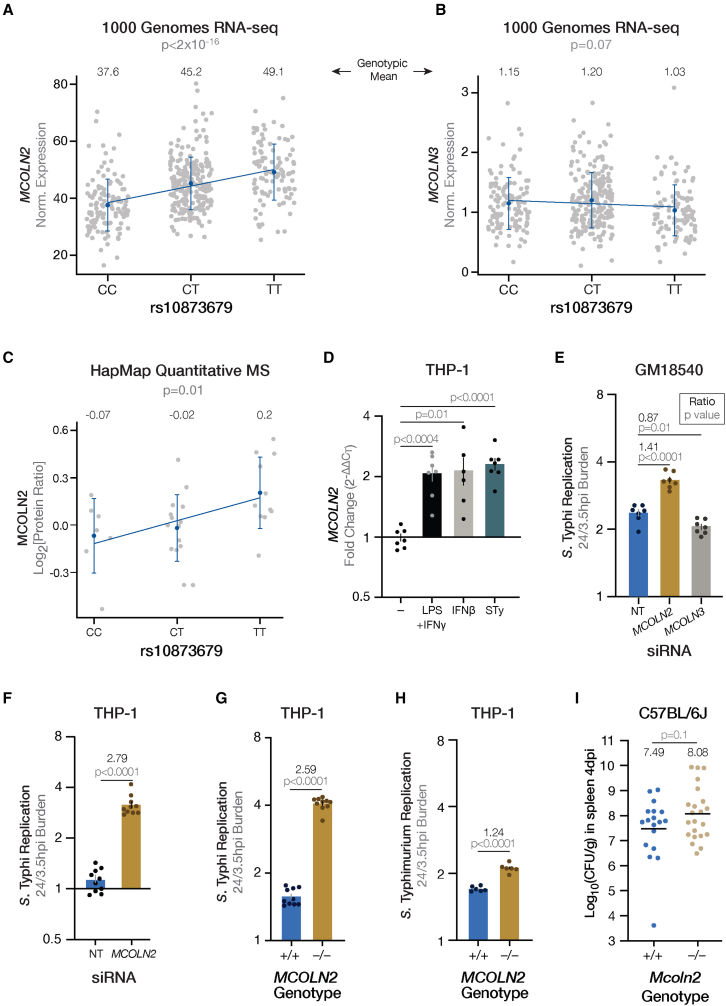
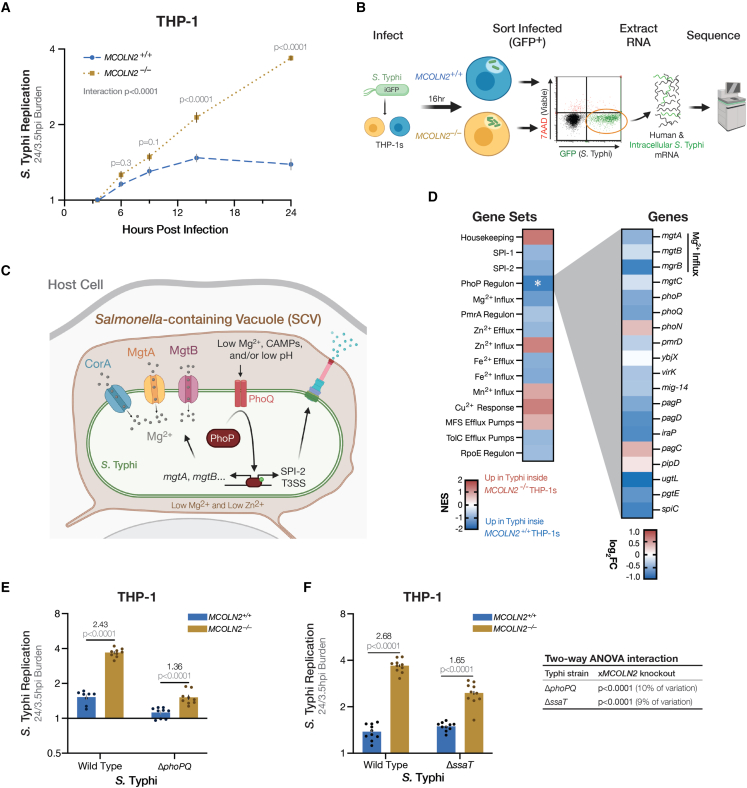
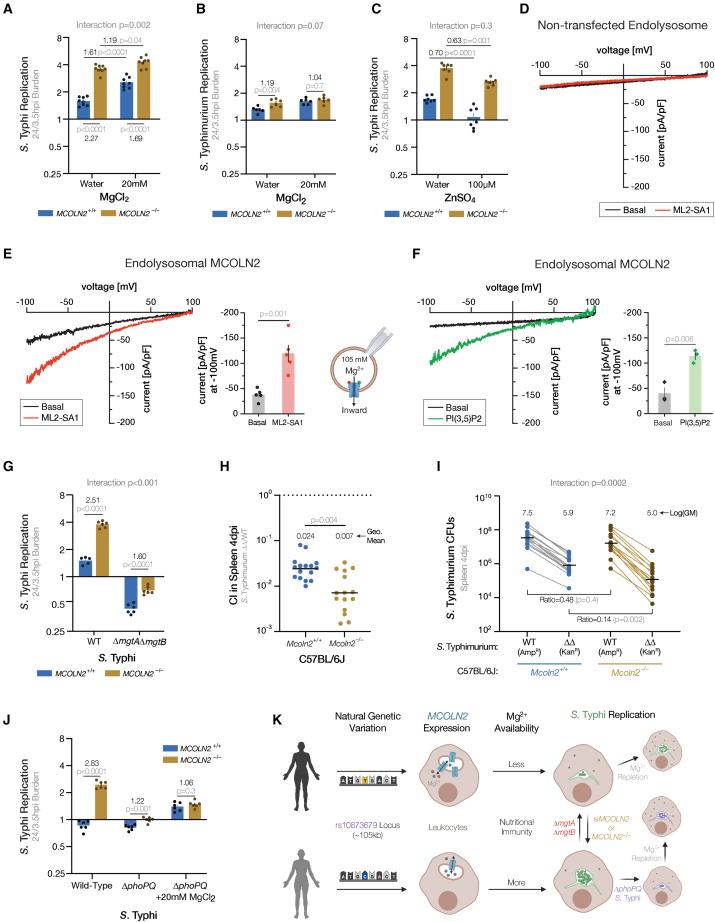
Human genetic diversity can reveal critical factors in host-pathogen interactions. This is especially useful for human-restricted pathogens like Salmonella enterica serovar Typhi (S. Typhi), the cause of typhoid fever. One key defense during bacterial infection is nutritional immunity: host cells attempt to restrict bacterial replication by denying bacteria access to key nutrients or supplying toxic metabolites. Here, a cellular genome-wide association study of intracellular replication by S. Typhi in nearly a thousand cell lines from around the world-and extensive follow-up using intracellular S. Typhi transcriptomics and manipulation of magnesium availability-demonstrates that the divalent cation channel mucolipin-2 (MCOLN2 or TRPML2) restricts S. Typhi intracellular replication through magnesium deprivation. Mg2+ currents, conducted through MCOLN2 and out of endolysosomes, were measured directly using patch-clamping of the endolysosomal membrane. Our results reveal Mg2+ limitation as a key component of nutritional immunity against S. Typhi and as a source of variable host resistance.

Keywords: GWAS; Hi-HOST; MgtA; PhoPQ; RNA-seq; SPI-2; THP-1; eQTL; lymphoblastoid cell line; rs10873679.


Conflict of interest statement

The authors declare no competing interests.

Figures

None
Graphical abstract
Figure 1
Figure 1
Cellular GWAS associates the rs10873679 locus with S. Typhi intracellular replication (A) Hi-HoST cellular GWAS workflow. LCLs (Epstein-Barr virus [EBV]-immortalized B cells) were generated from eight populations sampled during the 1000 Genomes and HapMap Projects. The population locations are indicated on the map with dots color coded by continental ancestry. Green dots are three populations of African (AFR) ancestry: Esan in Nigeria (ESN), Gambians in the Western Division—Mandinka (GWD), and Yoruba in Ibadan, Nigeria (YRI). Orange dots are three populations of East Asian (EAS) ancestry: Kinh in Ho Chi Minh City, Vietnam (KHV); Han Chinese in Beijing, China (CHB); and Japanese in Tokyo, Japan (JPT). Brown dots are two populations of European (EUR) ancestry: Utah residents with northern and western European ancestry from the Center d'Etude du Polymorphisme Humain (CEPH) collection (CEU) and Iberian populations in Spain (IBS). Abbreviations used: iGFP, IPTG-inducible green fluorescent protein; hpi, hours post infection; 7AAD, 7-aminoactinomycin D cell viability stain; SNP, single-nucleotide polymorphism. (B) Manhattan plot of cellular GWAS. p values were calculated using QFAM parents on the Z scored replication ratios (orange line, p < 5 × 10−8). The lead SNP on chromosome 1 is rs10873679 (p = 6 × 10−9). (C) GWAS of S. Typhi intracellular replication has p values lower than expected from a neutral, χ2, distribution (red line). (D) A local Manhattan plot of the S. Typhi replication-associated locus on chromosome 1 (hg19 build) spans 400 kb up- and downstream of rs10873679. Dots for each SNP are color coded by African (AFR) linkage disequilibrium (LD) (r2) from 1000 genomes Nov 2014 release. A 185 kb zoom in on the MCOLN2/3 region highlights the lead SNP’s location and indicates regions well linked (r2 > 0.6) with rs10873679 by continental ancestry: African with a 71 kb orange bar; European (EUR) with a 121 kb blue bar; and Asian (ASN) with a 138 kb red bar. (E) The rs10873679 C-allele is associated with increased S. Typhi replication. Means for each genotype are indicated above the scatterplots. Bars are ± SD. Regression slope (β = −0.26 ± 0.04) is significantly less than zero (p = 1.7 × 10−9).
Figure 2
Figure 2
Increased mucolipin-2 expression restricts S. Typhi replication in human immune cell lines (A) The rs10873679 C-allele associates with less MCOLN2 mRNA expression in 1000 Genomes Project LCLs. Linear regression of 448 LCLs (238 females and 210 males) is significant (β = 5.8 ± 0.6; p < 2 × 10−16; adjusted r2 = 0.166). (B) The rs10873679 genotype does not associate with MCOLN3 mRNA expression in the same dataset (β = −0.05 ± 0.03; p = 0.07; adjusted r2 = 0.005). LCLs in (A) and (B) are from four European populations (91 CEU, 92 FIN, 86 GBR, and 91 TSI) and one African population (88 YRI) and consist of 124 CC, 217 TC, and 107 TT individuals. (C) The rs10873679 C-allele associates with less MCOLN2 protein expression in 33 LCLs (19 female and 14 male) measured with quantitative mass spectrometry. LCLs are from four populations: 18 CEU, 10 YRI, 4 CHB, and 1 JPT. Linear regression is significant for MCOLN2 (β = 0.15 ± 0.05, p = 0.01; adjusted r2 = 0.017). In (A)–(C), bars are mean ± SD. (D) Both interferon treatment and S. Typhi (STy) infection (MOI 10 for 24 h) stimulate MCOLN2 expression in THP-1s. Expression measured by qRT-PCR and quantified by ΔΔCT (ΔCT stimulated – ΔCT untreated). Seven replicates from three experiments. p values are from Dunnett’s T3 comparison after Welch’s ANOVA (p < 0.0001). (E) In the LCL GM18540 (derived from a female CHB), MCOLN2 knockdown increases S. Typhi replication, while MCOLN3 knockdown modestly decreases S. Typhi replication in comparison with non-targeting (NT) siRNA. Seven replicates from three experiments. Knockdown qPCR: 0.33-fold (±0.14) of NT MCOLN2 expression and 0.53-fold (±0.04) of NT MCOLN3 expression. p values are from Dunnett post-hoc comparison with NT following a one-way ANOVA (main effect p < 0.0001). (F) MCOLN2 knockdown (0.09-fold [±0.02] of NT) increases S. Typhi replication in THP-1s. Ten replicates from two experiments. (G) CRISPR-Cas9 knockout of MCOLN2 increases S. Typhi replication in THP-1s. Ten replicates from two experiments. (H) S. Typhimurium has a minor growth advantage in MCOLN2 knockout THP-1s. Six replicates from two experiments. In (E)–(H), ratios are mean in siRNA-treated/NT or knockout/wild-type cells. In (D)–(H), bars are mean ± SEM and all statistics are calculated with log2-transformed data. (I) Mcoln2 knockout does not significantly increase burden in C57BL/6J mice spleens 4 days post i.p. infection with 1,000 CFUs of late-log S. Typhimurium (14028s) tagged with p67GFP3.1. Eighteen wild types (10 female and 8 male) and 22 knockouts (13 female and 9 male) from six experiments. Lines are geometric means and log10(geo. mean) is shown above each genotype. p value calculated with log10-transformed data. Without the low outlier (log10[CFU] = 3.6; identified at Grubbs’ α = 0.01), the Mcoln2+/+ log10(geo. mean) is 7.72 and p = 0.2. In (E)–(I), p values are from Welch’s t test.
Figure 3
Figure 3
Intracellular S. Typhi replication inside MCOLN2−/− THP-1s depends on PhoP/Q (A) MCOLN2 knockout leads to faster S. Typhi replication inside THP-1s. Ten replicates from three experiments, except 6 hpi is six replicates from two experiments. MCOLN2 genotype, hpi, and their interaction are all significant sources of variation (p < 0.0001) in a repeated measures ANOVA. Time point p values are from Šídák’s post-hoc comparison of MCOLN2+/+ and MCOLN2−/−. (B) Workflow used to sequence mRNA from intracellular S. Typhi 16 hpi in wild-type and knockout THP-1s (C) Diagram of S. Typhi’s PhoPQ-induced Mg2+ importers. (D) RNA-seq of intracellular S. Typhi indicates that PhoP targets are upregulated more when MCOLN2 is present. Left: normalized enrichment score (NES) from gene set enrichment analysis of virulence- or cation-associated S. Typhi gene sets. Significant gene set (FDR q < 0.05) indicated by asterisk. Right: the log2(KO/WT expression) of PhoPQ regulon genes is plotted. Sixteen of 19 genes have a negative fold change (FC), indicating higher expression in WT. (E) PhoPQ is required for most of the increase in intracellular replication observed with MCOLN2−/− THP-1s. Nine replicates from two experiments. (F) S. Typhi ΔssaT has no effect on intracellular replication in WT THP-1s and partially accounts for the requirement of phoPQ to achieve maximal replication in MCOLN2−/− THP-1s. Ten replicates from three experiments. p values in (E) and (F) are from Šídák’s comparison of MCOLN2+/+ to MCOLN2−/− following two-way ANOVAs finding significant main effects and interaction (all p < 0.0001). Statistics in (A), (E), and (F) use log2-transformed replication ratios. Bars in (A), (E), and (F) are mean ± SEM.
Figure 4
Figure 4
MCOLN2 reduces Salmonella replication by reducing magnesium availability (A) Mg2+ supplementation partially rescues S. Typhi replication in MCOLN2−/− THP-1s. Eight replicates from two experiments. Mg2+ supplementation and MCOLN2 genotype are both significant (p < 0.0001) in two-way ANOVA. Bar plots throughout figure are mean ± SEM. (B) Mg2+ supplementation overcomes the slight restriction of S. Typhimurium by MCOLN2 in THP-1 monocytes. Six replicates from two experiments. Both supplementation (p = 0.0004) and MCOLN2 genotype (p = 0.006) are significant sources of variation by two-way ANOVA. (C) Zn2+ supplementation reduces S. Typhi replication in THP-1 monocytes independently from MCOLN2 genotype. Seven replicates from two experiments. In a two-way ANOVA, Zn2+ supplementation and MCOLN2 genotype are significant sources of variation (p < 0.0001), but their interaction is not (p = 0.3). In (A)–(C), mock is the addition of an equal volume filter-sterilized DI water and p values comparing means are from Tukey’s post-hoc multiple comparison tests. (D) No significant ML2-SA1-evoked Mg2+ currents were recorded from endolysosomes isolated from non-transfected HEK293 cells. Representative I-V traces of human MCOLN2-mediated whole-endolysosome Mg2+ currents before (black, basal) and after (red) treatment with the MCOLN2 small-molecule agonist ML2-SA1. (E) MCOLN2 conducts Mg2+ in endolysosomes when treated with ML2-SA1. A representative recording of Mg2+ currents from isolated endolysosomes expressing human MCOLN2 is shown. Bar plots show mean values ± SEM at −100 mV from independent experiments. p values from paired t test. The cartoon of whole-endolysosome patch-clamp configuration indicates the direction of the inward (flow out of the vesicles) Mg2+ currents mediated by MCOLN2. (F) Natural MCOLN2 agonist, PI(3,5)P2, also elicits Mg2+ currents through MCOLN2. Representative Mg2+ currents from endolysosomes isolated from MCOLN2 transfected HEK293 cells, basal (black) or elicited by an application of 10 μM PI(3,5)P2 (green). Statistical summary same as (E). (G) PhoPQ-induced magnesium importers MgtA and MgtB are required for half the S. Typhi replication benefit in MCOLN2−/− THP-1s. Six replicates from two experiments. In a two-way ANOVA, MCOLN2 genotype, mgtA/mgtB deletion, and their interaction are all significant sources of variation (p < 0.0001). In (B), (C), and (G), p values comparing two means are from post-hoc Šidák’s multiple comparison tests. (H) The fitness disadvantage of an S. Typhimurium ΔmgtAΔmgtB mutant (ΔΔ) competing against wild-type (WT) S. Typhimurium is enhanced when competing in Mcoln2−/− mice. Spleens harvested 4 dpi with 1,000 CFUs of each WT and ΔΔ S. Typhimurium inoculum. Lines indicate geometric means (GM) of competitive indices (CI) and shown above each mouse genotype. One outlier (CI = 1.21) in Mcoln2+/+ was identified by a Grubbs’ test (α = 0.0001) and removed. p value from Welch’s t test. Outlier test and t test calculated on log10(CFUs). Sixteen Mcoln2+/+ mice (10 female and 6 male) and 15 Mcoln2−/− mice (4 female and 11 male) from 4 experiments. (I) The enhanced CI in Mcoln2−/− mice is driven by ΔΔ S. Typhimurium replicating less inside Mcoln2−/− than Mcoln2+/+ mice. Data are from the same experiments and mice as in (H) and exclude the same outlier. Diagonal lines connect CFU counts from the same mouse while horizontal black lines indicate the log10-geometric mean (GM) of each group. Ratios are GM in Mcoln2−/− mice over GM in Mcoln2+/+ mice. Interaction p value is from repeated measure two-way ANOVA in which CFUs from the same mouse are paired. Mouse Mcoln2 genotype (p = 0.02), bacteria mgtA/B genotype (p < 0.0001), and their interaction (p = 0.0002) are all significant sources of variation. p values comparing conditions are from post-hoc Šídák’s multiple comparison tests. All statistics calculated using log10[CFUs]. (J) MCOLN2 knockout does not benefit ΔphoPQ S. Typhi replication inside THP-1s when Mg2+ is repleted. Six replicates from two experiments. In a three-way ANOVA, MgCl2 treatment, phoPQ deletion, MCOLN2 genotype, and all two-way interactions are significant (p < 0.0001). p values comparing two means are from post-hoc Welch’s t tests. (K) Model of natural human genetic variation altering intracellular S. Typhi replication.

References

    1. Gibbs K.D., Schott B.H., Ko D.C. The awesome power of human genetics of infectious disease. Annu. Rev. Genet. 2022;56:41–62. doi: 10.1146/annurev-genet-080320-010449. - DOI - PubMed
    1. Barreiro L.B., Tailleux L., Pai A.A., Gicquel B., Marioni J.C., Gilad Y. Deciphering the genetic architecture of variation in the immune response to Mycobacterium tuberculosis infection. Proc. Natl. Acad. Sci. USA. 2012;109:1204–1209. doi: 10.1073/pnas.1115761109. - DOI - PMC - PubMed
    1. Fairfax B.P., Humburg P., Makino S., Naranbhai V., Wong D., Lau E., Jostins L., Plant K., Andrews R., McGee C., Knight J.C. Innate immune activity conditions the effect of regulatory variants upon monocyte gene expression. Science. 2014;343:1246949. doi: 10.1126/science.1246949. - DOI - PMC - PubMed
    1. Lee M.N., Ye C., Villani A.C., Raj T., Li W., Eisenhaure T.M., Imboywa S.H., Chipendo P.I., Ran F.A., Slowikowski K., et al. Common genetic variants modulate pathogen-sensing responses in human dendritic cells. Science. 2014;343:1246980. doi: 10.1126/science.1246980. - DOI - PMC - PubMed
    1. Ko D.C., Shukla K.P., Fong C., Wasnick M., Brittnacher M.J., Wurfel M.M., Holden T.D., O'Keefe G.E., Van Yserloo B., Akey J.M., Miller S.I. A genome-wide in vitro bacterial-infection screen reveals human variation in the host response associated with inflammatory disease. Am. J. Hum. Genet. 2009;85:214–227. doi: 10.1016/j.ajhg.2009.07.012. - DOI - PMC - PubMed

LinkOut - more resources