Correspondence between BOLD fMRI task response and cerebrovascular reactivity across the cerebral cortex
- PMID: 37228813
- PMCID: PMC10203231
- DOI: 10.3389/fphys.2023.1167148
Correspondence between BOLD fMRI task response and cerebrovascular reactivity across the cerebral cortex
Abstract
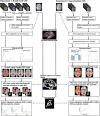
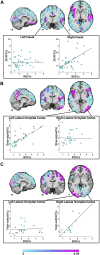
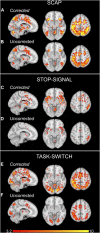
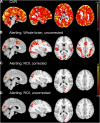
BOLD sensitivity to baseline perfusion and blood volume is a well-acknowledged fMRI confound. Vascular correction techniques based on cerebrovascular reactivity (CVR) might reduce variance due to baseline cerebral blood volume, however this is predicated on an invariant linear relationship between CVR and BOLD signal magnitude. Cognitive paradigms have relatively low signal, high variance and involve spatially heterogenous cortical regions; it is therefore unclear whether the BOLD response magnitude to complex paradigms can be predicted by CVR. The feasibility of predicting BOLD signal magnitude from CVR was explored in the present work across two experiments using different CVR approaches. The first utilized a large database containing breath-hold BOLD responses and 3 different cognitive tasks. The second experiment, in an independent sample, calculated CVR using the delivery of a fixed concentration of carbon dioxide and a different cognitive task. An atlas-based regression approach was implemented for both experiments to evaluate the shared variance between task-invoked BOLD responses and CVR across the cerebral cortex. Both experiments found significant relationships between CVR and task-based BOLD magnitude, with activation in the right cuneus (R 2 = 0.64) and paracentral gyrus (R 2 = 0.71), and the left pars opercularis (R 2 = 0.67), superior frontal gyrus (R 2 = 0.62) and inferior parietal cortex (R 2 = 0.63) strongly predicted by CVR. The parietal regions bilaterally were highly consistent, with linear regressions significant in these regions for all four tasks. Group analyses showed that CVR correction increased BOLD sensitivity. Overall, this work suggests that BOLD signal response magnitudes to cognitive tasks are predicted by CVR across different regions of the cerebral cortex, providing support for the use of correction based on baseline vascular physiology.
Keywords: BOLD; attention; cerebral blood blow; cerebrovascular reactivity; cognition; functional magnet resonance imaging (fMRI); hypercapnia; vascular physiology.
Copyright © 2023 Williams, Specht, Mazerolle, Lebel, MacDonald and Pike.
Conflict of interest statement
RL was employed by GE Healthcare. The remaining authors declare that the research was conducted in the absence of any commercial or financial relationships that could be construed as a potential conflict of interest.
Figures


Similar articles
-
Comparison of BOLD cerebrovascular reactivity mapping and DSC MR perfusion imaging for prediction of neurovascular uncoupling potential in brain tumors.Technol Cancer Res Treat. 2012 Aug;11(4):361-74. doi: 10.7785/tcrt.2012.500284. Epub 2012 Mar 1. Technol Cancer Res Treat. 2012. PMID: 22376130
-
The voxel-wise analysis of false negative fMRI activation in regions of provoked impaired cerebrovascular reactivity.PLoS One. 2019 May 6;14(5):e0215294. doi: 10.1371/journal.pone.0215294. eCollection 2019. PLoS One. 2019. PMID: 31059517 Free PMC article.
-
Breath-hold BOLD fMRI without CO2 sampling enables estimation of venous cerebral blood volume: potential use in normalization of stimulus-evoked BOLD fMRI data.Neuroimage. 2024 Jan;285:120492. doi: 10.1016/j.neuroimage.2023.120492. Epub 2023 Dec 7. Neuroimage. 2024. PMID: 38070840
-
The Role of Cerebrovascular-Reactivity Mapping in Functional MRI: Calibrated fMRI and Resting-State fMRI.Front Physiol. 2021 Mar 25;12:657362. doi: 10.3389/fphys.2021.657362. eCollection 2021. Front Physiol. 2021. PMID: 33841190 Free PMC article. Review.
-
Cerebrovascular reactivity (CVR) MRI with CO2 challenge: A technical review.Neuroimage. 2019 Feb 15;187:104-115. doi: 10.1016/j.neuroimage.2018.03.047. Epub 2018 Mar 21. Neuroimage. 2019. PMID: 29574034 Free PMC article. Review.
Cited by
-
Functional Brain Changes in Younger Population of Cervical Spondylosis Patients with Chronic Neck Pain.J Pain Res. 2024 Dec 19;17:4433-4445. doi: 10.2147/JPR.S488988. eCollection 2024. J Pain Res. 2024. PMID: 39720323 Free PMC article.
-
The role of cerebrovascular reactivity on brain activation during a working memory task in type 2 diabetes.Alzheimers Dement (Amst). 2025 Mar 12;17(1):e70045. doi: 10.1002/dad2.70045. eCollection 2025 Jan-Mar. Alzheimers Dement (Amst). 2025. PMID: 40078378 Free PMC article.
-
Choroid plexus volumes and auditory verbal learning scores are associated with conversion from mild cognitive impairment to Alzheimer's disease.Brain Behav. 2024 Jul;14(7):e3611. doi: 10.1002/brb3.3611. Brain Behav. 2024. PMID: 38956818 Free PMC article.
References
LinkOut - more resources
Full Text Sources
Miscellaneous

