. 2023 May 9:14:1147145.
doi: 10.3389/fpls.2023.1147145. eCollection 2023.

Combined analysis of metabolome and transcriptome of wheat kernels reveals constitutive defense mechanism against maize weevils

Affiliations

Combined analysis of metabolome and transcriptome of wheat kernels reveals constitutive defense mechanism against maize weevils

Liangjie Lv et al. Front Plant Sci. .

Abstract

Sitophilus zeamais (maize weevil) is one of the most destructive pests that seriously affects the quantity and quality of wheat (Triticum aestivum L.). However, little is known about the constitutive defense mechanism of wheat kernels against maize weevils. In this study, we obtained a highly resistant variety RIL-116 and a highly susceptible variety after two years of screening. The morphological observations and germination rates of wheat kernels after feeding ad libitum showed that the degree of infection in RIL-116 was far less than that in RIL-72. The combined analysis of metabolome and transcriptome of RIL-116 and RIL-72 wheat kernels revealed differentially accumulated metabolites were mainly enriched in flavonoids biosynthesis-related pathway, followed by glyoxylate and dicarboxylate metabolism, and benzoxazinoid biosynthesis. Several flavonoids metabolites were significantly up-accumulated in resistant variety RIL-116. In addition, the expression of structural genes and transcription factors (TFs) related to flavonoids biosynthesis were up-regulated to varying degrees in RIL-116 than RIL-72. Taken together, these results indicated that the biosynthesis and accumulation of flavonoids contributes the most to wheat kernels defense against maize weevils. This study not only provides insights into the constitutive defense mechanism of wheat kernels against maize weevils, but may also play an important role in the breeding of resistant varieties.

Keywords: Sitophilus zeamais; Triticum aestivum L.; constitutive defense; flavonoids biosynthesis; metabolome; transcriptome.


Conflict of interest statement

The authors declare that the research was conducted in the absence of any commercial or financial relationships that could be construed as a potential conflict of interest.

Figures

Figure 1
Figure 1
The characteristics and germination test of RIL-116 and RIL-72 after maize weevils attacking. (A, B) The characteristics of RIL-116 and RIL-72 after maize weevils attacking: (A) RIL-116, (B) RIL-72. (C, D) The germination test of RIL-116 and RIL-72 after maize weevils attacking: (C) RIL-116, (D) RIL-72.
Figure 2
Figure 2
The metabolic profiling of RIL-116 and RIL-72. (A) Volcano plot of differential metabolites in the comparison of RIL-116 (IR) and RIL-72 (CK). Each point in the volcano map represents a metabolite, red represent up-accumulated metabolites and blue represent down-accumulated metabolites. (B) Clustering heat map of differential metabolites. The level of each metabolites relative content were depicted by color range from blue (low) to red (high). (C) The number of classification of up-accumulated metabolites. (D) The number and classification of down-accumulated metabolites. (E) The abundance histogram of top 10 up-accumulated metabolites (red-bars) and top 10 down-accumulated metabolites (green bars). (F) KEGG analysis of differentially accumulated metabolites.
Figure 3
Figure 3
The overall analysis of RIL-116 and RIL-72 transcriptomic data. (A) Correlation analysis of all samples. (B) Clustering heat map of all DEGs from 30 samples. The relative expression level of each genes depicted by color range from green (low) to red (high). (C) The number of up- and down-regulated DEGs in five comparisons (IR1 vs. CK1, IR2 vs. CK2, IR3 vs. CK3, IR4 vs. CK4, and IR5 vs. CK5). (D) The venn diagram of DEGs in five comparisons to display the common and unique number of DEG.
Figure 4
Figure 4
The GO classification and KEGG enrichment analysis of DEGs. (A) The GO classification of DEGs from five comparisons (IR1 vs. CK1, IR2 vs. CK2, IR3 vs. CK3, IR4 vs. CK4, and IR5 vs. CK5). a:molecular function, b: cellular component, and c: biological process. (B) The KEGG pathway enrichment of DEGs in five comparisons. a: cellular processes, b: environmental information processing, c: genetic information processing, d: metabolism, and e: organismal systems.
Figure 5
Figure 5
The classification and expression pattern of differentially expressed transcription factors. (A) The family distribution of transcription factors. (B) A heat map exhibit the expression pattern of transcription factors in different comparisons according to log2 fold change. The colors range from blue to red indicate low to high expression.
Figure 6
Figure 6
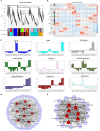
The WGCNA of differentially expressed genes. (A) The hierarchical clustering dendrogram of DEGs. The modules were divided base on the dynamic tree cut method. The color row was used to visualization of original modules and merged modules. (B) The correlation heat map between modules and samples based on Pearson's correlations. Each cell contains the corresponding correlation and p-value. The colors from green to red indicate low to high correlation. (C) The genes expression profiles of modules related to wheat resistance. (D) The genes co-expression network of blue module. (E) The genes co-expression network of thistle module. The hub genes in each were highlighted by red triangles.
Figure 7
Figure 7
The combined analysis of trancriptome and metabolome. (A) The number of DAMs and DEGs enriched in common KEGG pathways. ko00941: flavonoid biosynthesis, ko000942: anthocyanin biosynthesis, ko00944: flavone and flavonol biosynthesis, ko00630: glyoxylate and dicarboxylate metabolism, and ko00402: benzoxazinoid biosynthesis. (B) The correlation coefficient clustering heat map between DAMs and DEGs based on Pearson's correlation coefficient. The colors from green to red indicate low to high correlation. (C) The correlation network diagram between DAMs and DEGs involved in flavonoids biosynthesis-related pathways. HJAP110: myricetin-O-rhamnoside, Lmzp002365: hesperetin-7-O-glucoside, mws0036: hesperidin, msw0048: vitexin, and pme0001: neohesperidin. (D) The correlation network diagram between DAMs and DEGs annotated in benzoxaziniod biosynthesis pathway. Hmlp002485: DIBOA-glucoside and msw2591: DIBOA. Metabolites are represented by green circles and genes are represented by gray circles. The size of the red circle represents the number of genes associated with the metabolite. The thickness of the ring frame of metabolite circles indicate the differential multiple of metabolites. The red and green lines indicate positive and negative correlation, respectively. The line thickness between nodes represents the degree of correlation between two nodes.
Figure 8
Figure 8
The expression profiles of DEGs and DAGs involved in flavonoids biosynthesis metabolism in the wheat kernels of resistant variety and susceptible variety. The rectangels with different colors represent the metabolites in the comparison of CK vs. IR. Red indicates up-accumulated. Sky blue indicates down-accumulated. Gray indicates not differential metabolites or not annotated metabolites. 4CL: 4-coumarate—CoA ligase; ANS: anthocyanidin synthase; CHI: chalcone isomerase; CHS: chalcone synthase; CYP73: trans-cinnamate 4-monooxygenase; FLS: flavonol synthase; F3'H: flavonoid 3'-monooxygenase; DFR: dihydroflavonol 4-reductase; F3'5'H: Flavonoid 3'5'-hydroxylase; BZ1: anthocyanidin 3-O-glucosyltransferase; PAL: phenylalanine ammonia-lyase. The expression profiles of each annotated gene encoding enzymes are presented as heatmaps. The color bar represent the value of log2 fold change with the scale ranging from blue (low) to red (high). (1): phenylpropanoid biosynthesis, (2): flavonoid biosynthesis, (3): isoflavonoid biosynthesis, (4): flavone and flavonol biosynthesis, and (5): anthocyanin biosynthesis.

Similar articles

Cited by

References

    1. Agarrwal R., Padmakumari A. P., Bentur J. S., Nair S. (2016). Metabolic and transcriptomic changes induced in host during hypersensitive response mediated resistance in rice against the Asian rice gall midge. Rice (N. Y). 9, 5. doi: 10.1186/s12284-016-0077-6 - DOI - PMC - PubMed
    1. Aljbory Z., Chen M. S. (2018). Indirect plant defense against insect herbivores: a review. Insect Sci. 25, 2–23. doi: 10.1111/1744-7917.12436 - DOI - PubMed
    1. Antunes C., Mendes R., Lima A., Barros G., Fields P., Da Costa L. B., et al. . (2016). Resistance of rice varieties to the stored-product insect, sitophilus zeamais (Coleoptera: curculionidae). J. Econ. Entomol. 109, 445–453. doi: 10.1093/jee/tov260 - DOI - PubMed
    1. Dai Z., Tan J., Zhou C., Yang X., Yang F., Zhang S., et al. . (2019). The OsmiR396-OsGRF8-OsF3H-flavonoid pathway mediates resistance to the brown planthopper in rice (Oryza sativa). Plant Biotechnol. J. 17, 1657–1669. doi: 10.1111/pbi.13091 - DOI - PMC - PubMed
    1. Dong N. Q., Lin H. X. (2021). Contribution of phenylpropanoid metabolism to plant development and plant-environment interactions. J. Integr. Plant Biol. 63, 180–209. doi: 10.1111/jipb.13054 - DOI - PubMed

LinkOut - more resources