

Evaluation of nutritional status and clinical depression classification using an explainable machine learning method
- PMID: 37229464
- PMCID: PMC10203418
- DOI: 10.3389/fnut.2023.1165854
Evaluation of nutritional status and clinical depression classification using an explainable machine learning method
Abstract
Introduction: Depression is a prevalent disorder worldwide, with potentially severe implications. It contributes significantly to an increased risk of diseases associated with multiple risk factors. Early accurate diagnosis of depressive symptoms is a critical first step toward management, intervention, and prevention. Various nutritional and dietary compounds have been suggested to be involved in the onset, maintenance, and severity of depressive disorders. Despite the challenges to better understanding the association between nutritional risk factors and the occurrence of depression, assessing the interplay of these markers through supervised machine learning remains to be fully explored.
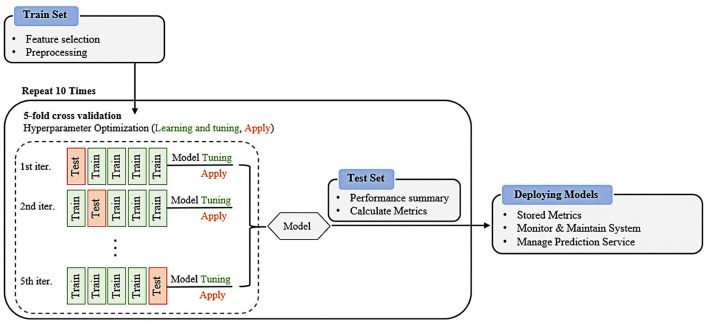
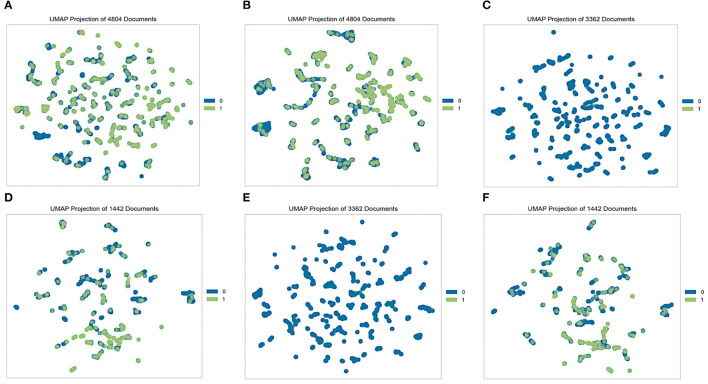
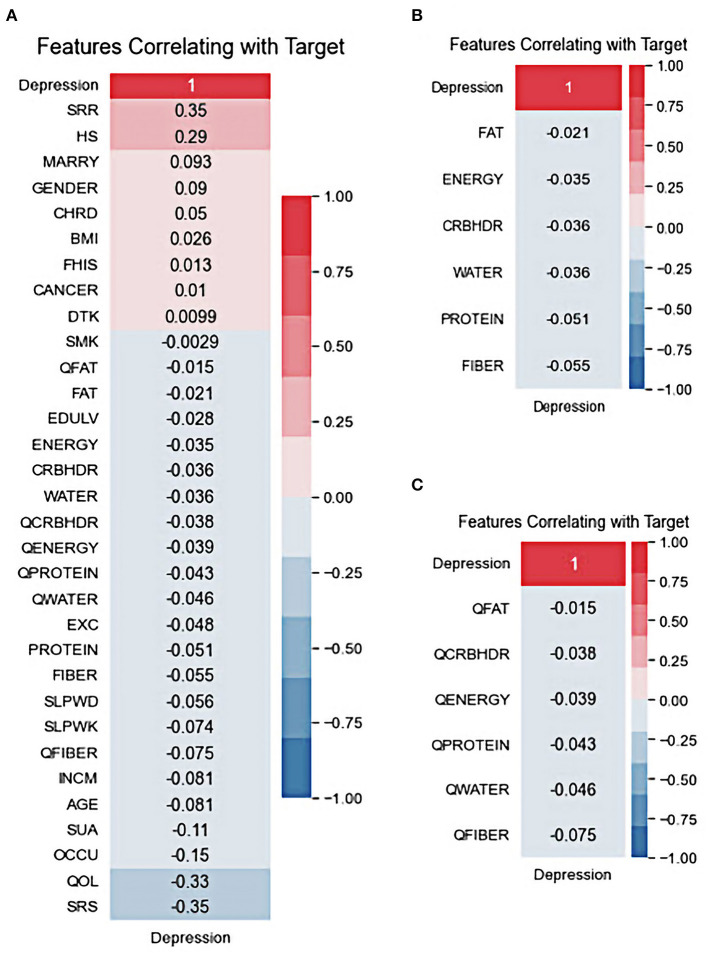
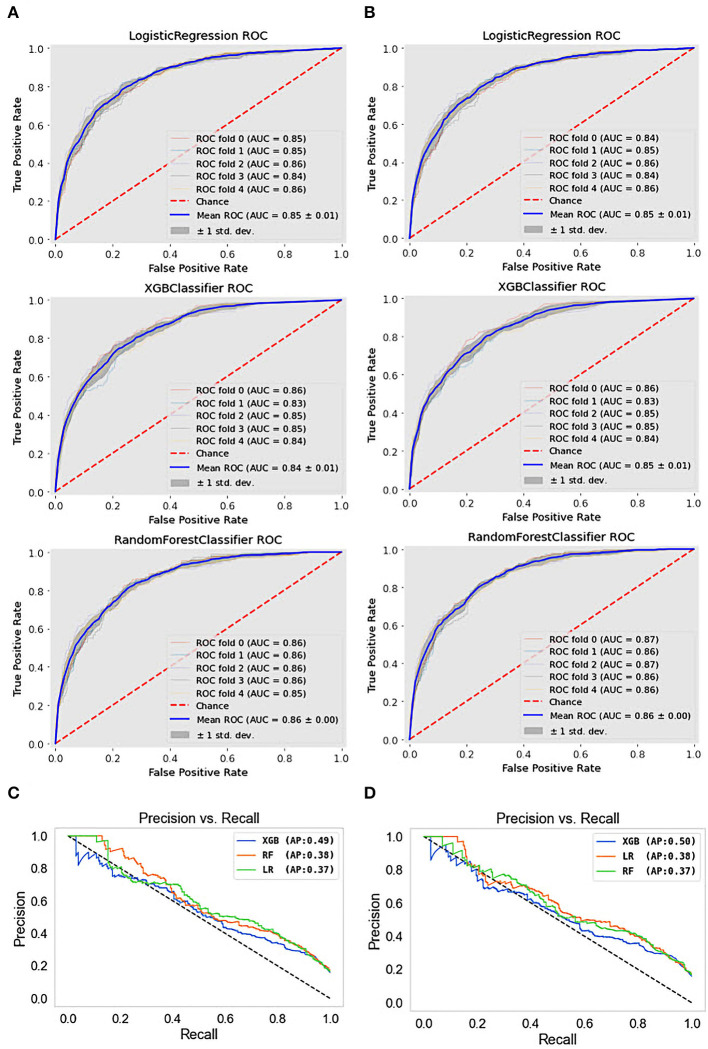
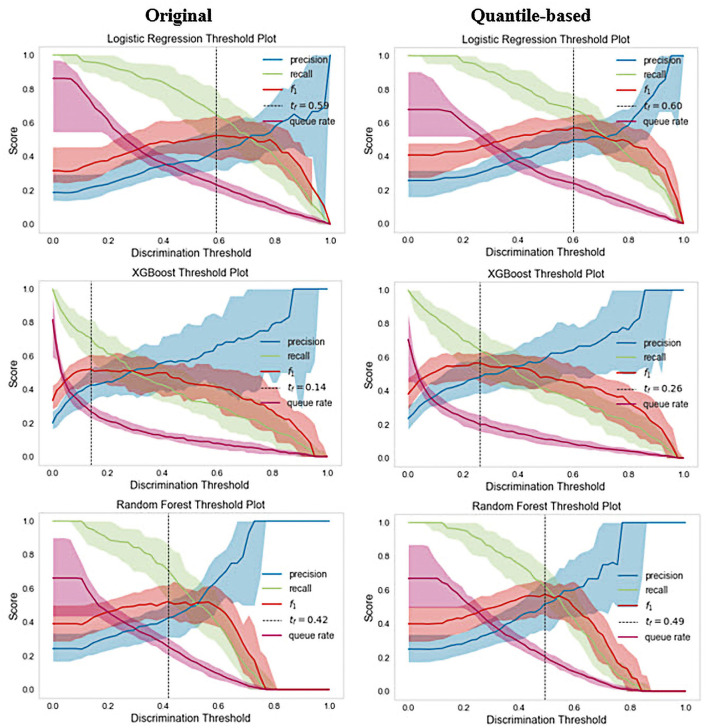
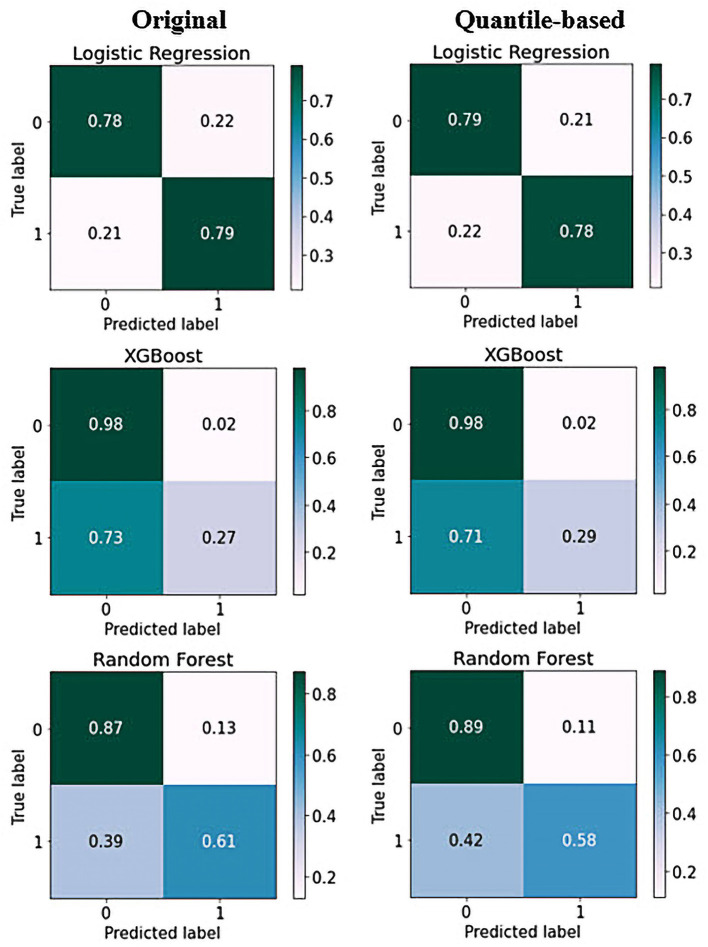
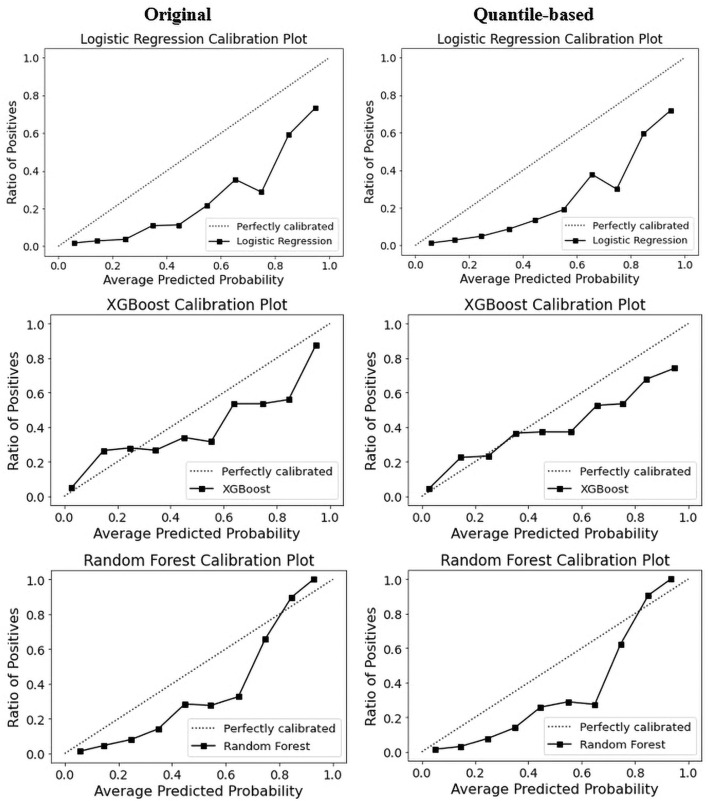
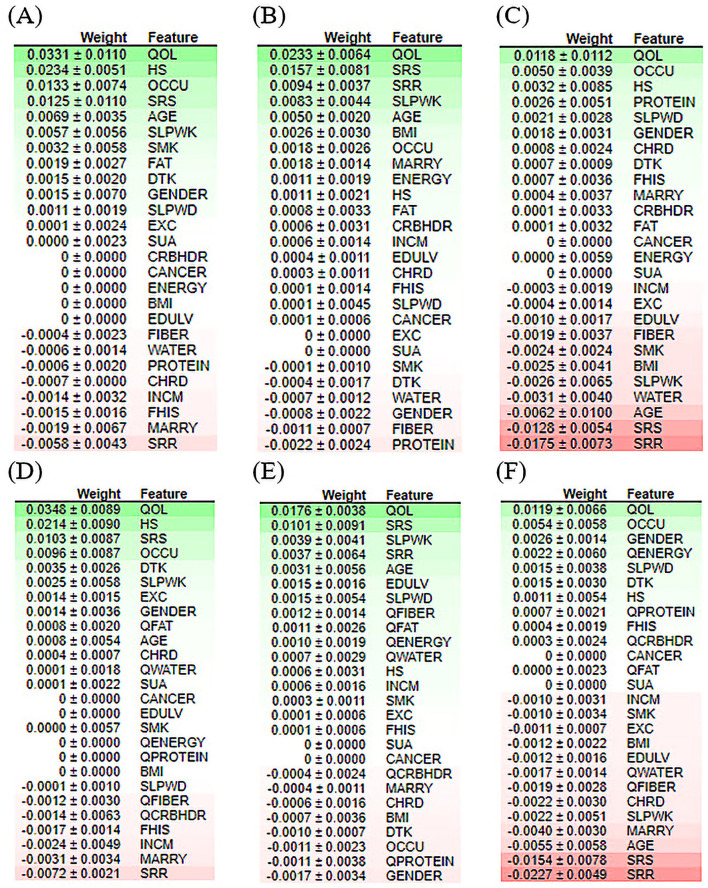
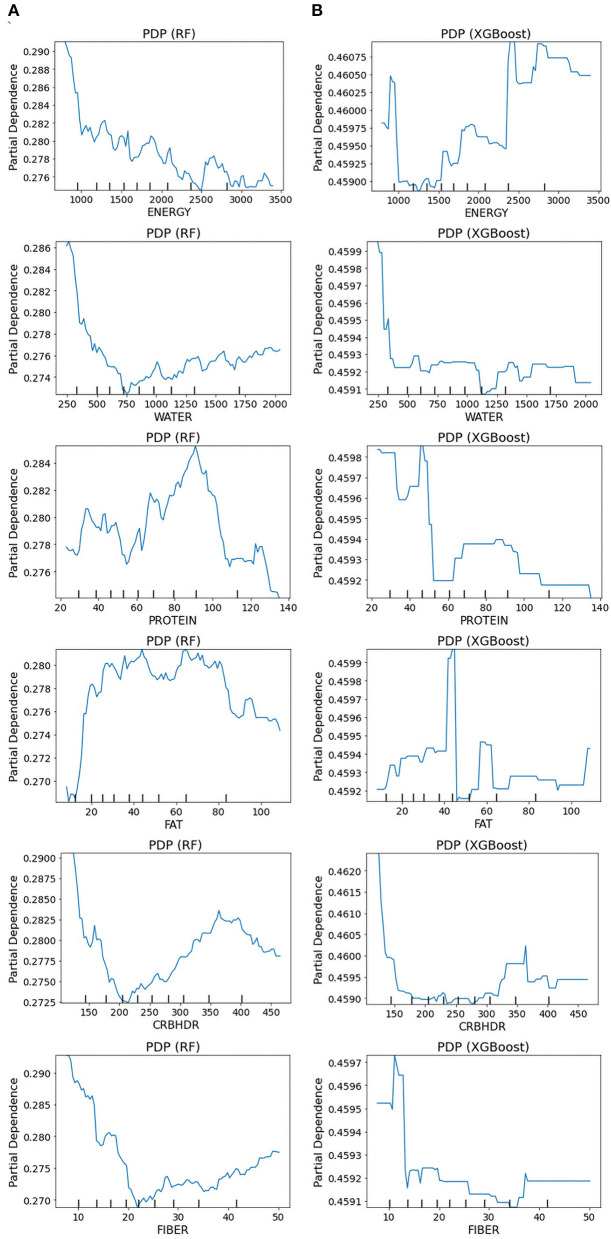
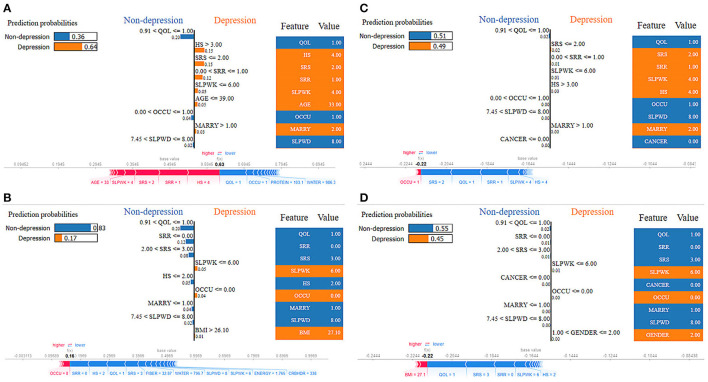
Methods: This study aimed to determine the ability of machine learning-based decision support methods to identify the presence of depression using publicly available health data from the Korean National Health and Nutrition Examination Survey. Two exploration techniques, namely, uniform manifold approximation and projection and Pearson correlation, were performed for explanatory analysis among datasets. A grid search optimization with cross-validation was performed to fine-tune the models for classifying depression with the highest accuracy. Several performance measures, including accuracy, precision, recall, F1 score, confusion matrix, areas under the precision-recall and receiver operating characteristic curves, and calibration plot, were used to compare classifier performances. We further investigated the importance of the features provided: visualized interpretation using ELI5, partial dependence plots, and local interpretable using model-agnostic explanations and Shapley additive explanation for the prediction at both the population and individual levels.
Results: The best model achieved an accuracy of 86.18% for XGBoost and an area under the curve of 84.96% for the random forest model in original dataset and the XGBoost algorithm with an accuracy of 86.02% and an area under the curve of 85.34% in the quantile-based dataset. The explainable results revealed a complementary observation of the relative changes in feature values, and, thus, the importance of emergent depression risks could be identified.
Discussion: The strength of our approach is the large sample size used for training with a fine-tuned model. The machine learning-based analysis showed that the hyper-tuned model has empirically higher accuracy in classifying patients with depressive disorder, as evidenced by the set of interpretable experiments, and can be an effective solution for disease control.
Keywords: classification; clinical depression; depression; interpretability; machine learning; nutrition.
Copyright © 2023 Hosseinzadeh Kasani, Lee, Park, Yun, Jang and Lee.
Conflict of interest statement
The authors declare that the research was conducted in the absence of any commercial or financial relationships that could be construed as a potential conflict of interest.
Figures
References
-
- Layne C, Merry J, Christian J, Ginn P. Motivational deficit in depression. Cognit Ther Res. (1982) 6:259–73. 10.1007/BF01173575 - DOI
LinkOut - more resources
Full Text Sources
Other Literature Sources