

Fecal metabolomics combined with 16S rRNA gene sequencing to analyze the effect of Jiaotai pill intervention in type 2 diabetes mellitus rats
- PMID: 37229468
- PMCID: PMC10203393
- DOI: 10.3389/fnut.2023.1135343
Fecal metabolomics combined with 16S rRNA gene sequencing to analyze the effect of Jiaotai pill intervention in type 2 diabetes mellitus rats
Abstract
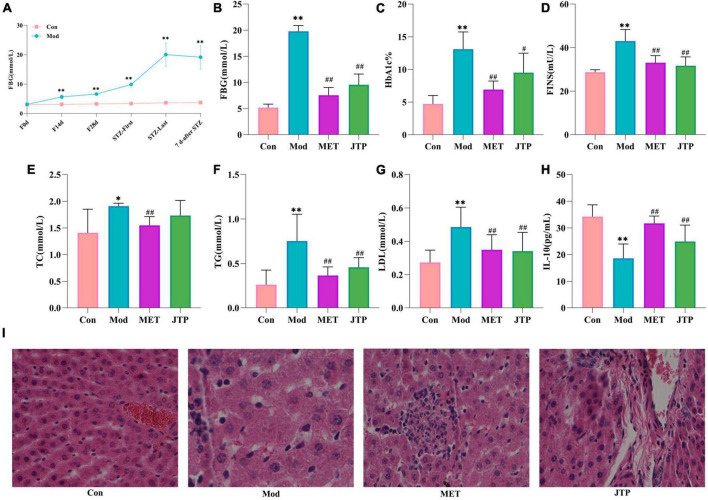
The occurrence and development of type 2 diabetes mellitus (T2DM) are closely related to gut microbiota. Jiaotai pill (JTP) is used to treat type 2 diabetes mellitus, with definite efficacy in clinical practice. However, it is not clear whether the therapeutic effect is produced by regulating the changes in gut microbiota and its metabolism. In this study, T2DM rat models were established by a high-fat diet and low-dose streptozotocin (STZ). Based on the pharmacodynamic evaluation, the mechanism of JTP in the treatment of type 2 diabetes mellitus was investigated by fecal metabolism and 16S rRNA gene sequencing. The results showed that JTP decreased blood glucose (FBG, HbA1c) and blood lipid (TC, TG, and LDL) levels and alleviated insulin resistance (FINS, IL-10) in T2DM rats. 16S rRNA gene sequencing results revealed that JTP increased microbiota diversity and reversed the disorder of gut microbiota in T2DM rats, and therefore achieved the therapeutic effect in T2DM. JTP regulated 13 differential flora, which were Actinobacteria, Bacteroidetes, Firmicutes, Proteobacteria, Eubacteriaceae, Prevotellaceae, Ruminococcaceae, Clostridium_IV, Clostridium_XlVa, Eubacterium, Fusicatenibacter, Romboutsia, and Roseburia. Metabolomics analysis showed that JTP interfered with 13 biomarkers to play a therapeutic role in type 2 diabetes mellitus. They were L-Valine, Choline, L-Aspartic acid, Serotonin, L-Lysine, L-Histidine, 3-Hydroxybutyric acid, Pyruvic acid, N-Acetylornithine, Arachidonic acid, L-Tryptophan, L-Alanine, and L-Methionine. KEGG metabolic pathway analysis of the above differential metabolites and gut microbiota by using the MetaboAnalyst database and Picrust software. It was found that JTP treated type 2 diabetes mellitus by affecting metabolic pathways such as amino acid metabolism, carbohydrate metabolism, and lipid metabolism. Spearman correlation analysis revealed high correlations for 7 pharmacological indicators, 12 biomarkers, and 11 gut microbiota. In this study, the therapeutic effect and potential mechanism of JTP on type 2 diabetes mellitus were preliminarily demonstrated by gut microbiota and metabolomics, which could provide a theoretical basis for the treatment of T2DM with JTP.
Keywords: 16S rRNA gene sequencing; Jiaotai pill; UPLC-Q-exactive focus MS; metabolomics; type 2 diabetes mellitus.
Copyright © 2023 Liu, Wang, Li, Piao, Fan, Zhang, Yang and Wu.
Conflict of interest statement
The authors declare that the research was conducted in the absence of any commercial or financial relationships that could be construed as a potential conflict of interest.
Figures


Similar articles
-
Fecal metabonomics combined with 16S rRNA gene sequencing to analyze the changes of gut microbiota in rats with kidney-yang deficiency syndrome and the intervention effect of You-gui pill.J Ethnopharmacol. 2019 Nov 15;244:112139. doi: 10.1016/j.jep.2019.112139. Epub 2019 Aug 8. J Ethnopharmacol. 2019. PMID: 31401318
-
An Integrated Fecal Microbiome and Metabolomics in T2DM Rats Reveal Antidiabetes Effects from Host-Microbial Metabolic Axis of EtOAc Extract from Sophora flavescens.Oxid Med Cell Longev. 2020 May 27;2020:1805418. doi: 10.1155/2020/1805418. eCollection 2020. Oxid Med Cell Longev. 2020. PMID: 32566075 Free PMC article.
-
Integrated 16S rRNA Sequencing and Untargeted Metabolomics Analysis to Reveal the Protective Mechanisms of Polygonatum sibiricum Polysaccharide on Type 2 Diabetes Mellitus Model Rats.Curr Drug Metab. 2023;24(4):270-282. doi: 10.2174/1389200224666230406114012. Curr Drug Metab. 2023. PMID: 37038712
-
Type-2 Diabetes Mellitus and the Gut Microbiota: Systematic Review.Cureus. 2023 Nov 30;15(11):e49740. doi: 10.7759/cureus.49740. eCollection 2023 Nov. Cureus. 2023. PMID: 38161953 Free PMC article. Review.
-
Gut microbiota and its metabolites regulate insulin resistance: traditional Chinese medicine insights for T2DM.Front Microbiol. 2025 Mar 19;16:1554189. doi: 10.3389/fmicb.2025.1554189. eCollection 2025. Front Microbiol. 2025. PMID: 40177494 Free PMC article. Review.
Cited by
-
Integrating 16S rDNA and metabolomics to uncover the therapeutic mechanism of electroacupuncture in type 2 diabetic rats.Front Microbiol. 2025 Jan 6;15:1436911. doi: 10.3389/fmicb.2024.1436911. eCollection 2024. Front Microbiol. 2025. PMID: 39834366 Free PMC article.
-
Combined analysis of cecal microbiota and metabolomics reveals the intervention mechanism of Dayuan Yin in acute lung injury.Front Pharmacol. 2024 Sep 10;15:1436017. doi: 10.3389/fphar.2024.1436017. eCollection 2024. Front Pharmacol. 2024. PMID: 39318776 Free PMC article.
-
Flavonoid-Rich Extracts from Chuju (Asteraceae Chrysanthemum L.) Alleviate the Disturbance of Glycolipid Metabolism on Type 2 Diabetic Mice via Modulating the Gut Microbiota.Foods. 2025 Feb 24;14(5):765. doi: 10.3390/foods14050765. Foods. 2025. PMID: 40077469 Free PMC article.
-
Exploring the effects of Tianma Gouteng granules on L-NAME-induced hypertensive rats based on 16S rDNA gene sequencing and metabolomics.Heliyon. 2025 Jan 10;11(2):e41786. doi: 10.1016/j.heliyon.2025.e41786. eCollection 2025 Jan 30. Heliyon. 2025. PMID: 39897797 Free PMC article.
-
16S rRNA Gene Sequencing Combined with Metabolomics to Explore Intestinal Flora and Metabolic Changes in Young Febrile Rats and the Mechanism of Xiangqin Jiere Granules.Drug Des Devel Ther. 2024 Nov 27;18:5423-5444. doi: 10.2147/DDDT.S479014. eCollection 2024. Drug Des Devel Ther. 2024. PMID: 39618427 Free PMC article.
References
-
- Qi Q, Li J, Yu B, Moon JY, Chai JC, Merino J, et al. Host and gut microbial tryptophan metabolism and type 2 diabetes: an integrative analysis of host genetics, diet, gut microbiome and circulating metabolites in cohort studies. Gut. (2022) 71:1095–105. 10.1136/gutjnl-2021-324053 - DOI - PMC - PubMed
LinkOut - more resources
Full Text Sources
Miscellaneous